

Compact Muon Solenoid
LHC, CERN
| CMS-PAS-TOP-14-021 | ||
| Measurement of top quark pair production in association with a W or Z boson using event reconstruction techniques | ||
| CMS Collaboration | ||
| July 2015 | ||
| Abstract: A measurement of top quark pair production in association with a W or Z boson is presented, using 8 TeV proton-proton collision data corresponding to an integrated luminosity of 19.5 fb$^{-1}$, collected by the CMS experiment at the LHC. Final states are selected in which the associated W boson decays to a charged lepton and a neutrino ($\mathrm{W} \rightarrow \ell\nu$) or the Z boson decays to two charged leptons ($\mathrm{Z} \rightarrow \ell\ell$), where $\ell$ refers to an electron or muon. The $\mathrm{t \bar{t} W}$ cross section is measured to be $\sigma(\mathrm{t \bar{t} W}) = 382^{+117}_{-102}$ fb with a significance of 4.8 standard deviations from the background-only hypothesis. The $\mathrm{t \bar{t} Z}$ cross section is measured to be $\sigma(\mathrm{t \bar{t} Z}) = 242^{+65}_{-55}$ fb with a significance of 6.4 standard deviations from the background-only hypothesis. These measurements are used to find bounds for five anomalous dimension-six operators which would affect the $\mathrm{t \bar{t} W}$ and $\mathrm{t \bar{t} Z}$ cross sections. | ||
|
Links:
CDS record (PDF) ;
Public twiki page ;
CADI line (restricted) ; Figures are available from the CDS record. These preliminary results are superseded in this paper, JHEP 01 (2016) 096. |
||
| Figures | |
png ; pdf |
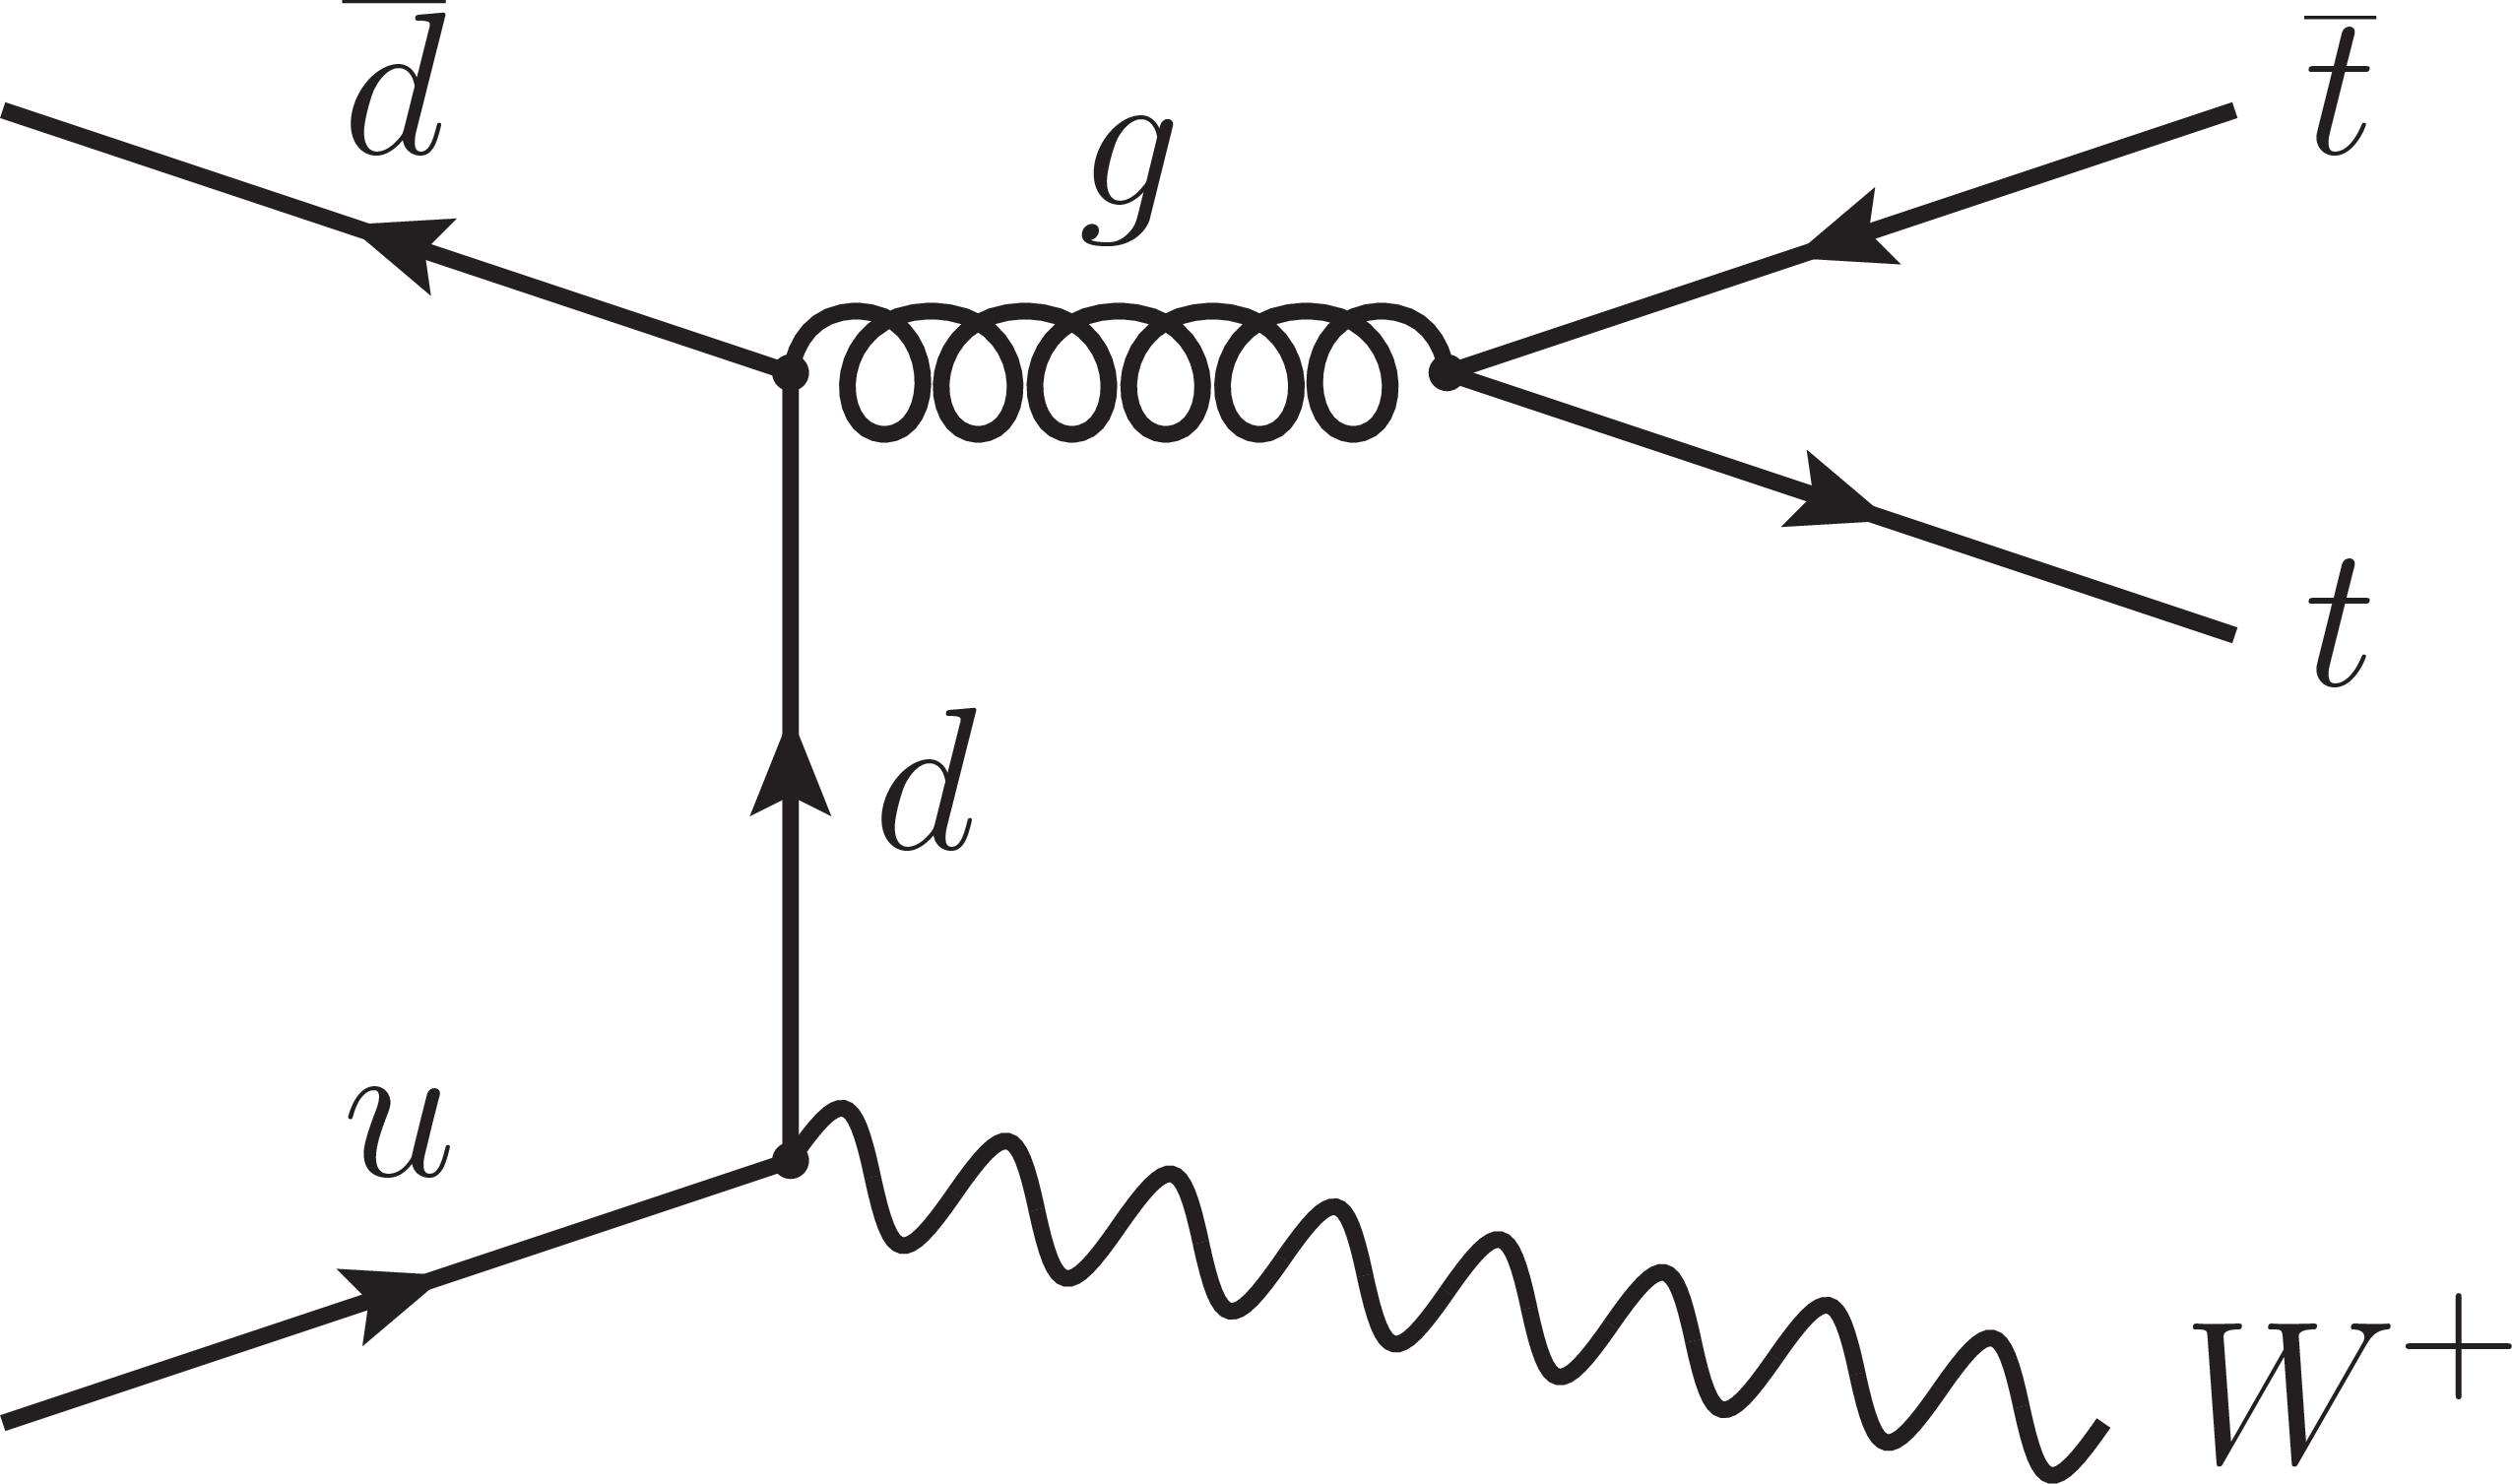
Figure 1-a:
Dominant leading order Feynman diagrams for $ {\mathrm {t}\overline {\mathrm {t}}} {\mathrm {W}}^{+}$ and $ {\mathrm {t}\overline {\mathrm {t}}} {\mathrm {Z}} $ production at the LHC. The charge conjugate process of $ {\mathrm {t}\overline {\mathrm {t}}} {\mathrm {W}}^{+}$ produces $ {\mathrm {t}\overline {\mathrm {t}}} {\mathrm {W}}^{-}$. |
png ; pdf |
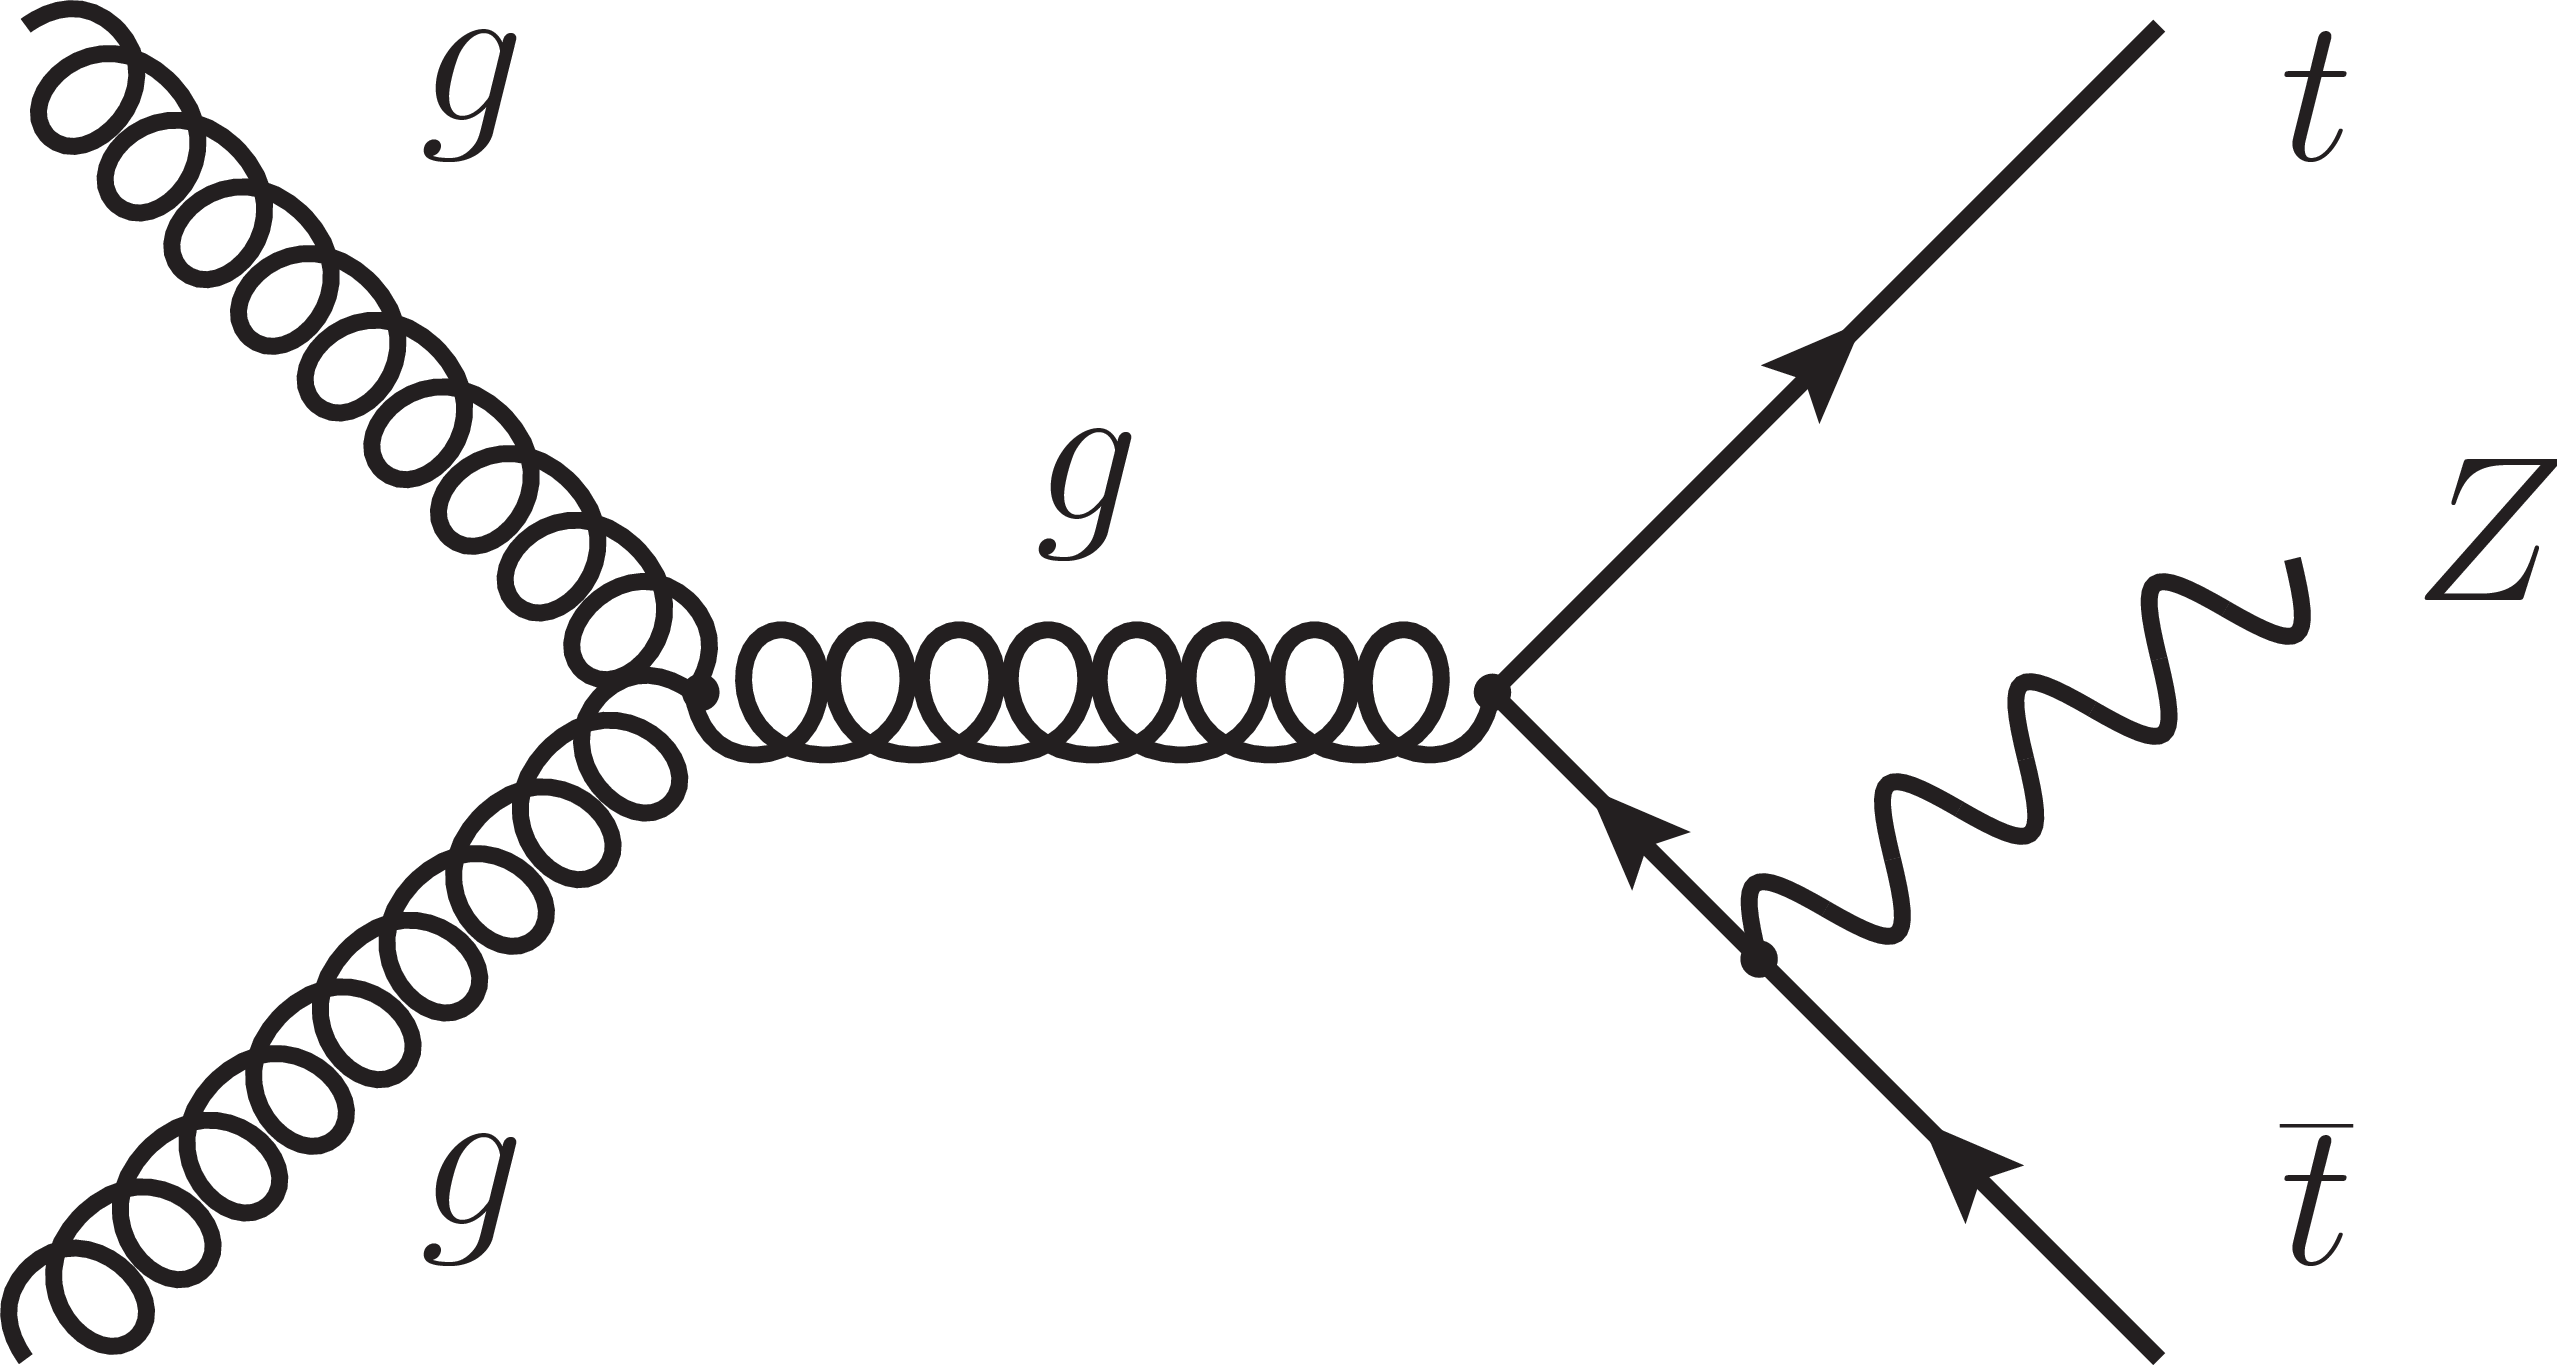
Figure 1-b:
Dominant leading order Feynman diagrams for $ {\mathrm {t}\overline {\mathrm {t}}} {\mathrm {W}}^{+}$ and $ {\mathrm {t}\overline {\mathrm {t}}} {\mathrm {Z}} $ production at the LHC. The charge conjugate process of $ {\mathrm {t}\overline {\mathrm {t}}} {\mathrm {W}}^{+}$ produces $ {\mathrm {t}\overline {\mathrm {t}}} {\mathrm {W}}^{-}$. |
png ; pdf |
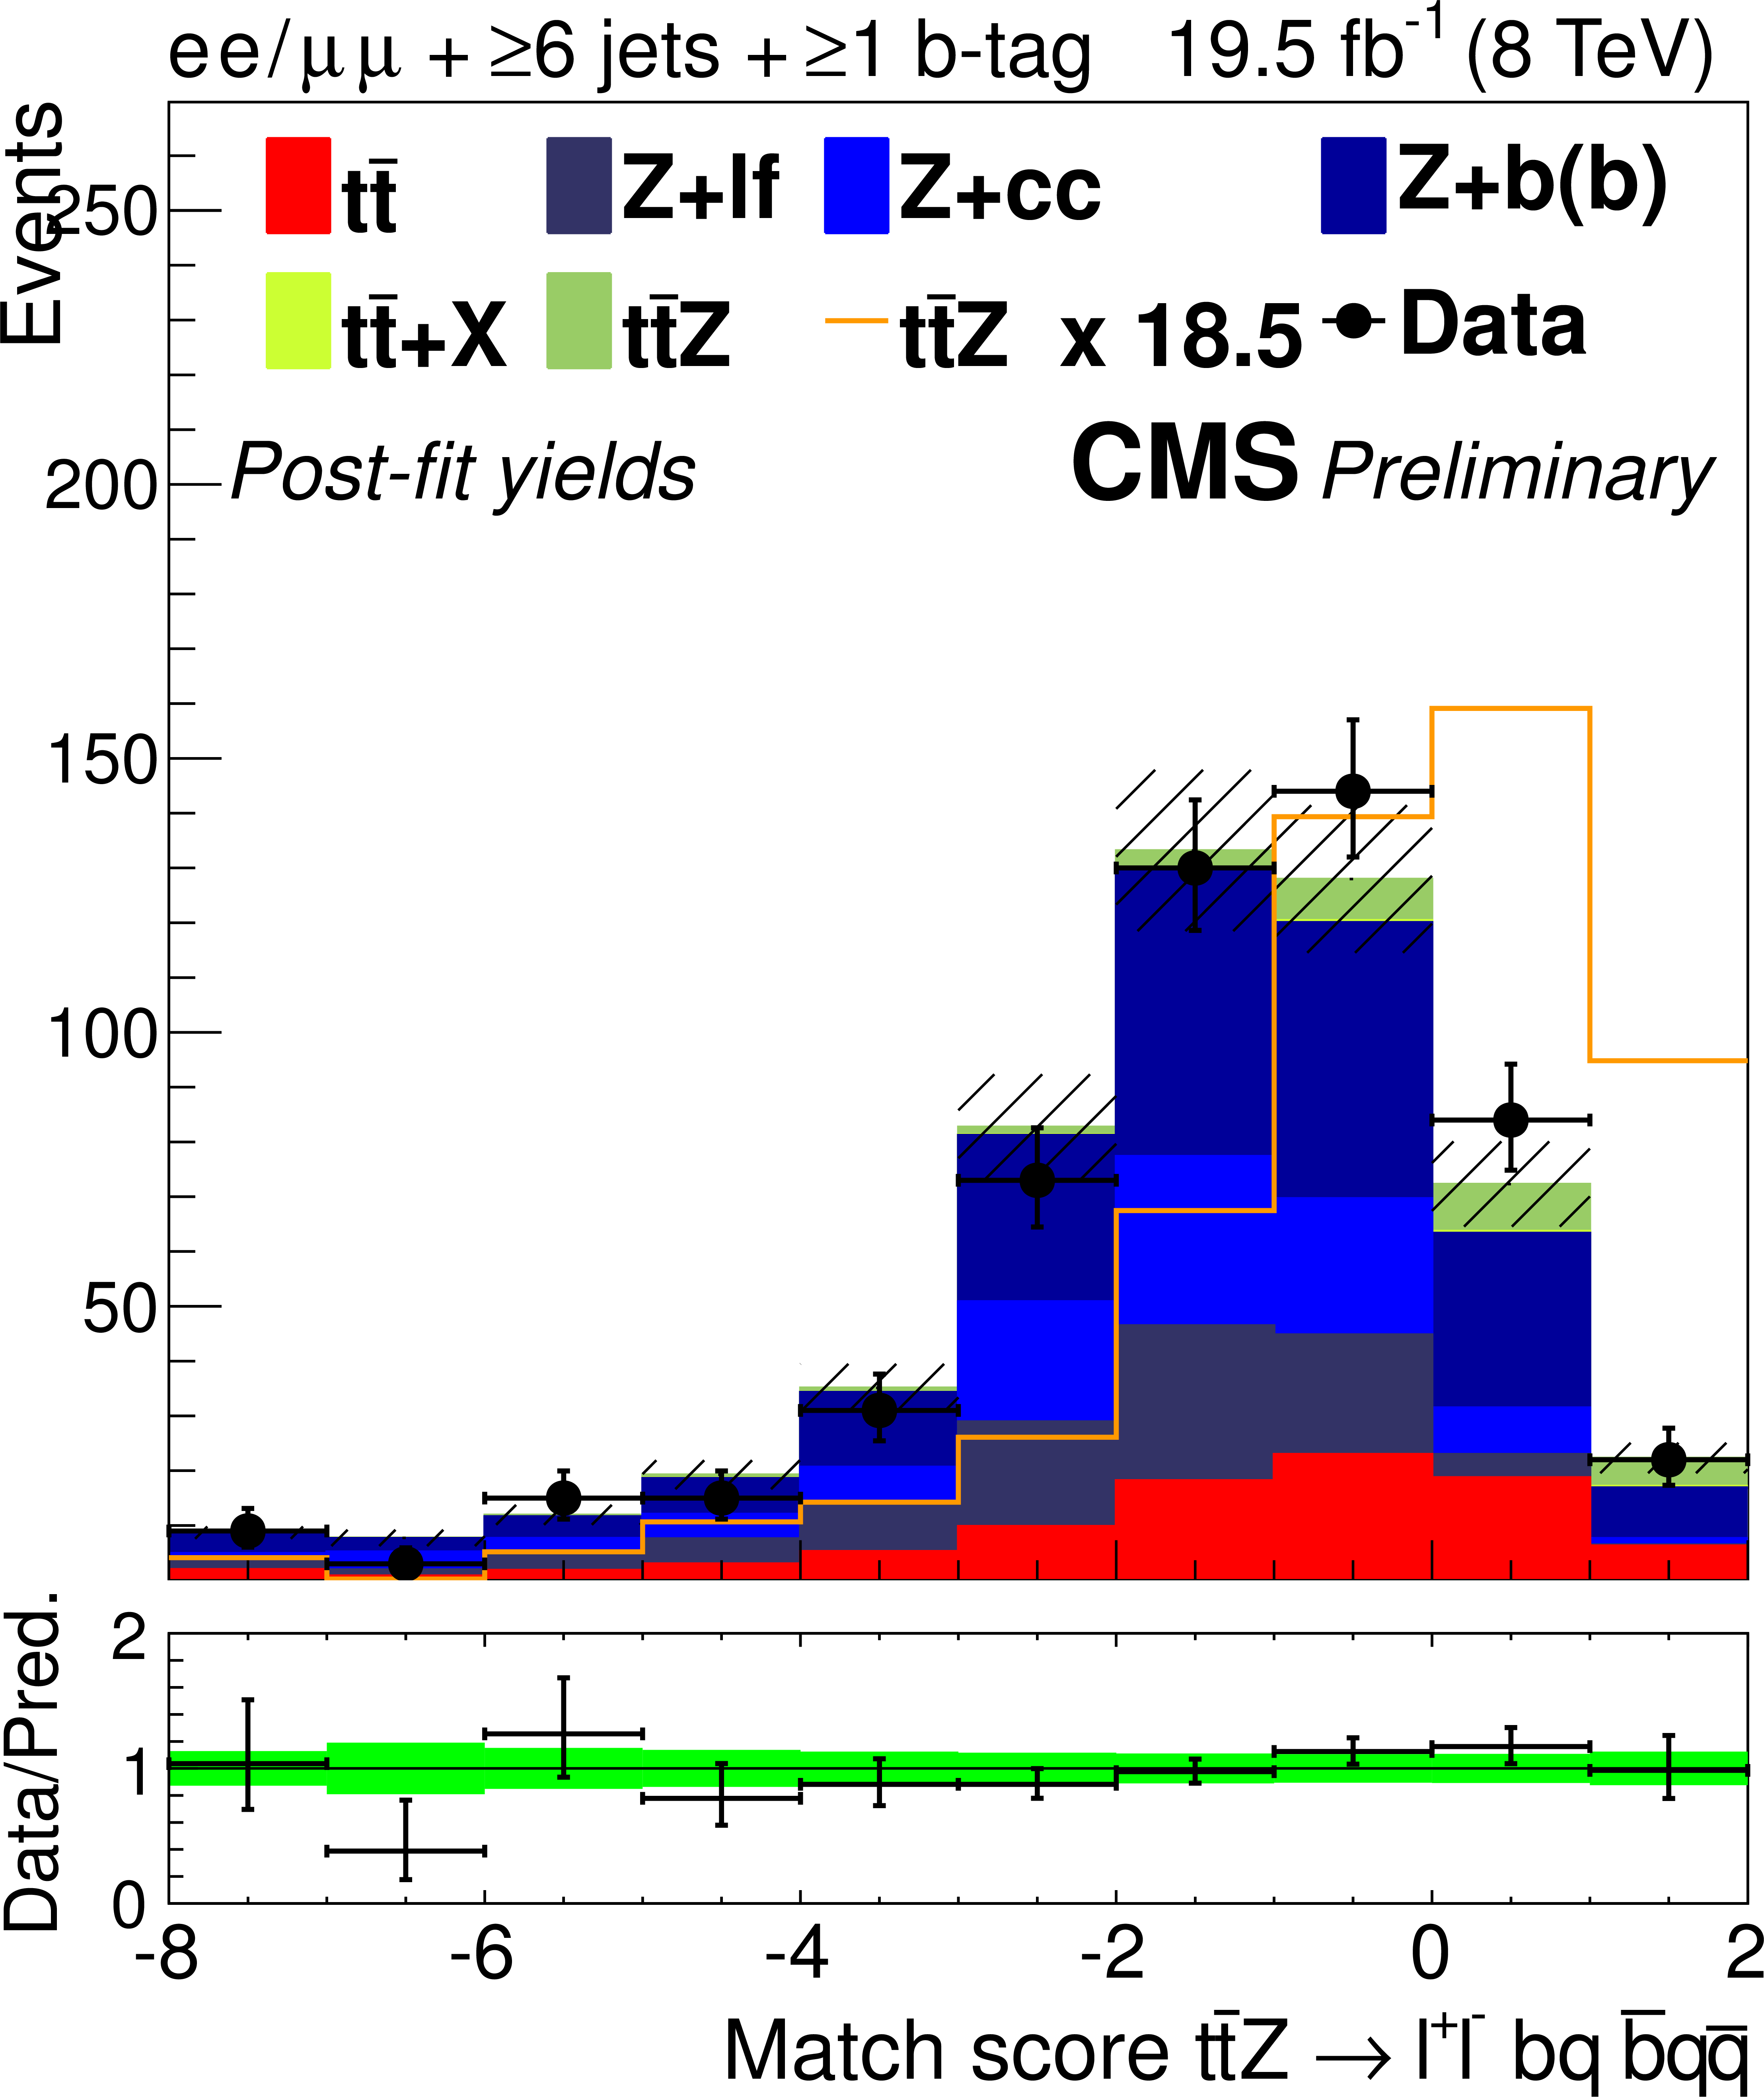
Figure 2-a:
Distributions for match scores with signal and background yields from the final fit described in Section Results-SM. The left plot shows the match score for partially reconstructed hadronic $ {\mathrm {t}\overline {\mathrm {t}}} $ systems in same-flavor opposite-sign dilepton events with six or more jets. The center and right plots show scores for fully reconstructed semi-leptonic $ {\mathrm {t}\overline {\mathrm {t}}} $ systems in events with at least four jets, and a same-sign electron-muon pair, or three leptons, respectively. The 68% CL uncertainty in the signal plus background prediction is represented by hash marks in the stack histogram, and a green shaded region in the data-to-prediction ratio plot. The orange line shows the $ {\mathrm {t}\overline {\mathrm {t}}} {\mathrm {Z}} $ signal normalized to the expected yields. ``Other'' includes $ {\mathrm {t}\overline {\mathrm {t}}} \gamma $, $ {\mathrm {t}\overline {\mathrm {t}}} \gamma ^{*}$, $ {\mathrm {t}\overline {\mathrm {t}}} {\mathrm {W}} {\mathrm {W}}$, tb$ {\mathrm {Z}}$, WWW, WWZ, and W$^{\pm }$W$^{\pm }$. |
png ; pdf |
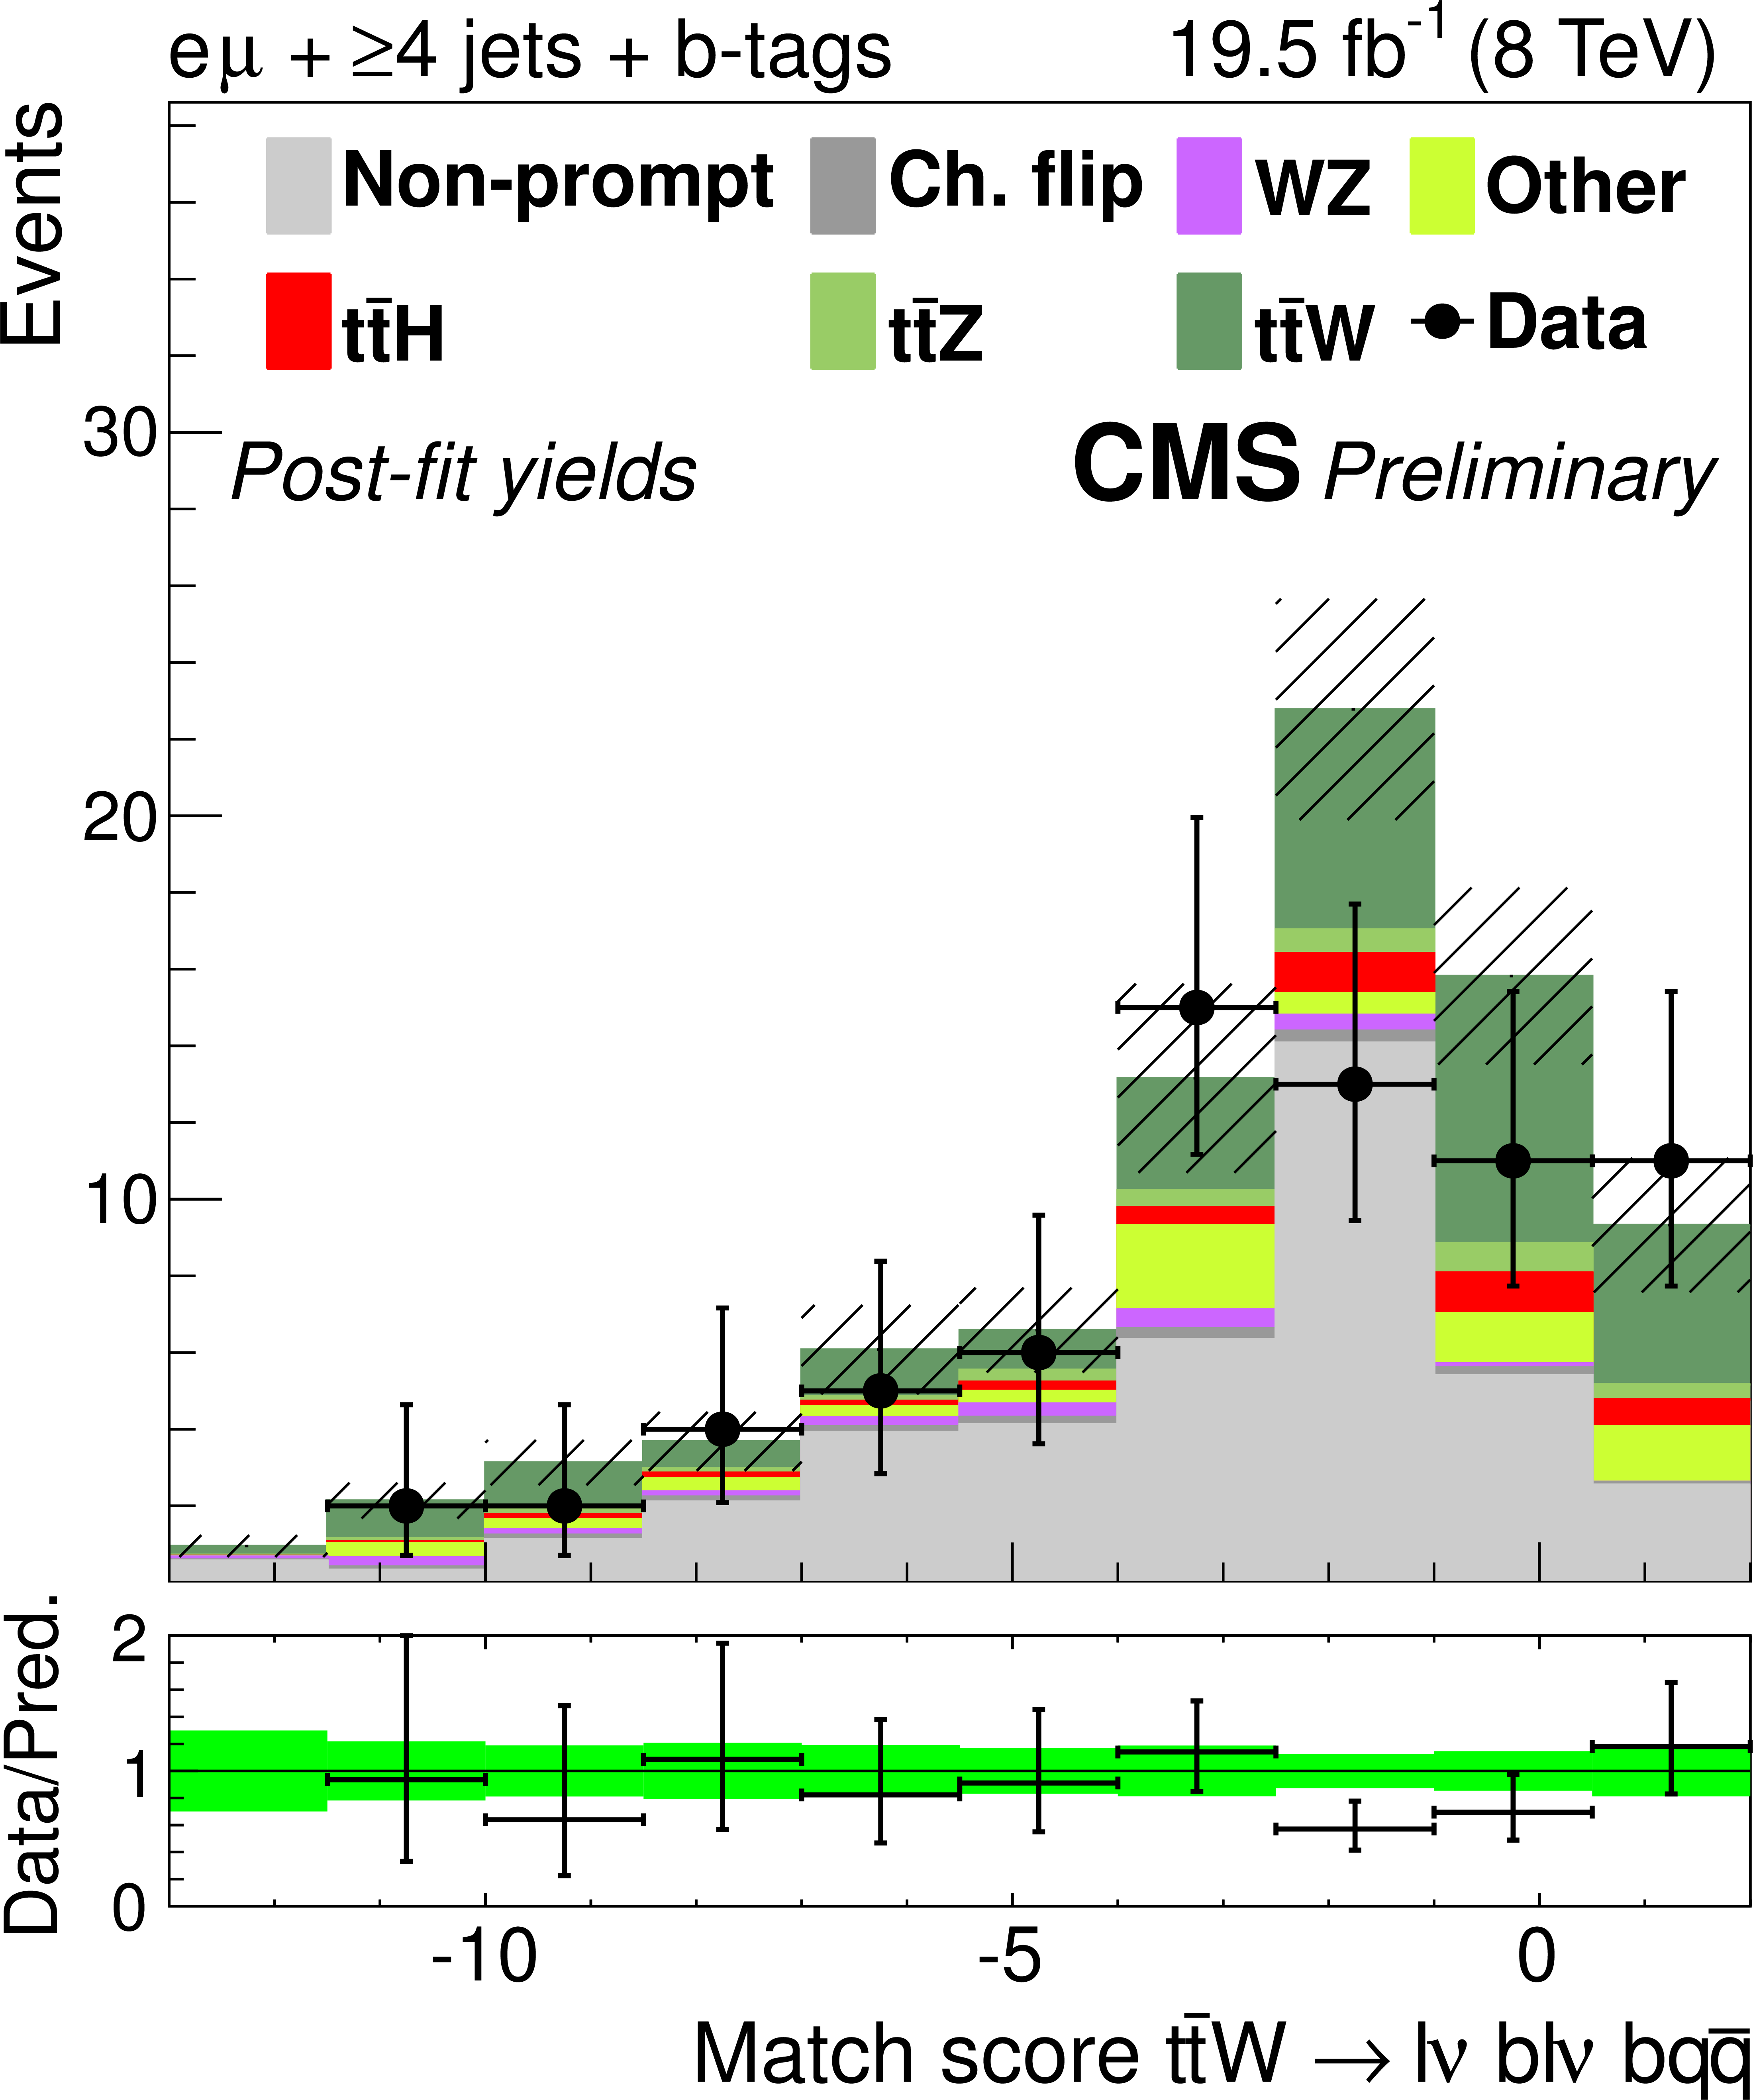
Figure 2-b:
Distributions for match scores with signal and background yields from the final fit described in Section Results-SM. The left plot shows the match score for partially reconstructed hadronic $ {\mathrm {t}\overline {\mathrm {t}}} $ systems in same-flavor opposite-sign dilepton events with six or more jets. The center and right plots show scores for fully reconstructed semi-leptonic $ {\mathrm {t}\overline {\mathrm {t}}} $ systems in events with at least four jets, and a same-sign electron-muon pair, or three leptons, respectively. The 68% CL uncertainty in the signal plus background prediction is represented by hash marks in the stack histogram, and a green shaded region in the data-to-prediction ratio plot. The orange line shows the $ {\mathrm {t}\overline {\mathrm {t}}} {\mathrm {Z}} $ signal normalized to the expected yields. ``Other'' includes $ {\mathrm {t}\overline {\mathrm {t}}} \gamma $, $ {\mathrm {t}\overline {\mathrm {t}}} \gamma ^{*}$, $ {\mathrm {t}\overline {\mathrm {t}}} {\mathrm {W}} {\mathrm {W}}$, tb$ {\mathrm {Z}}$, WWW, WWZ, and W$^{\pm }$W$^{\pm }$. |
png ; pdf |
Figure 2-c:
Distributions for match scores with signal and background yields from the final fit described in Section Results-SM. The left plot shows the match score for partially reconstructed hadronic $ {\mathrm {t}\overline {\mathrm {t}}} $ systems in same-flavor opposite-sign dilepton events with six or more jets. The center and right plots show scores for fully reconstructed semi-leptonic $ {\mathrm {t}\overline {\mathrm {t}}} $ systems in events with at least four jets, and a same-sign electron-muon pair, or three leptons, respectively. The 68% CL uncertainty in the signal plus background prediction is represented by hash marks in the stack histogram, and a green shaded region in the data-to-prediction ratio plot. The orange line shows the $ {\mathrm {t}\overline {\mathrm {t}}} {\mathrm {Z}} $ signal normalized to the expected yields. ``Other'' includes $ {\mathrm {t}\overline {\mathrm {t}}} \gamma $, $ {\mathrm {t}\overline {\mathrm {t}}} \gamma ^{*}$, $ {\mathrm {t}\overline {\mathrm {t}}} {\mathrm {W}} {\mathrm {W}}$, tb$ {\mathrm {Z}}$, WWW, WWZ, and W$^{\pm }$W$^{\pm }$. |
png ; pdf |
Figure 3-a:
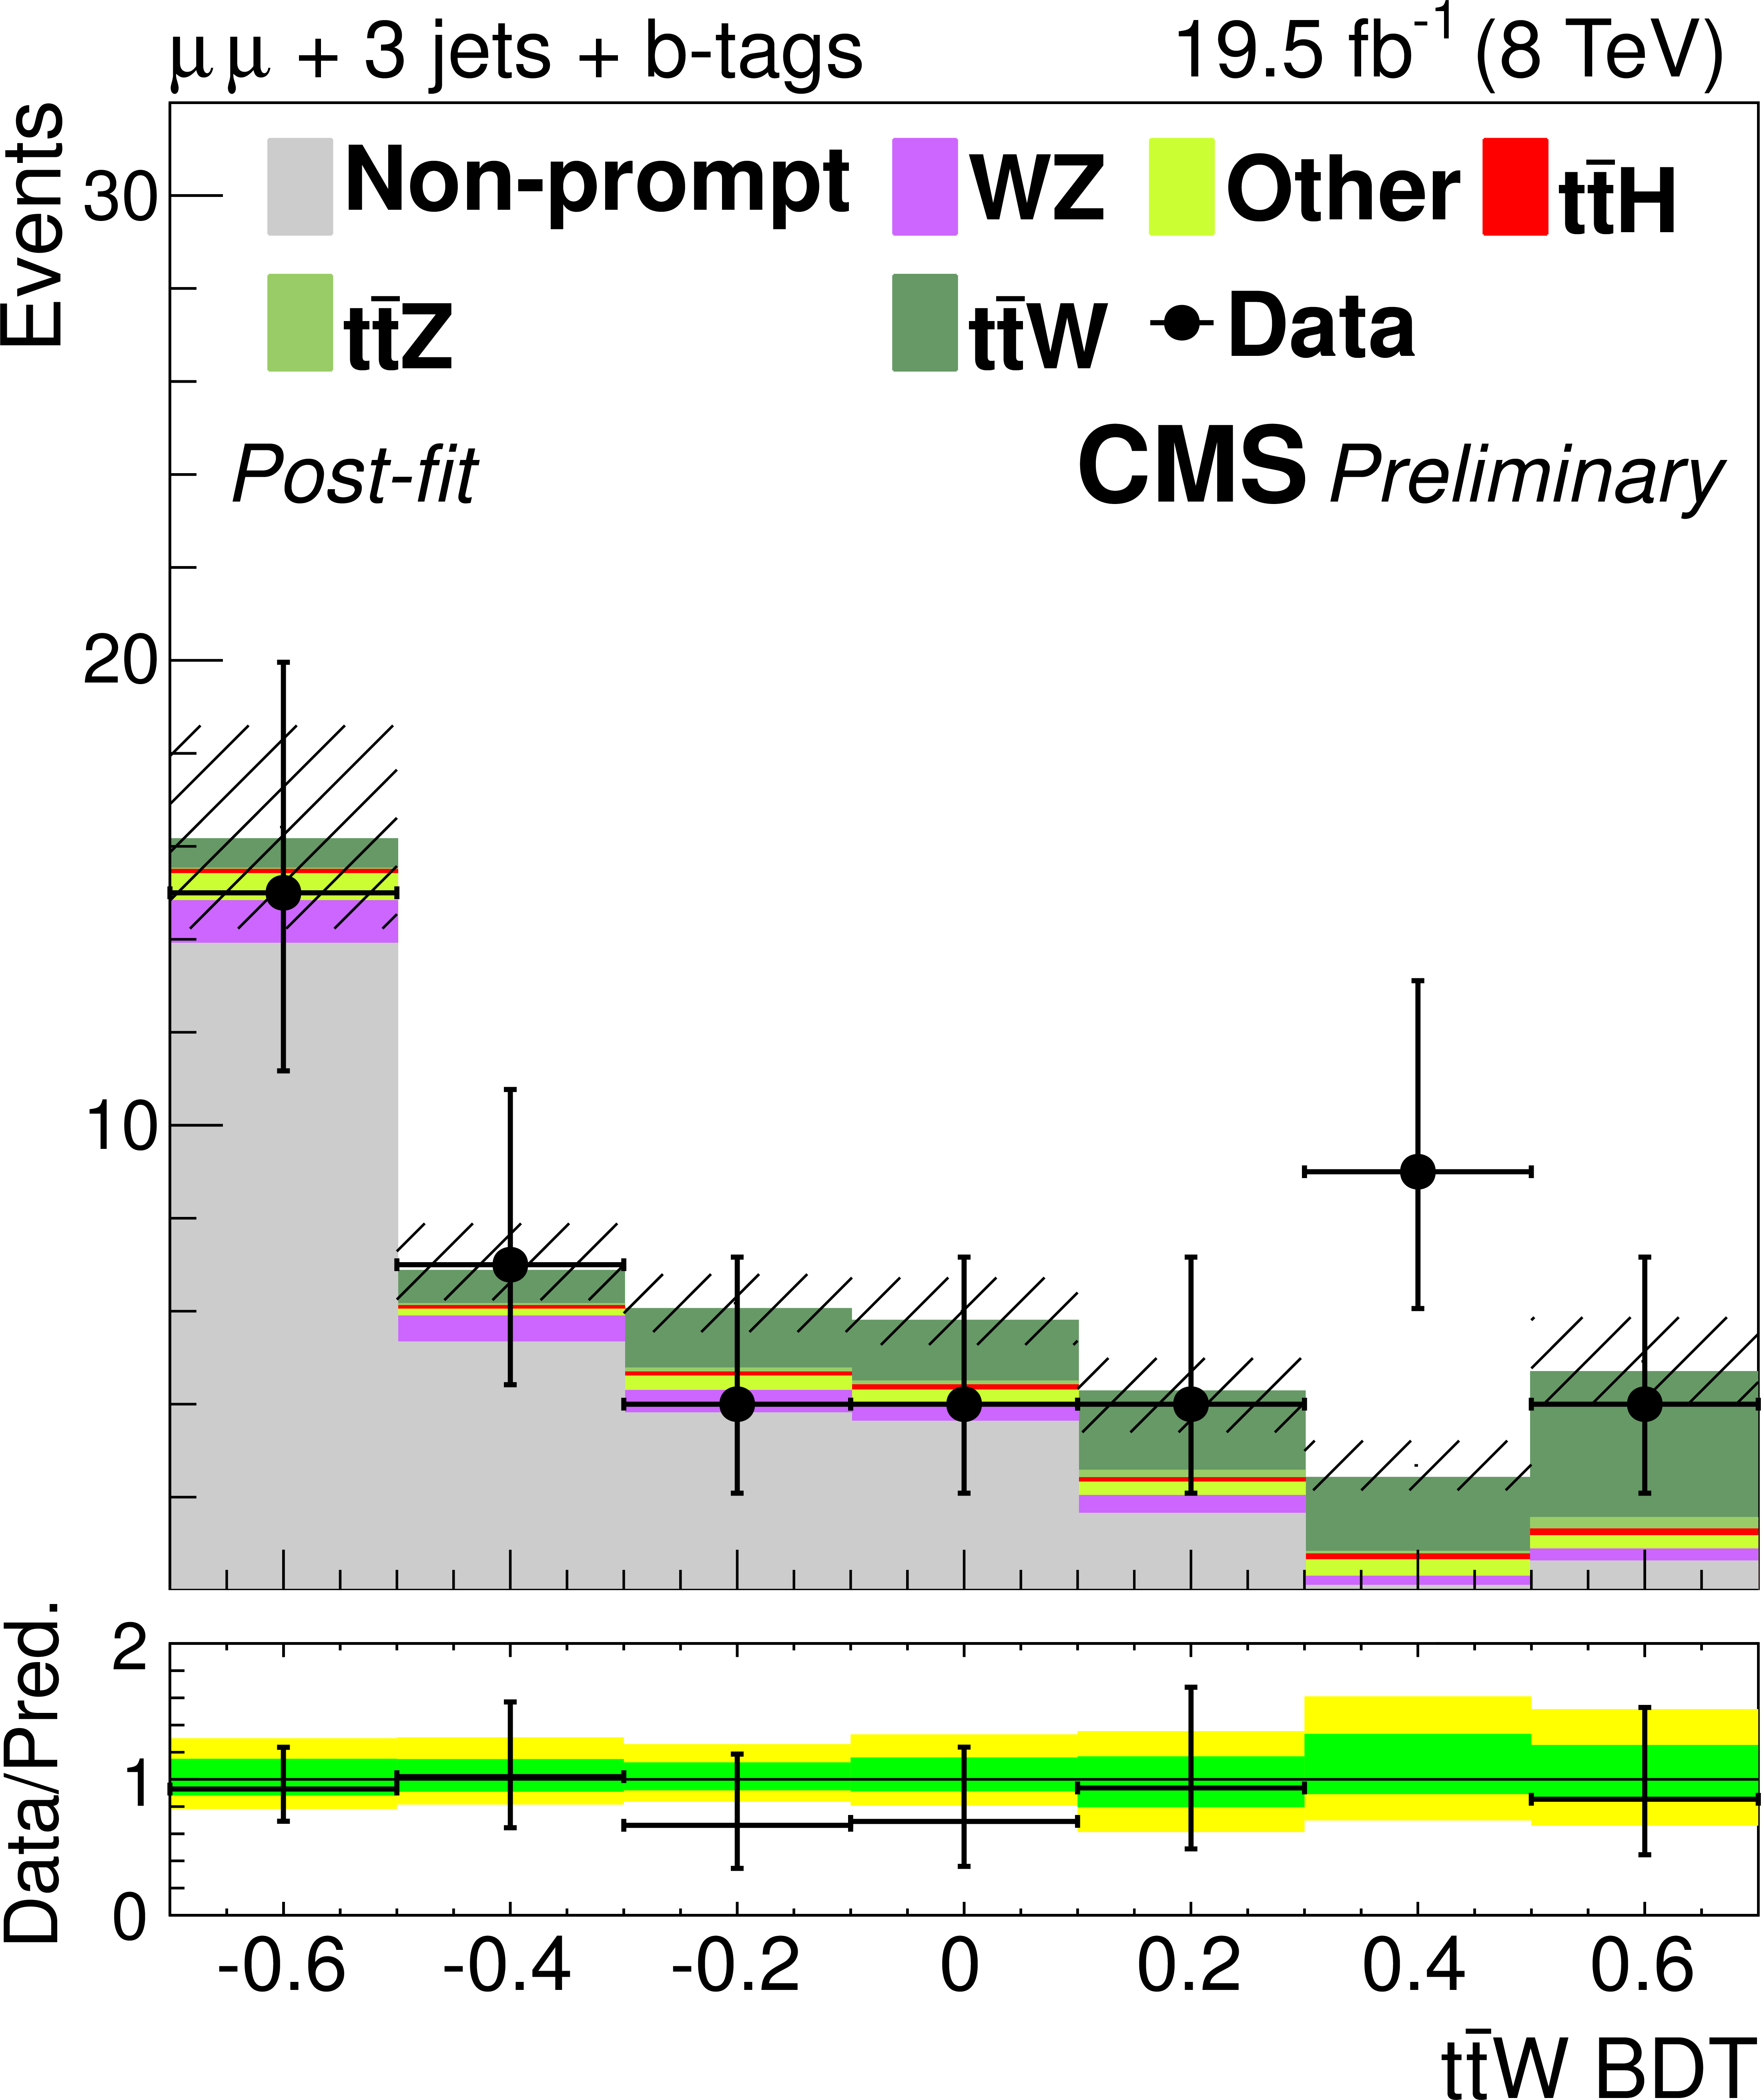
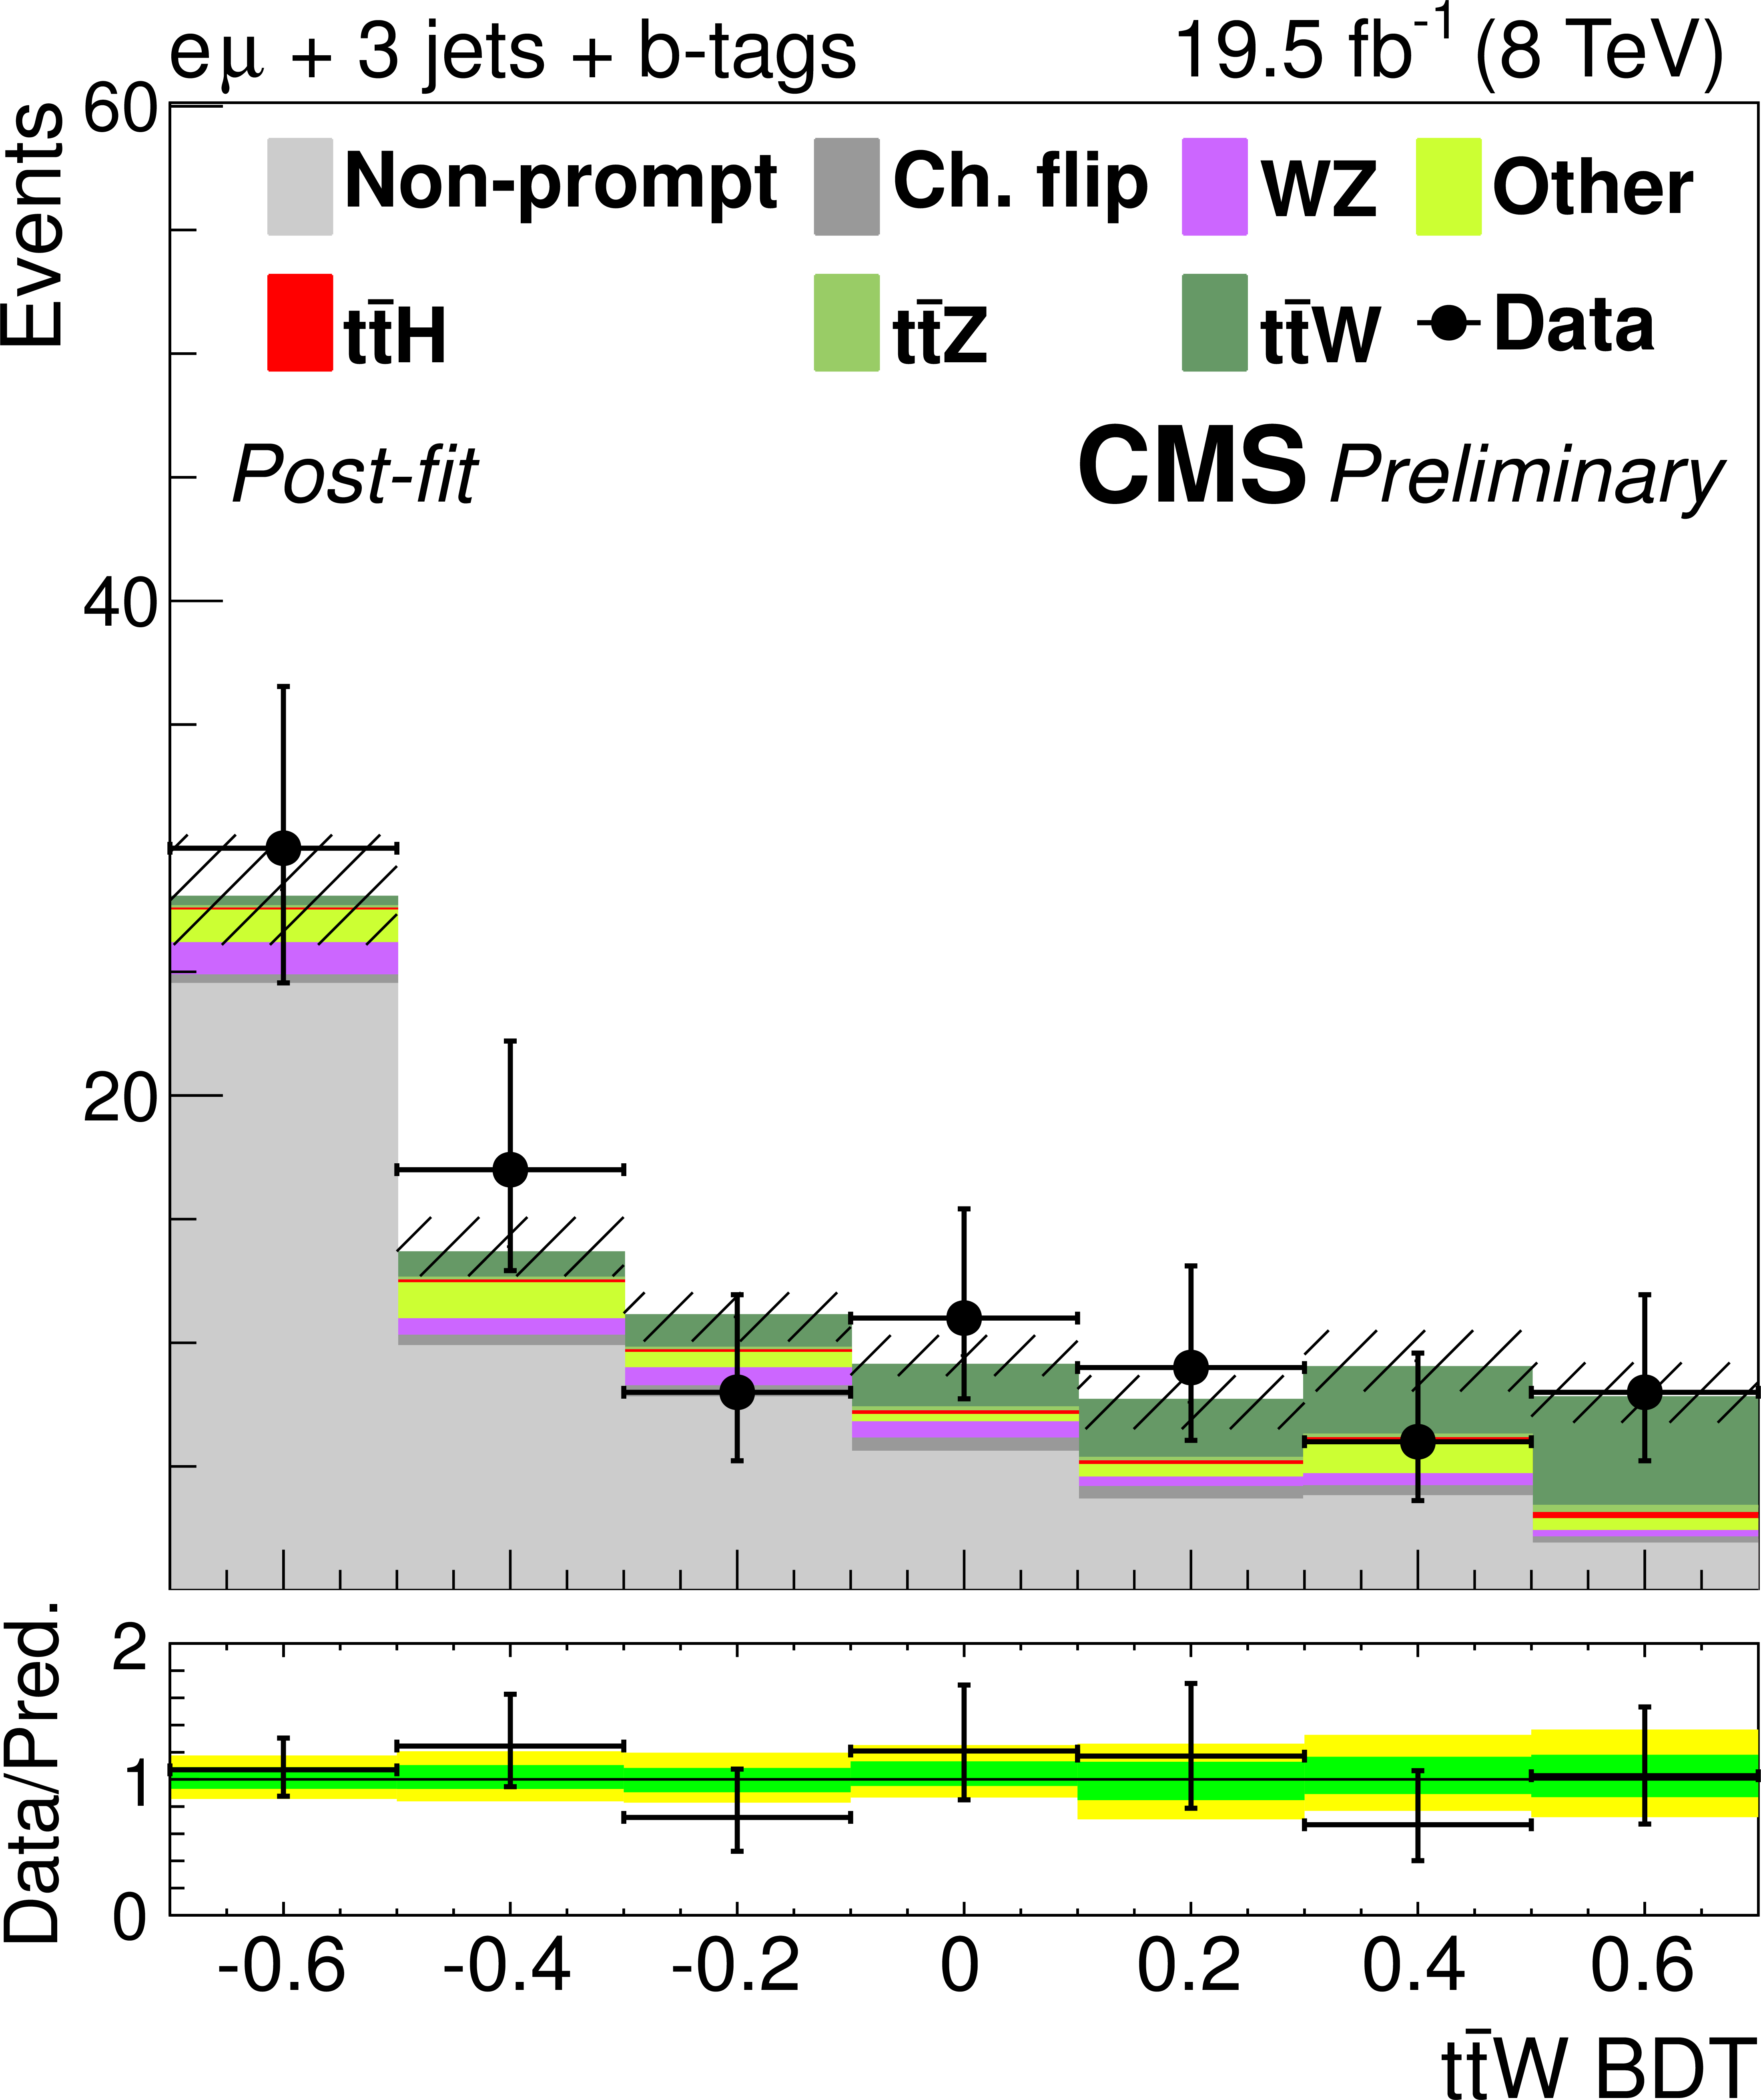
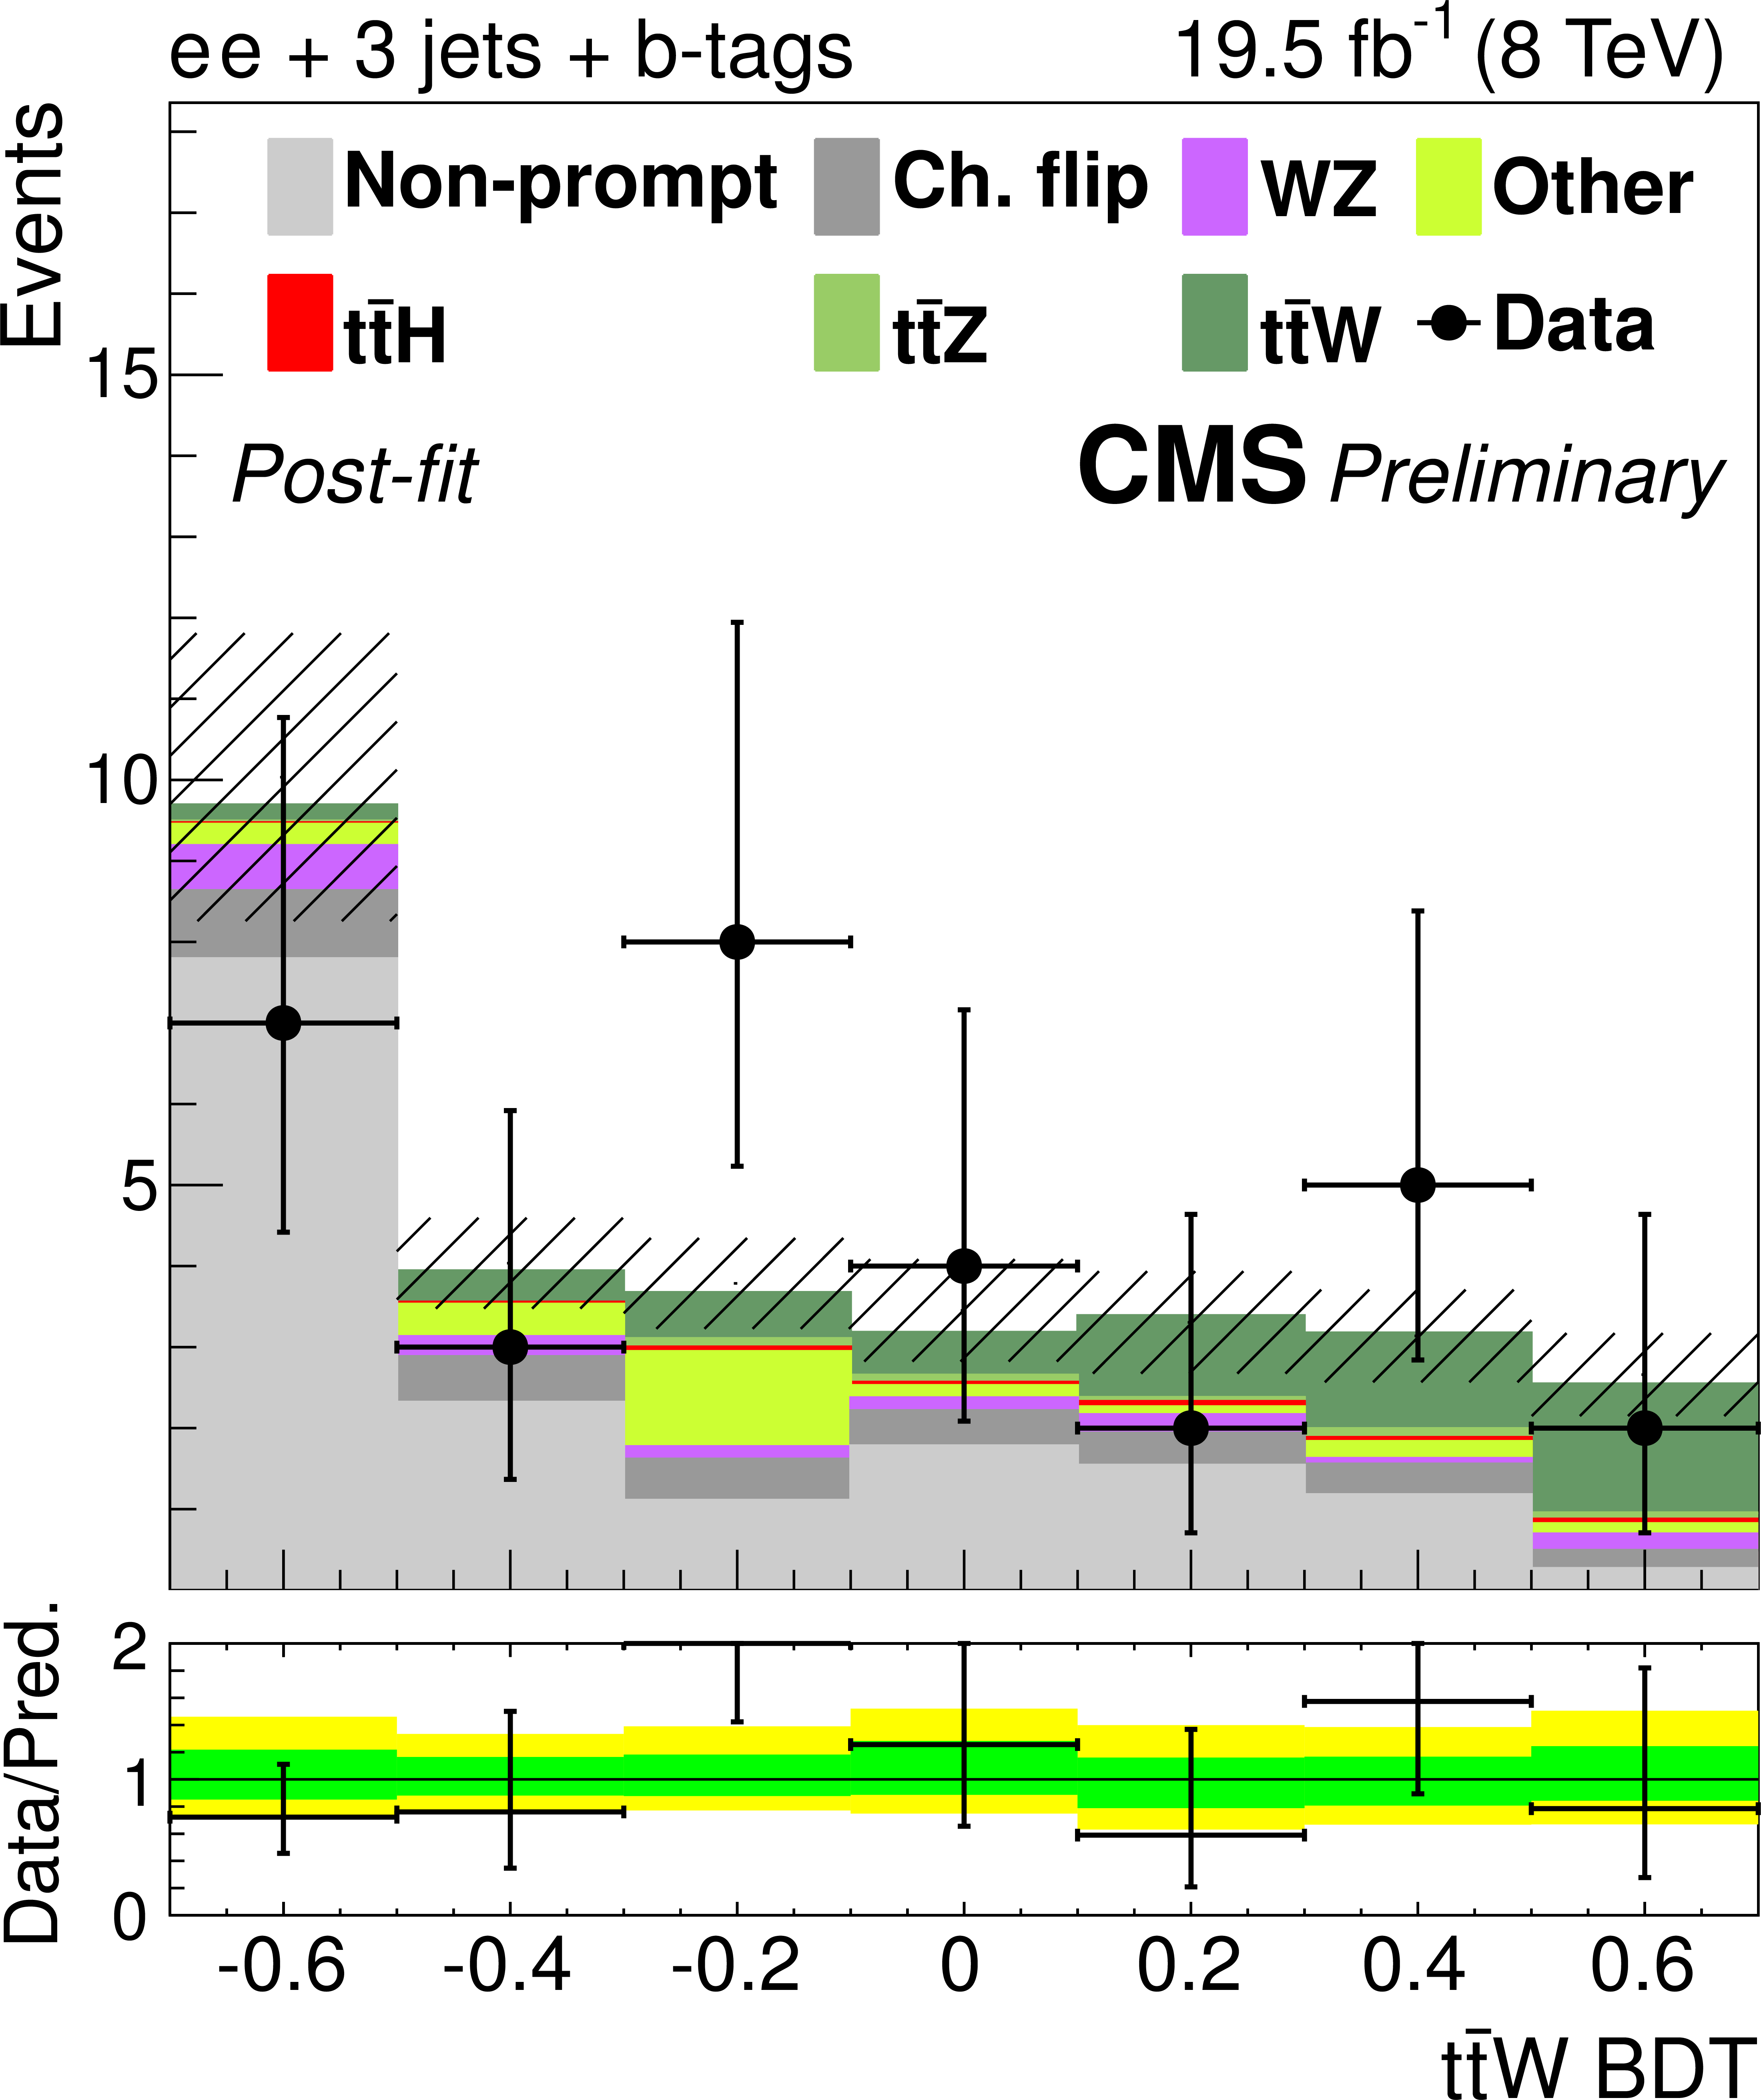
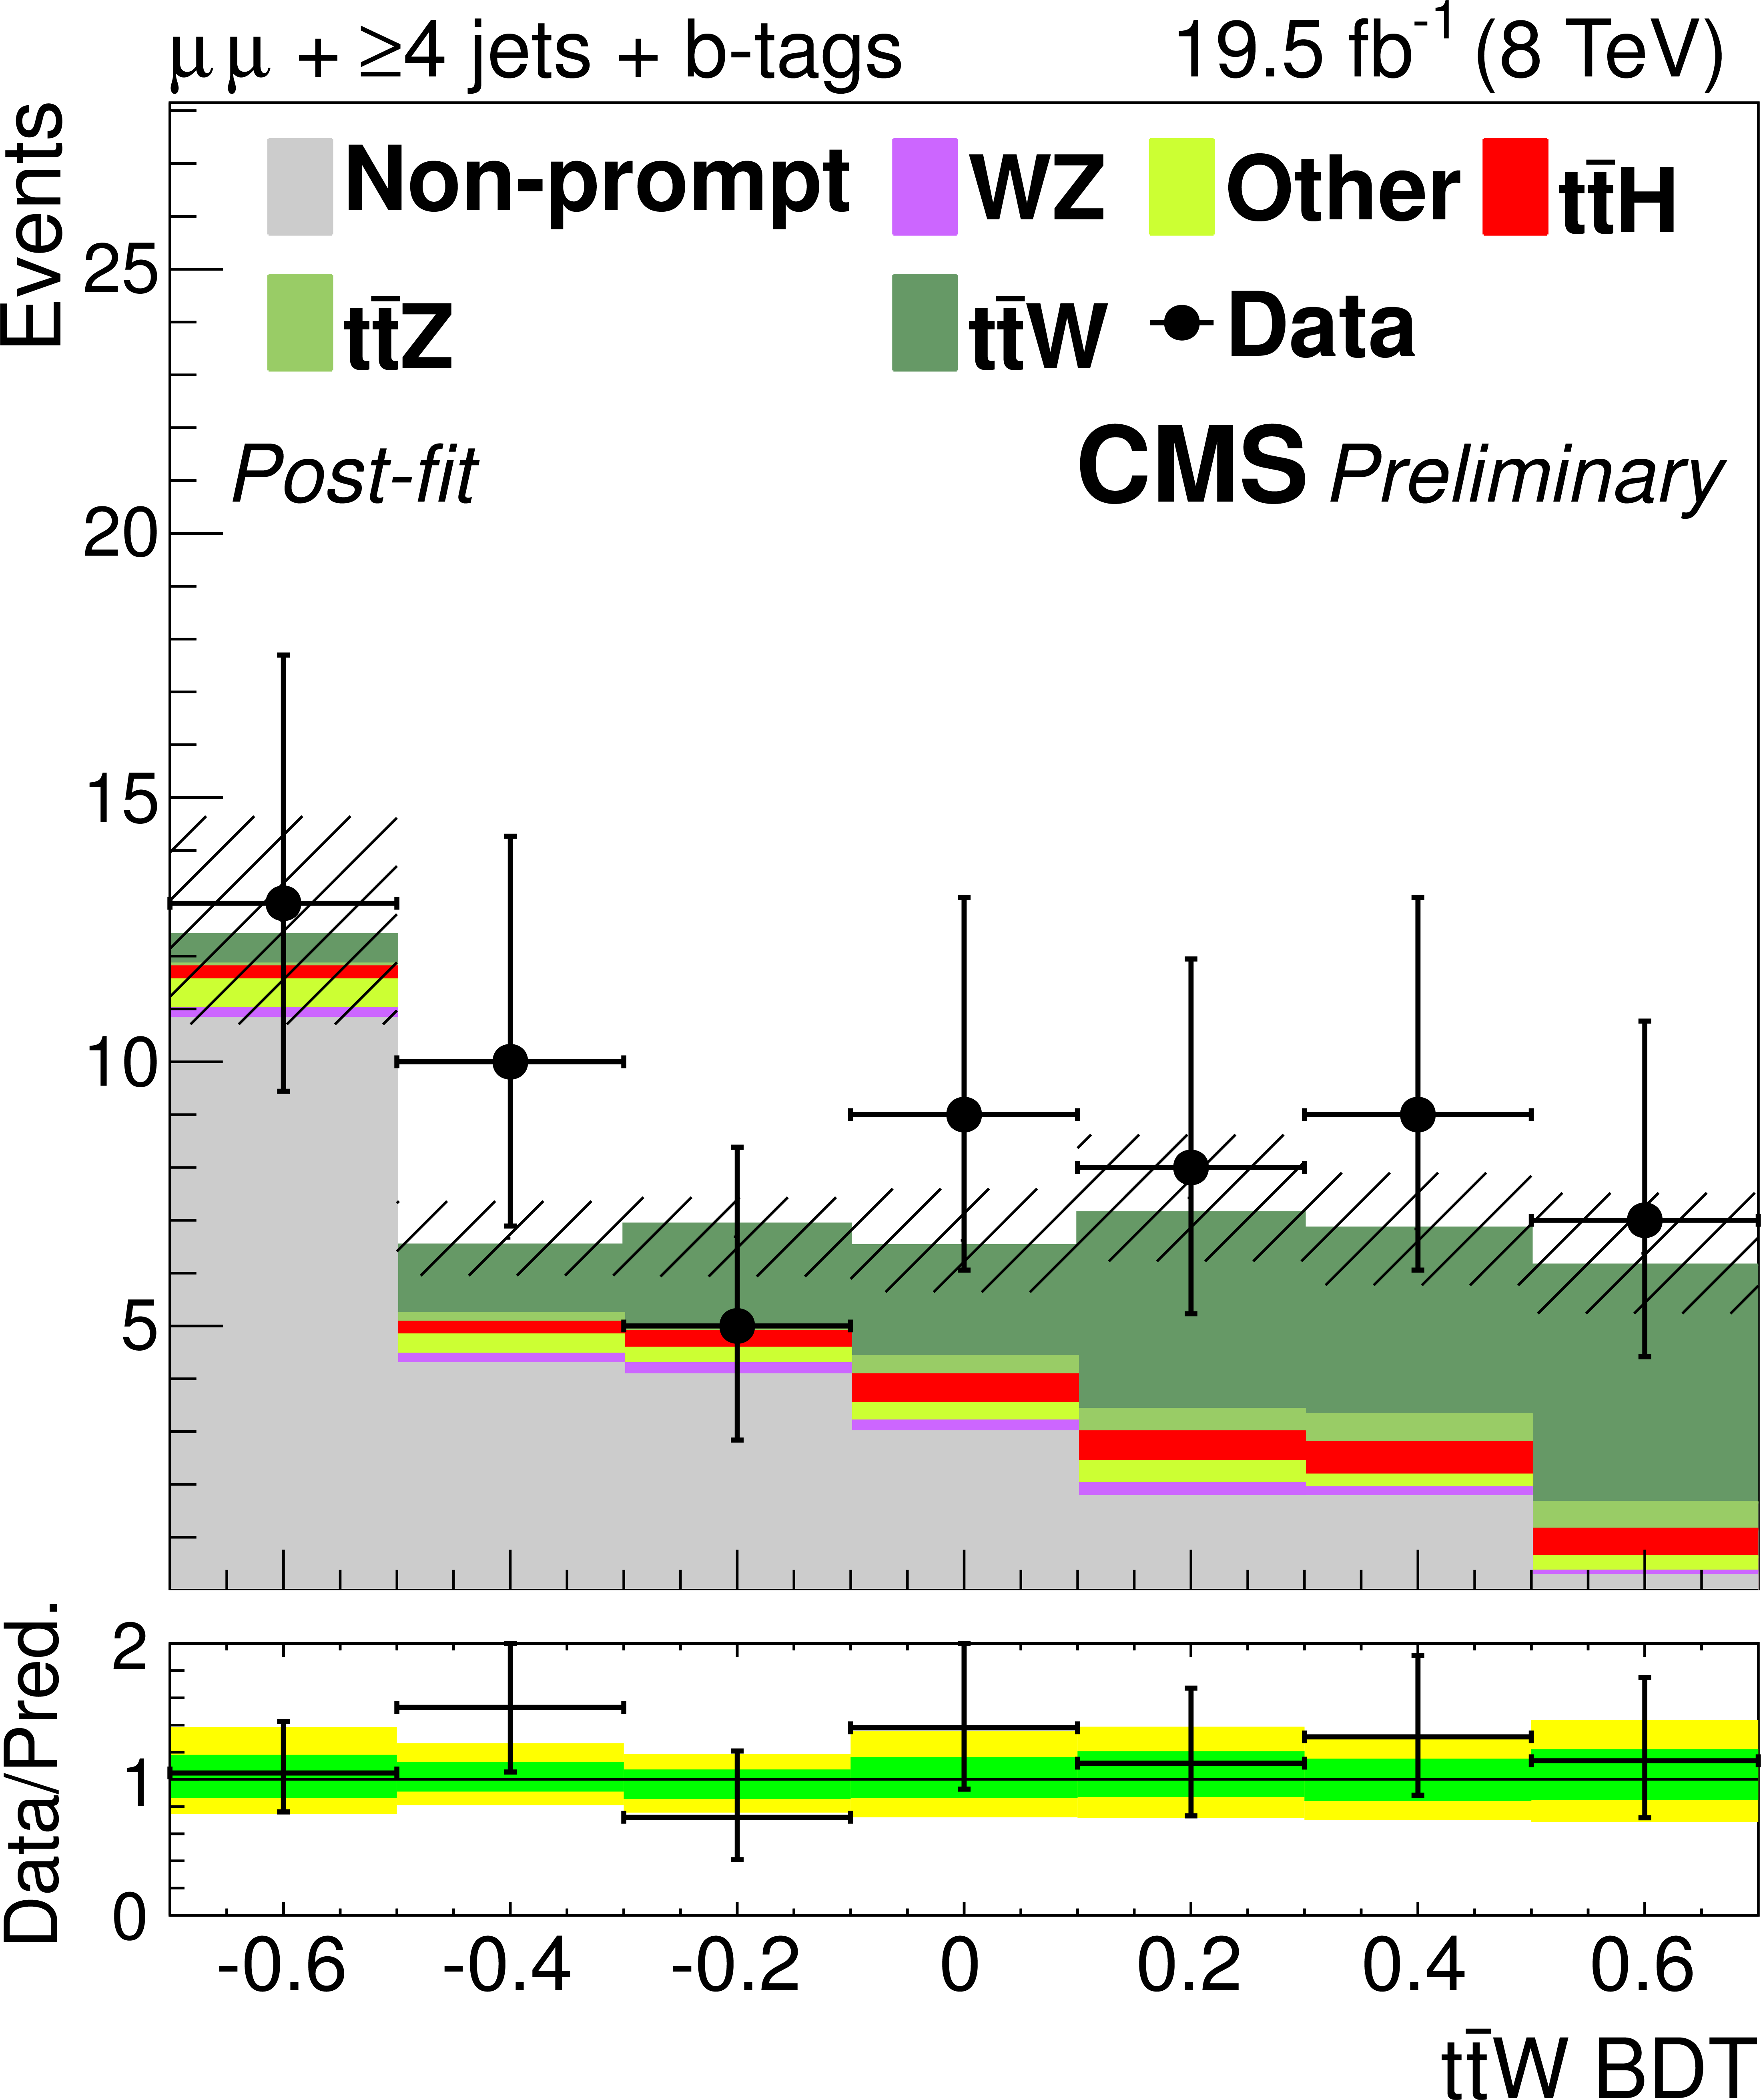
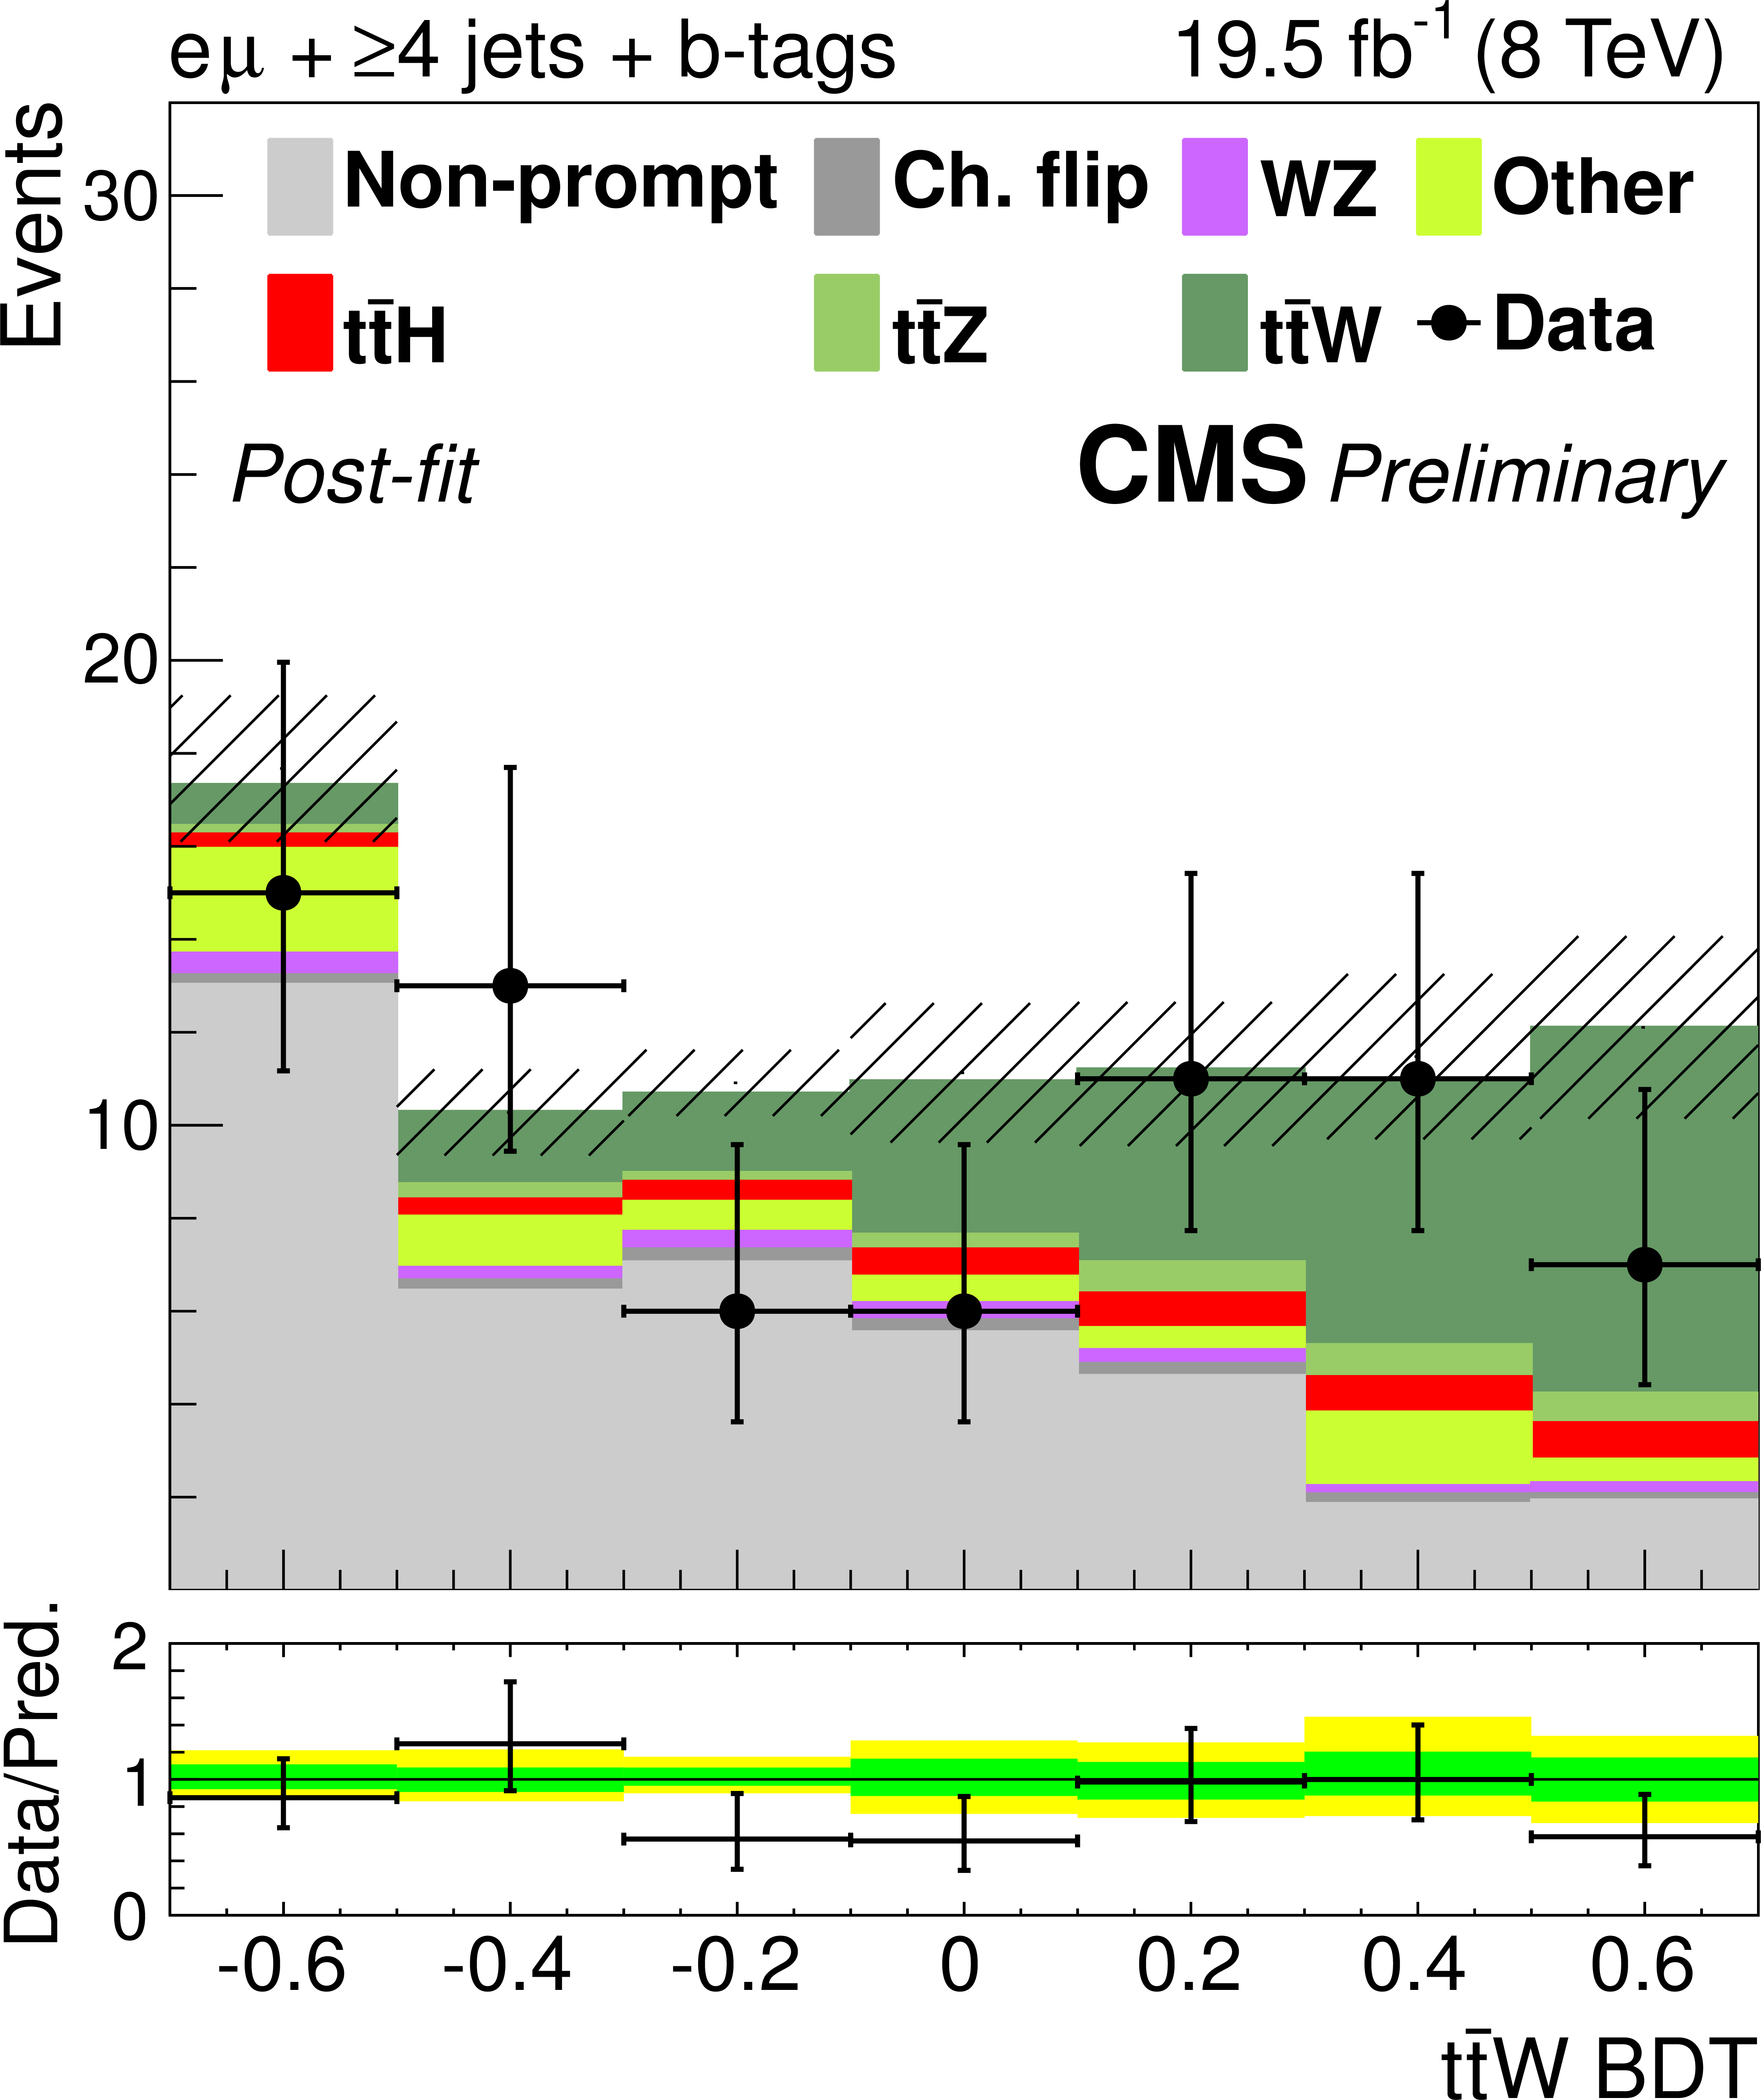
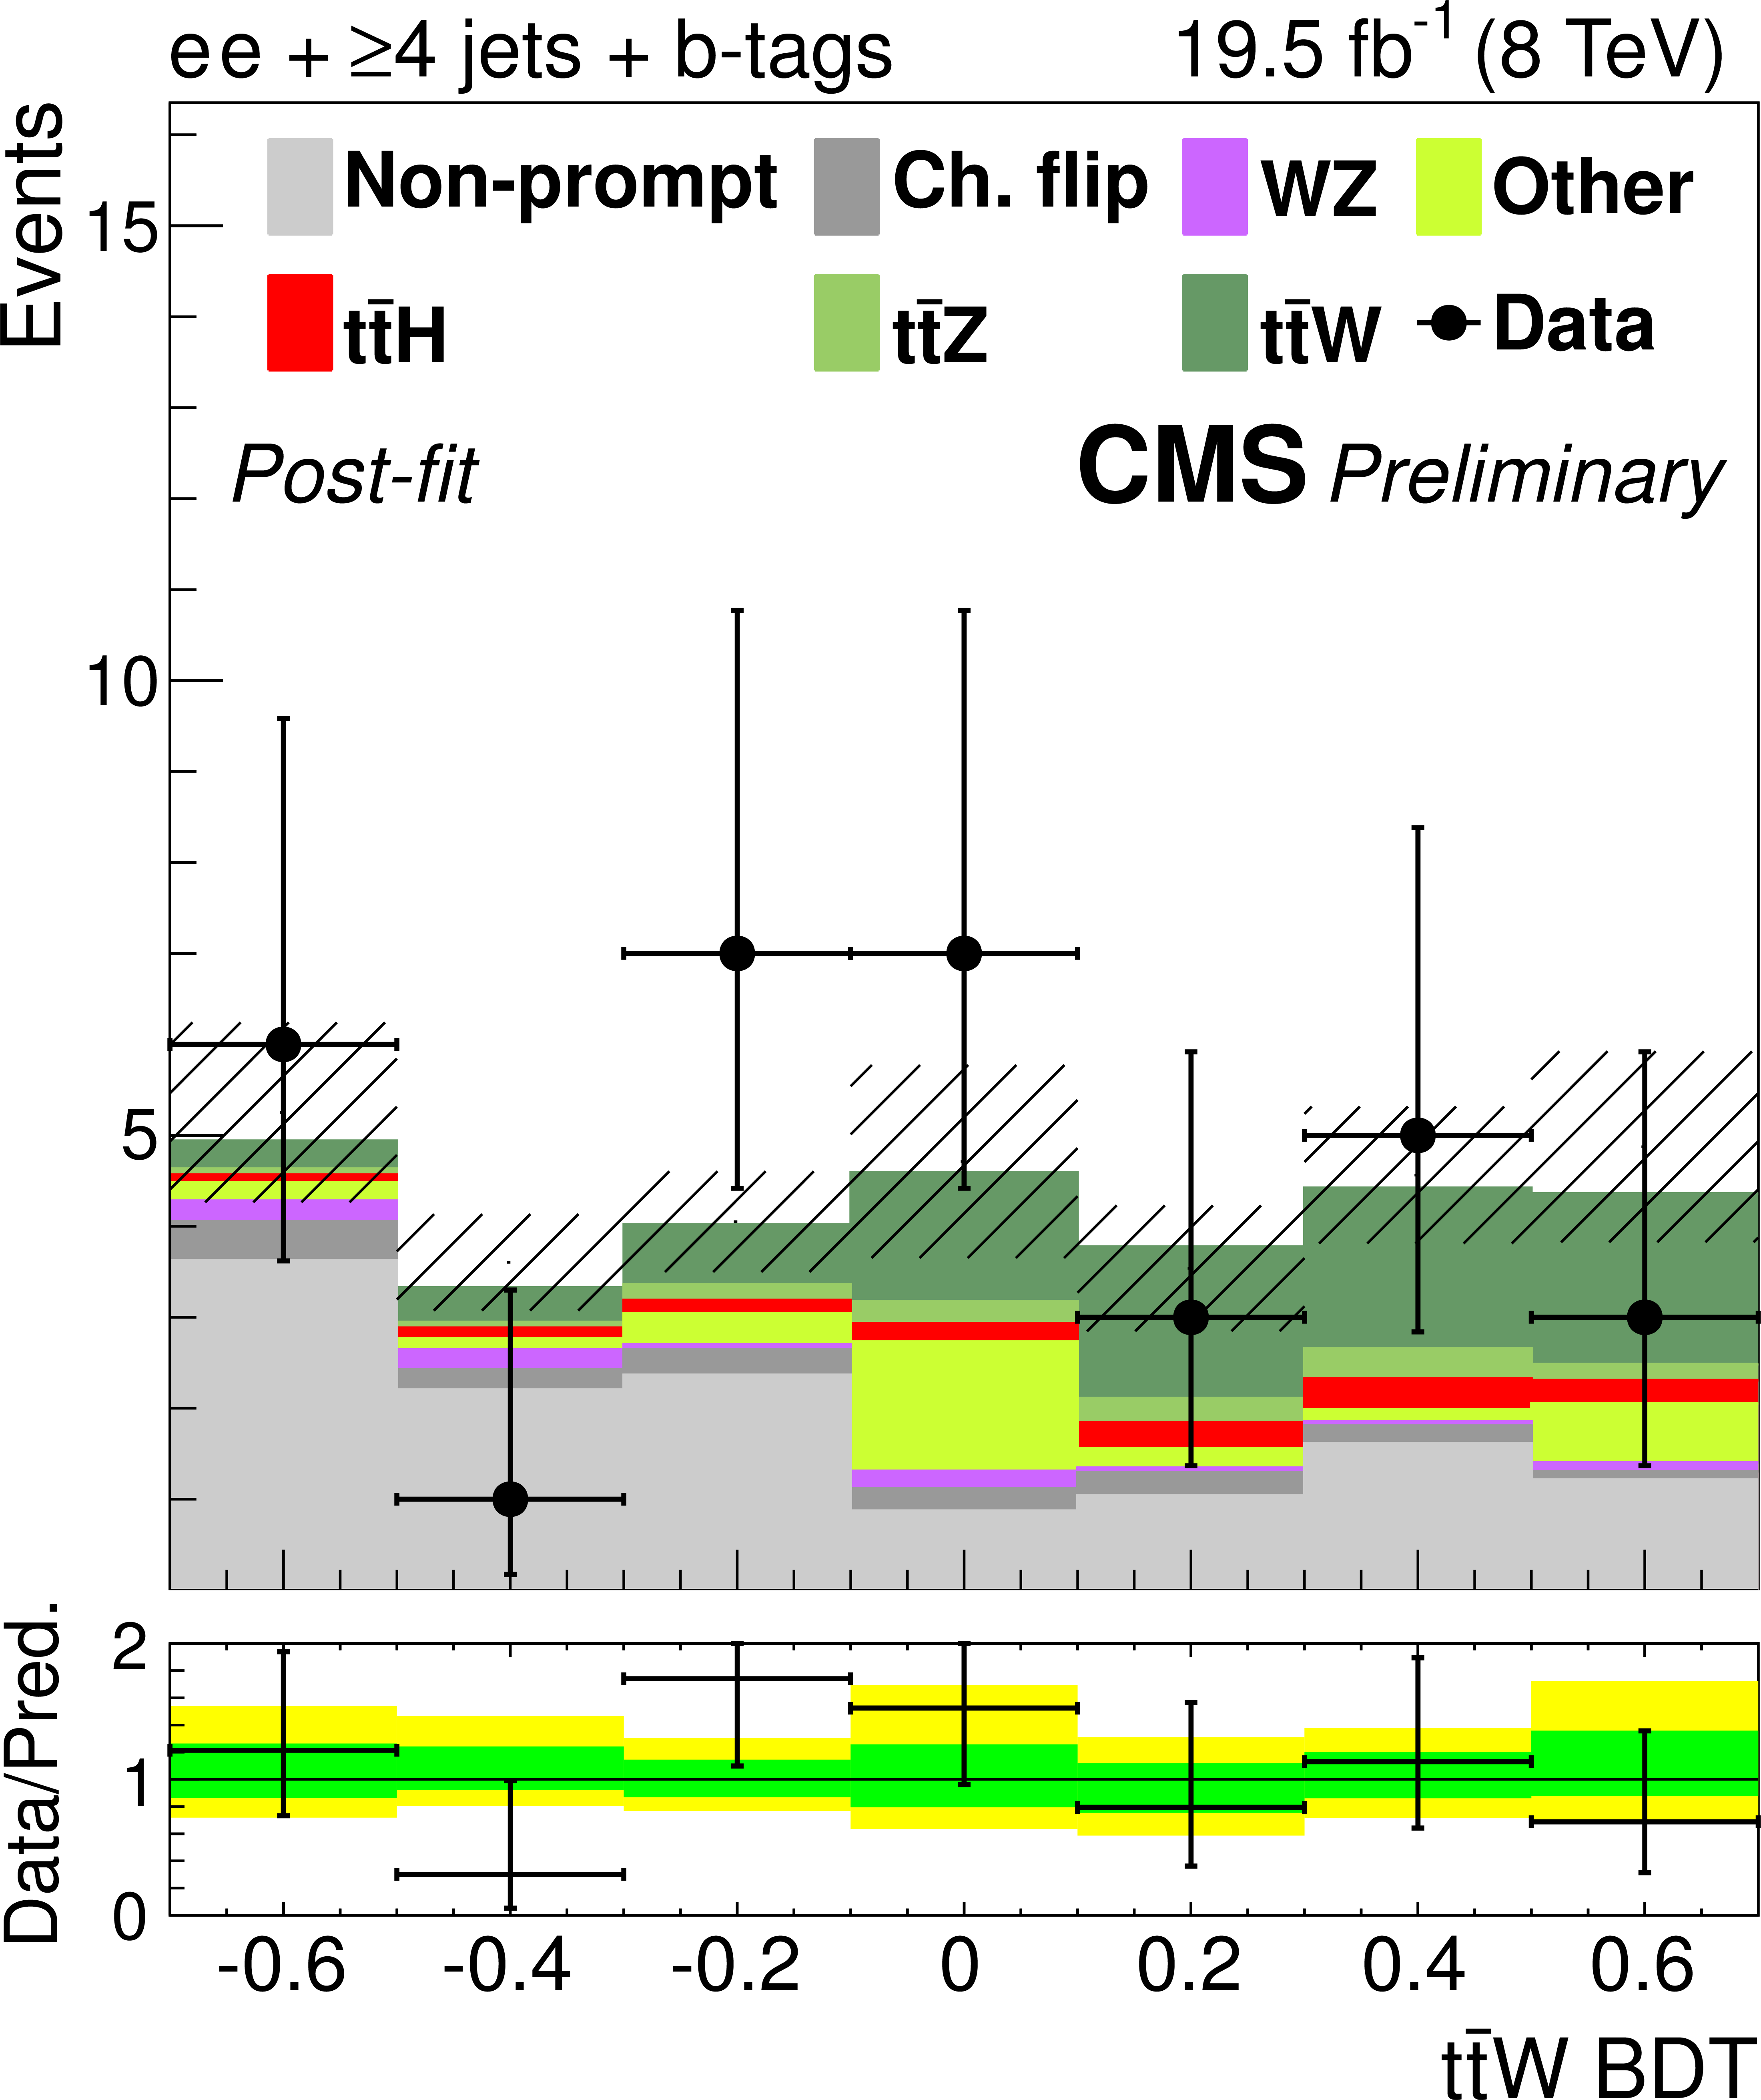
The final discriminant for same-sign $ {\mathrm {t}\overline {\mathrm {t}}} {\mathrm {W}}$ channel events with 3 jets (top) and $\geq $4 jets (bottom), after the final fit described in Section Results-SM. From left to right the lepton flavors are $ {\mu } {\mu } $, $ {\mathrm {e}} {\mu } $, and $ {\mathrm {e}} {\mathrm {e}}$. The 68% CL uncertainty in the fitted signal plus background is represented by hash marks in the stack histogram, and a green shaded region in the data-to-prediction ratio plot. The 95% CL band from the fit is shown in yellow. The orange line denotes the $ {\mathrm {t}\overline {\mathrm {t}}} {\mathrm {Z}} $ signal normalized to the expected yields. ``Other'' includes $ {\mathrm {t}\overline {\mathrm {t}}} \gamma $, $ {\mathrm {t}\overline {\mathrm {t}}} \gamma ^{*}$, $ {\mathrm {t}\overline {\mathrm {t}}} {\mathrm {W}} {\mathrm {W}}$, tb$ {\mathrm {Z}}$, WWW, WWZ, and W$^{\pm }$W$^{\pm }$. |
png ; pdf |
Figure 3-b:
The final discriminant for same-sign $ {\mathrm {t}\overline {\mathrm {t}}} {\mathrm {W}}$ channel events with 3 jets (top) and $\geq $4 jets (bottom), after the final fit described in Section Results-SM. From left to right the lepton flavors are $ {\mu } {\mu } $, $ {\mathrm {e}} {\mu } $, and $ {\mathrm {e}} {\mathrm {e}}$. The 68% CL uncertainty in the fitted signal plus background is represented by hash marks in the stack histogram, and a green shaded region in the data-to-prediction ratio plot. The 95% CL band from the fit is shown in yellow. The orange line denotes the $ {\mathrm {t}\overline {\mathrm {t}}} {\mathrm {Z}} $ signal normalized to the expected yields. ``Other'' includes $ {\mathrm {t}\overline {\mathrm {t}}} \gamma $, $ {\mathrm {t}\overline {\mathrm {t}}} \gamma ^{*}$, $ {\mathrm {t}\overline {\mathrm {t}}} {\mathrm {W}} {\mathrm {W}}$, tb$ {\mathrm {Z}}$, WWW, WWZ, and W$^{\pm }$W$^{\pm }$. |
png ; pdf |
Figure 3-c:
The final discriminant for same-sign $ {\mathrm {t}\overline {\mathrm {t}}} {\mathrm {W}}$ channel events with 3 jets (top) and $\geq $4 jets (bottom), after the final fit described in Section Results-SM. From left to right the lepton flavors are $ {\mu } {\mu } $, $ {\mathrm {e}} {\mu } $, and $ {\mathrm {e}} {\mathrm {e}}$. The 68% CL uncertainty in the fitted signal plus background is represented by hash marks in the stack histogram, and a green shaded region in the data-to-prediction ratio plot. The 95% CL band from the fit is shown in yellow. The orange line denotes the $ {\mathrm {t}\overline {\mathrm {t}}} {\mathrm {Z}} $ signal normalized to the expected yields. ``Other'' includes $ {\mathrm {t}\overline {\mathrm {t}}} \gamma $, $ {\mathrm {t}\overline {\mathrm {t}}} \gamma ^{*}$, $ {\mathrm {t}\overline {\mathrm {t}}} {\mathrm {W}} {\mathrm {W}}$, tb$ {\mathrm {Z}}$, WWW, WWZ, and W$^{\pm }$W$^{\pm }$. |
png ; pdf |
Figure 3-d:
The final discriminant for same-sign $ {\mathrm {t}\overline {\mathrm {t}}} {\mathrm {W}}$ channel events with 3 jets (top) and $\geq $4 jets (bottom), after the final fit described in Section Results-SM. From left to right the lepton flavors are $ {\mu } {\mu } $, $ {\mathrm {e}} {\mu } $, and $ {\mathrm {e}} {\mathrm {e}}$. The 68% CL uncertainty in the fitted signal plus background is represented by hash marks in the stack histogram, and a green shaded region in the data-to-prediction ratio plot. The 95% CL band from the fit is shown in yellow. The orange line denotes the $ {\mathrm {t}\overline {\mathrm {t}}} {\mathrm {Z}} $ signal normalized to the expected yields. ``Other'' includes $ {\mathrm {t}\overline {\mathrm {t}}} \gamma $, $ {\mathrm {t}\overline {\mathrm {t}}} \gamma ^{*}$, $ {\mathrm {t}\overline {\mathrm {t}}} {\mathrm {W}} {\mathrm {W}}$, tb$ {\mathrm {Z}}$, WWW, WWZ, and W$^{\pm }$W$^{\pm }$. |
png ; pdf |
Figure 3-e:
The final discriminant for same-sign $ {\mathrm {t}\overline {\mathrm {t}}} {\mathrm {W}}$ channel events with 3 jets (top) and $\geq $4 jets (bottom), after the final fit described in Section Results-SM. From left to right the lepton flavors are $ {\mu } {\mu } $, $ {\mathrm {e}} {\mu } $, and $ {\mathrm {e}} {\mathrm {e}}$. The 68% CL uncertainty in the fitted signal plus background is represented by hash marks in the stack histogram, and a green shaded region in the data-to-prediction ratio plot. The 95% CL band from the fit is shown in yellow. The orange line denotes the $ {\mathrm {t}\overline {\mathrm {t}}} {\mathrm {Z}} $ signal normalized to the expected yields. ``Other'' includes $ {\mathrm {t}\overline {\mathrm {t}}} \gamma $, $ {\mathrm {t}\overline {\mathrm {t}}} \gamma ^{*}$, $ {\mathrm {t}\overline {\mathrm {t}}} {\mathrm {W}} {\mathrm {W}}$, tb$ {\mathrm {Z}}$, WWW, WWZ, and W$^{\pm }$W$^{\pm }$. |
png ; pdf |
Figure 3-f:
The final discriminant for same-sign $ {\mathrm {t}\overline {\mathrm {t}}} {\mathrm {W}}$ channel events with 3 jets (top) and $\geq $4 jets (bottom), after the final fit described in Section Results-SM. From left to right the lepton flavors are $ {\mu } {\mu } $, $ {\mathrm {e}} {\mu } $, and $ {\mathrm {e}} {\mathrm {e}}$. The 68% CL uncertainty in the fitted signal plus background is represented by hash marks in the stack histogram, and a green shaded region in the data-to-prediction ratio plot. The 95% CL band from the fit is shown in yellow. The orange line denotes the $ {\mathrm {t}\overline {\mathrm {t}}} {\mathrm {Z}} $ signal normalized to the expected yields. ``Other'' includes $ {\mathrm {t}\overline {\mathrm {t}}} \gamma $, $ {\mathrm {t}\overline {\mathrm {t}}} \gamma ^{*}$, $ {\mathrm {t}\overline {\mathrm {t}}} {\mathrm {W}} {\mathrm {W}}$, tb$ {\mathrm {Z}}$, WWW, WWZ, and W$^{\pm }$W$^{\pm }$. |
png ; pdf |
Figure 4-a:
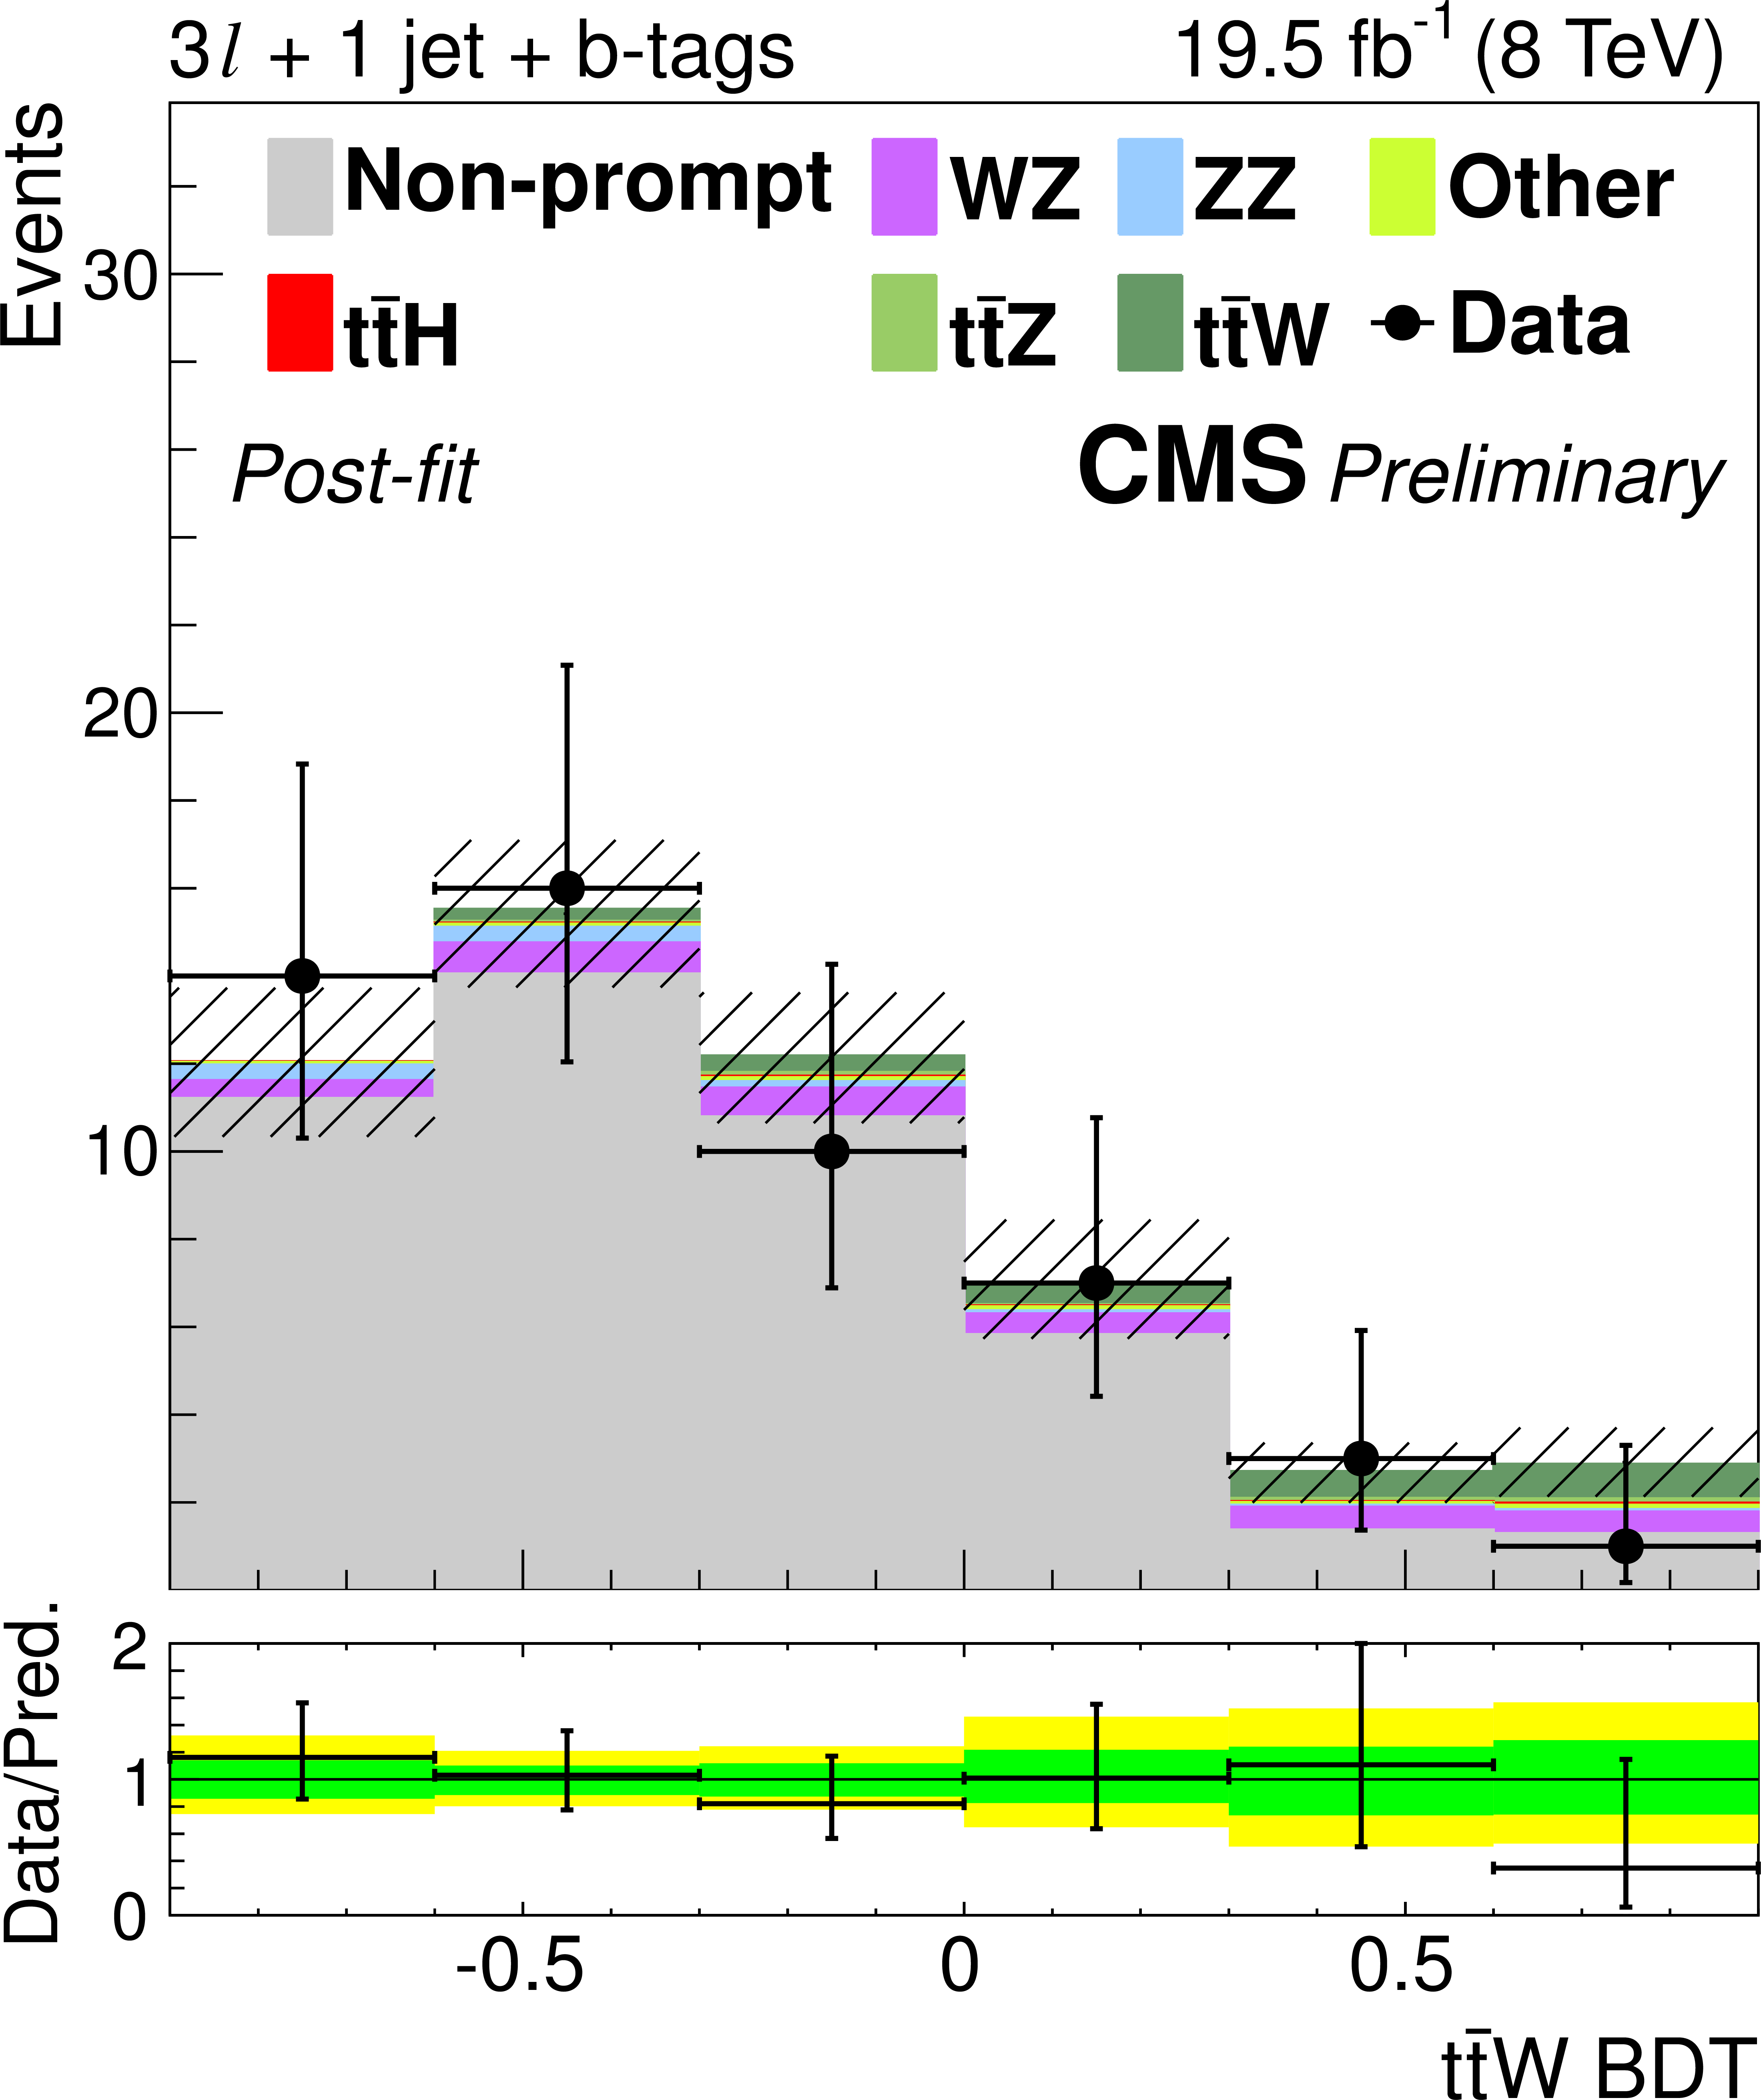
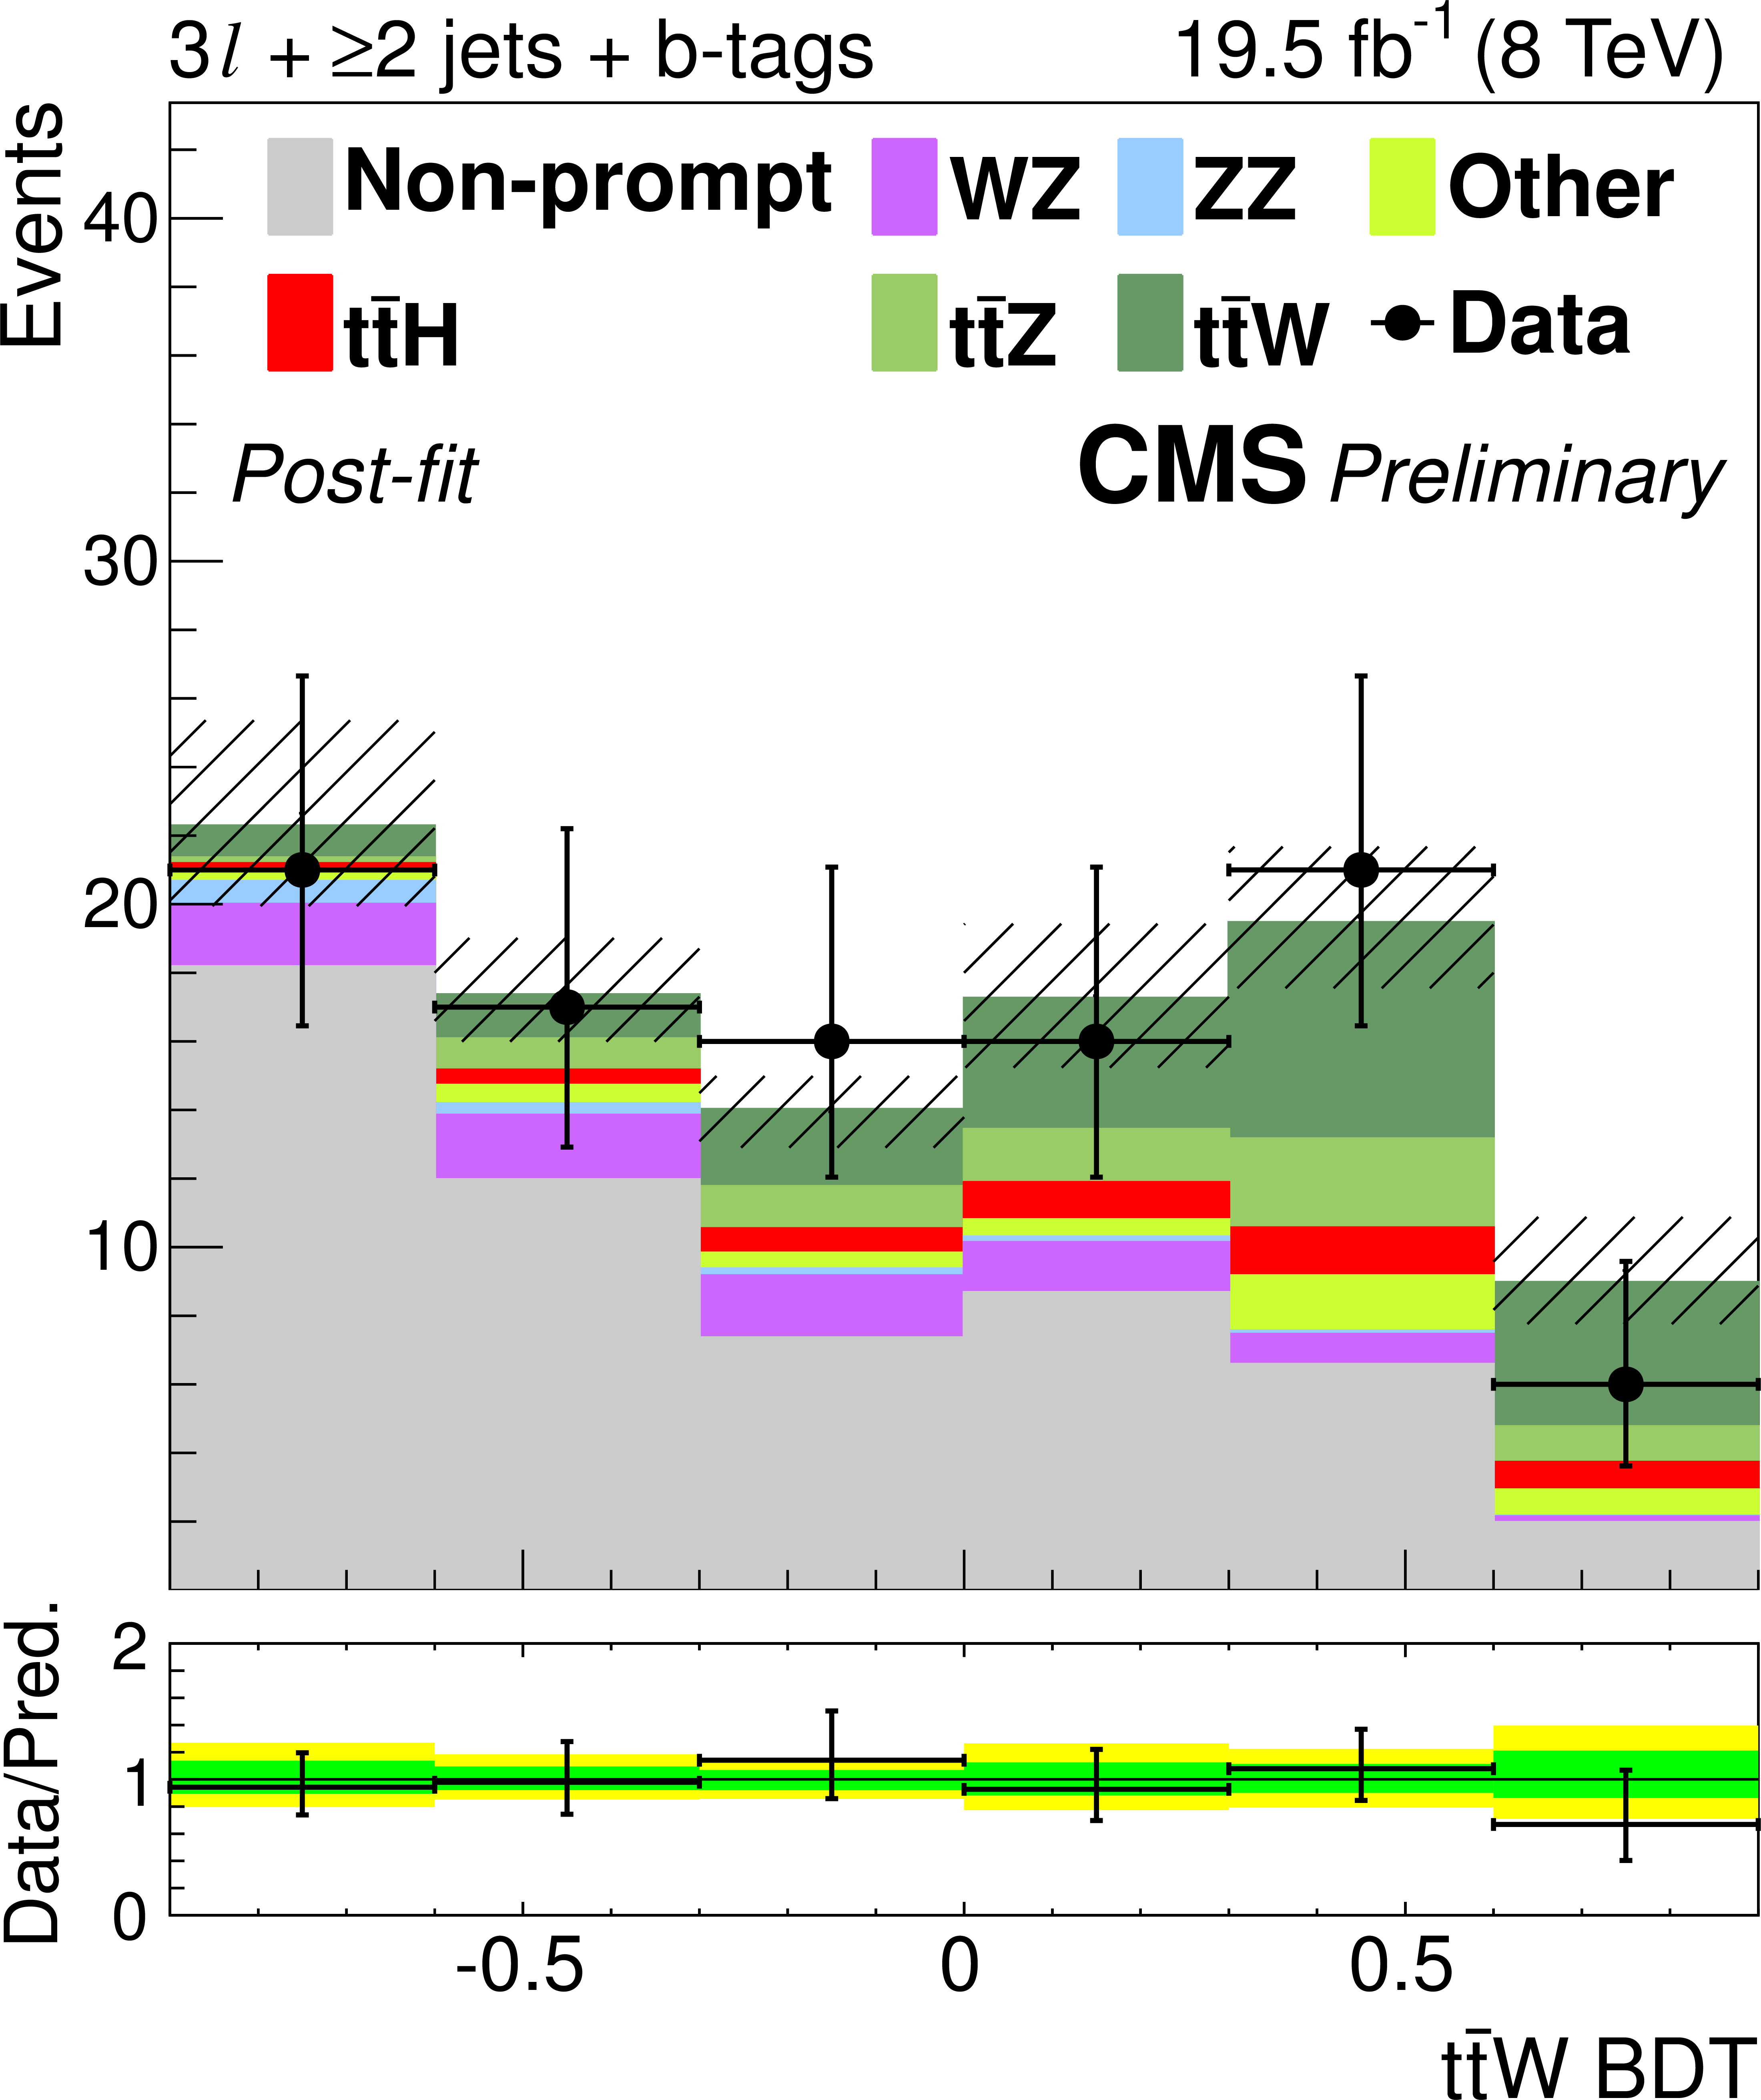
The final discriminant for 3$\ell $ $ {\mathrm {t}\overline {\mathrm {t}}} {\mathrm {W}}$ channel events with 1 jet (left) and $\geq $2 jets (right) after the final fit described in Section Results-SM. The 68% CL uncertainty in the fitted signal plus background is represented by hash marks in the stack histogram, and a green shaded region in the data-to-prediction ratio plot. The 95% CL band from the fit is shown in yellow. ``Other'' includes $ {\mathrm {t}\overline {\mathrm {t}}} \gamma $, $ {\mathrm {t}\overline {\mathrm {t}}} \gamma ^{*}$, $ {\mathrm {t}\overline {\mathrm {t}}} {\mathrm {W}} {\mathrm {W}}$, tb$ {\mathrm {Z}}$, WWW, and WWZ. |
png ; pdf |
Figure 4-b:
The final discriminant for 3$\ell $ $ {\mathrm {t}\overline {\mathrm {t}}} {\mathrm {W}}$ channel events with 1 jet (left) and $\geq $2 jets (right) after the final fit described in Section Results-SM. The 68% CL uncertainty in the fitted signal plus background is represented by hash marks in the stack histogram, and a green shaded region in the data-to-prediction ratio plot. The 95% CL band from the fit is shown in yellow. ``Other'' includes $ {\mathrm {t}\overline {\mathrm {t}}} \gamma $, $ {\mathrm {t}\overline {\mathrm {t}}} \gamma ^{*}$, $ {\mathrm {t}\overline {\mathrm {t}}} {\mathrm {W}} {\mathrm {W}}$, tb$ {\mathrm {Z}}$, WWW, and WWZ. |
png ; pdf |
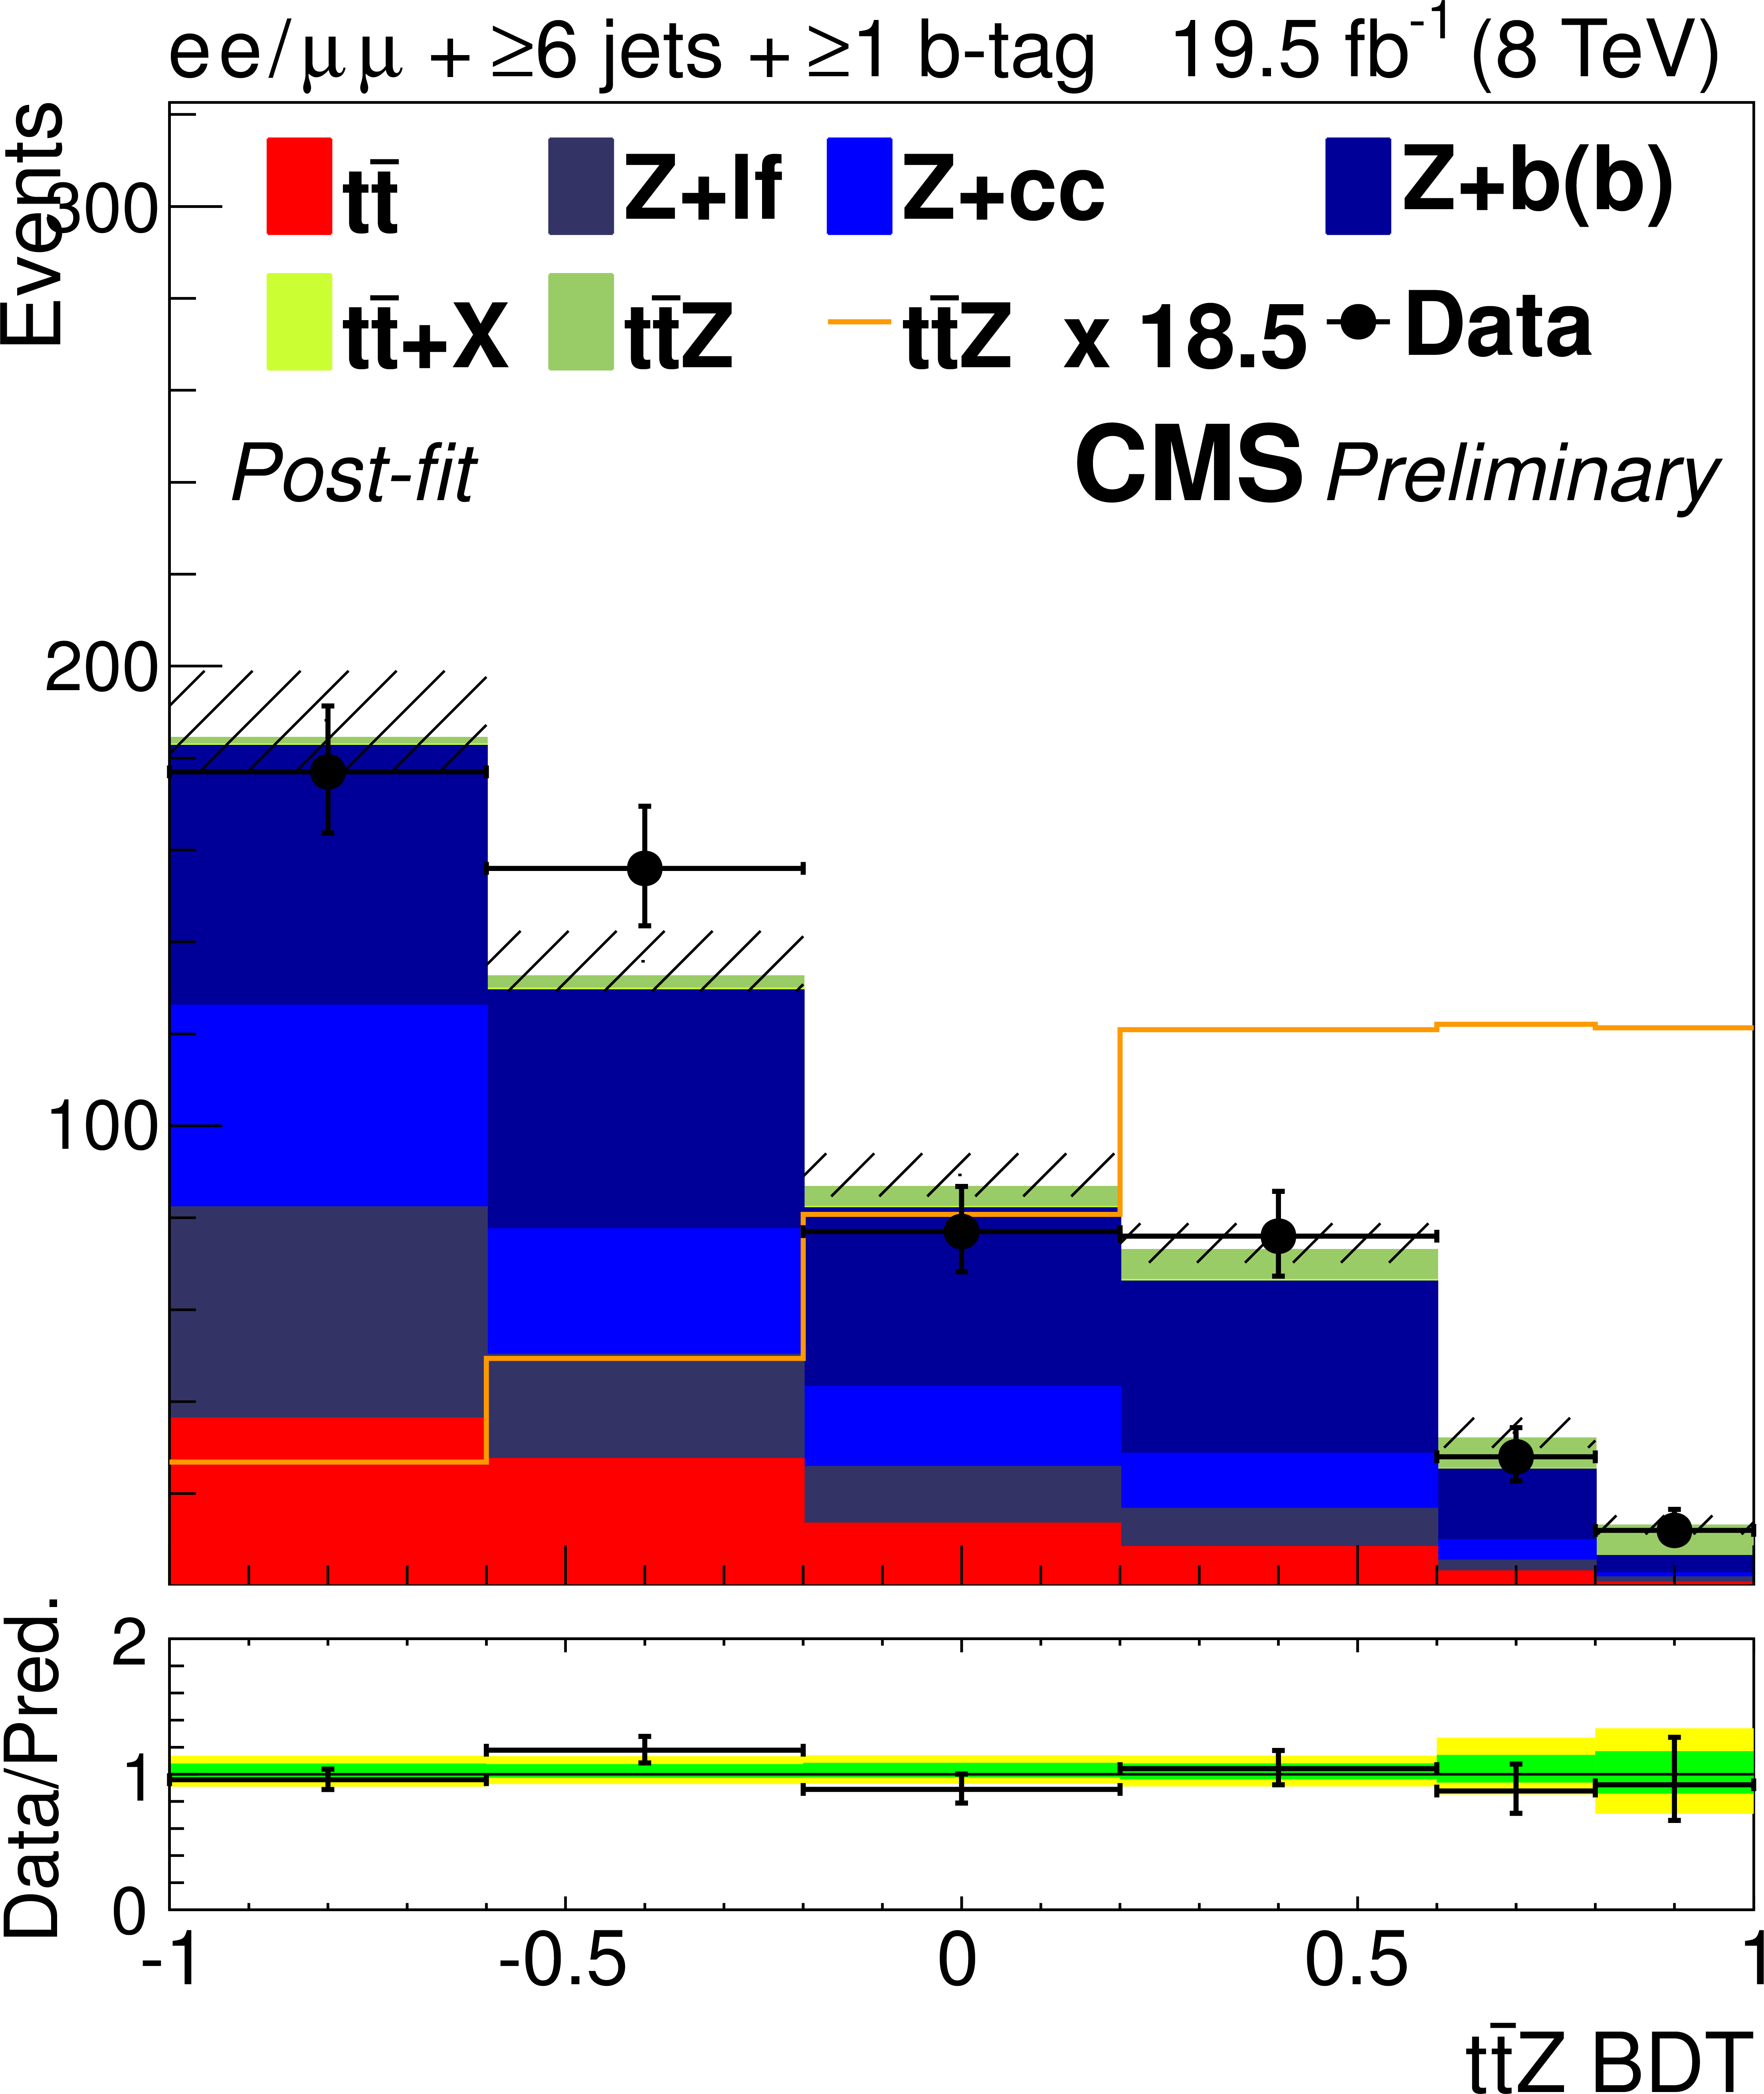
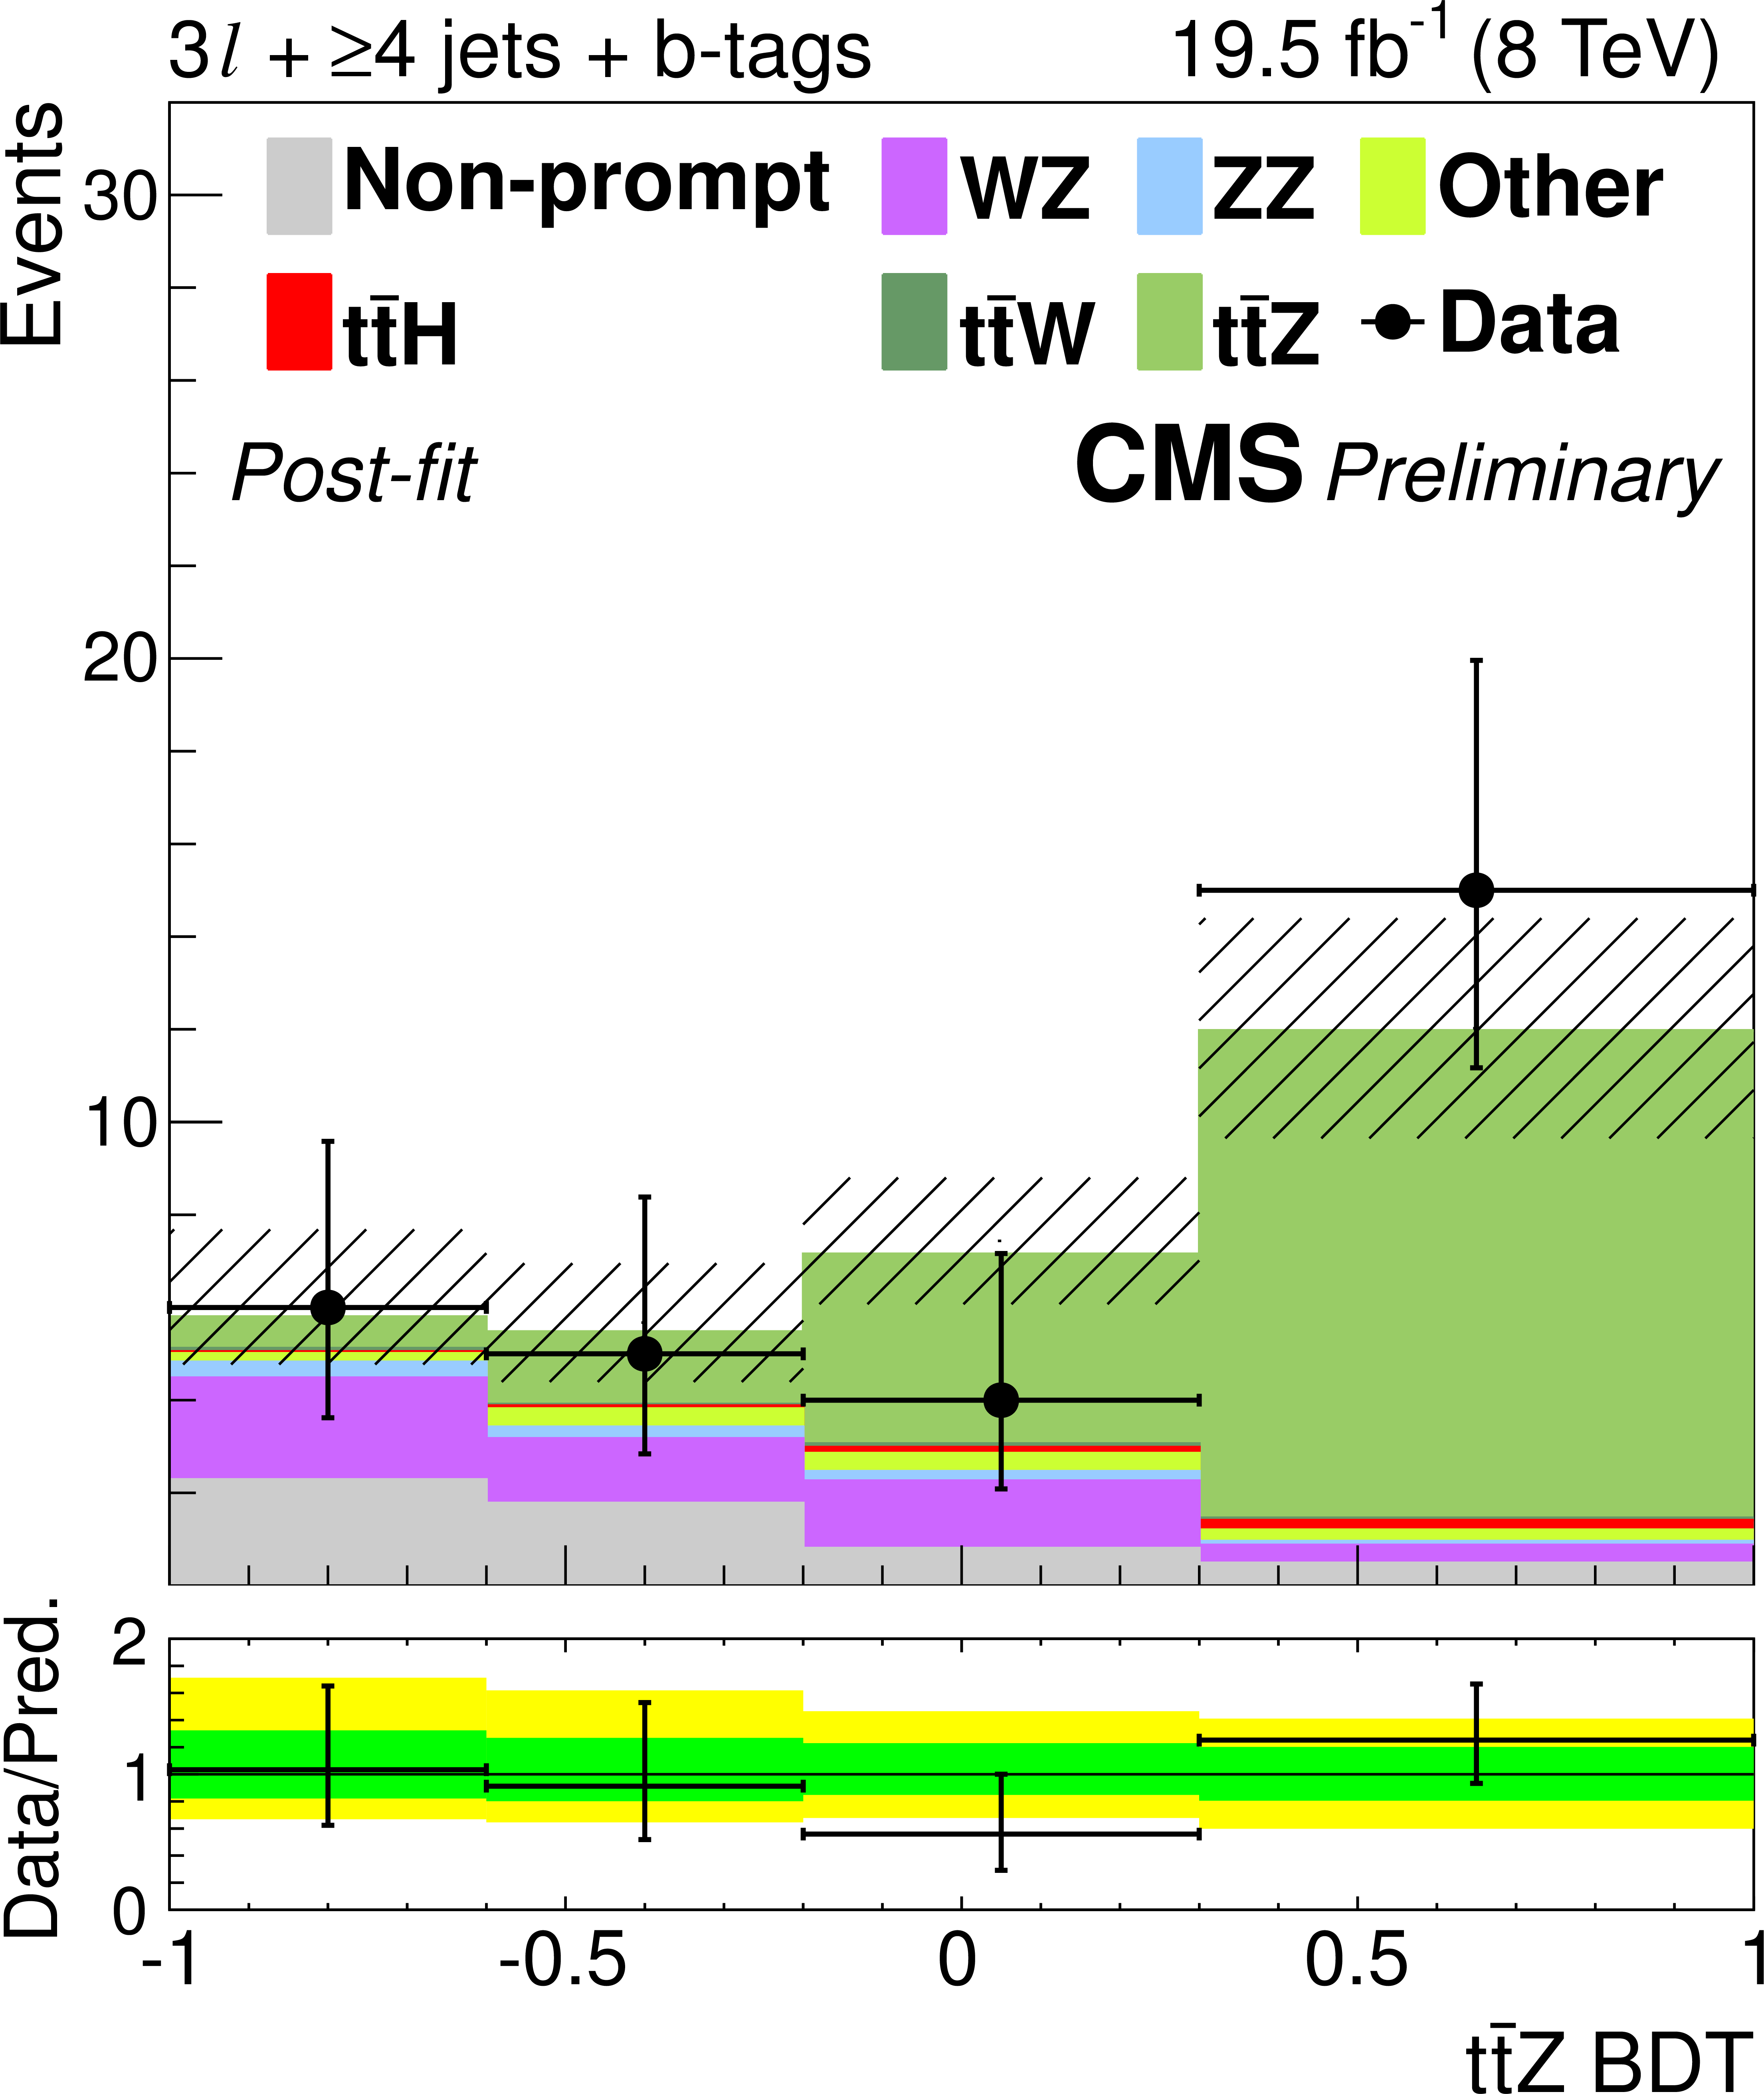
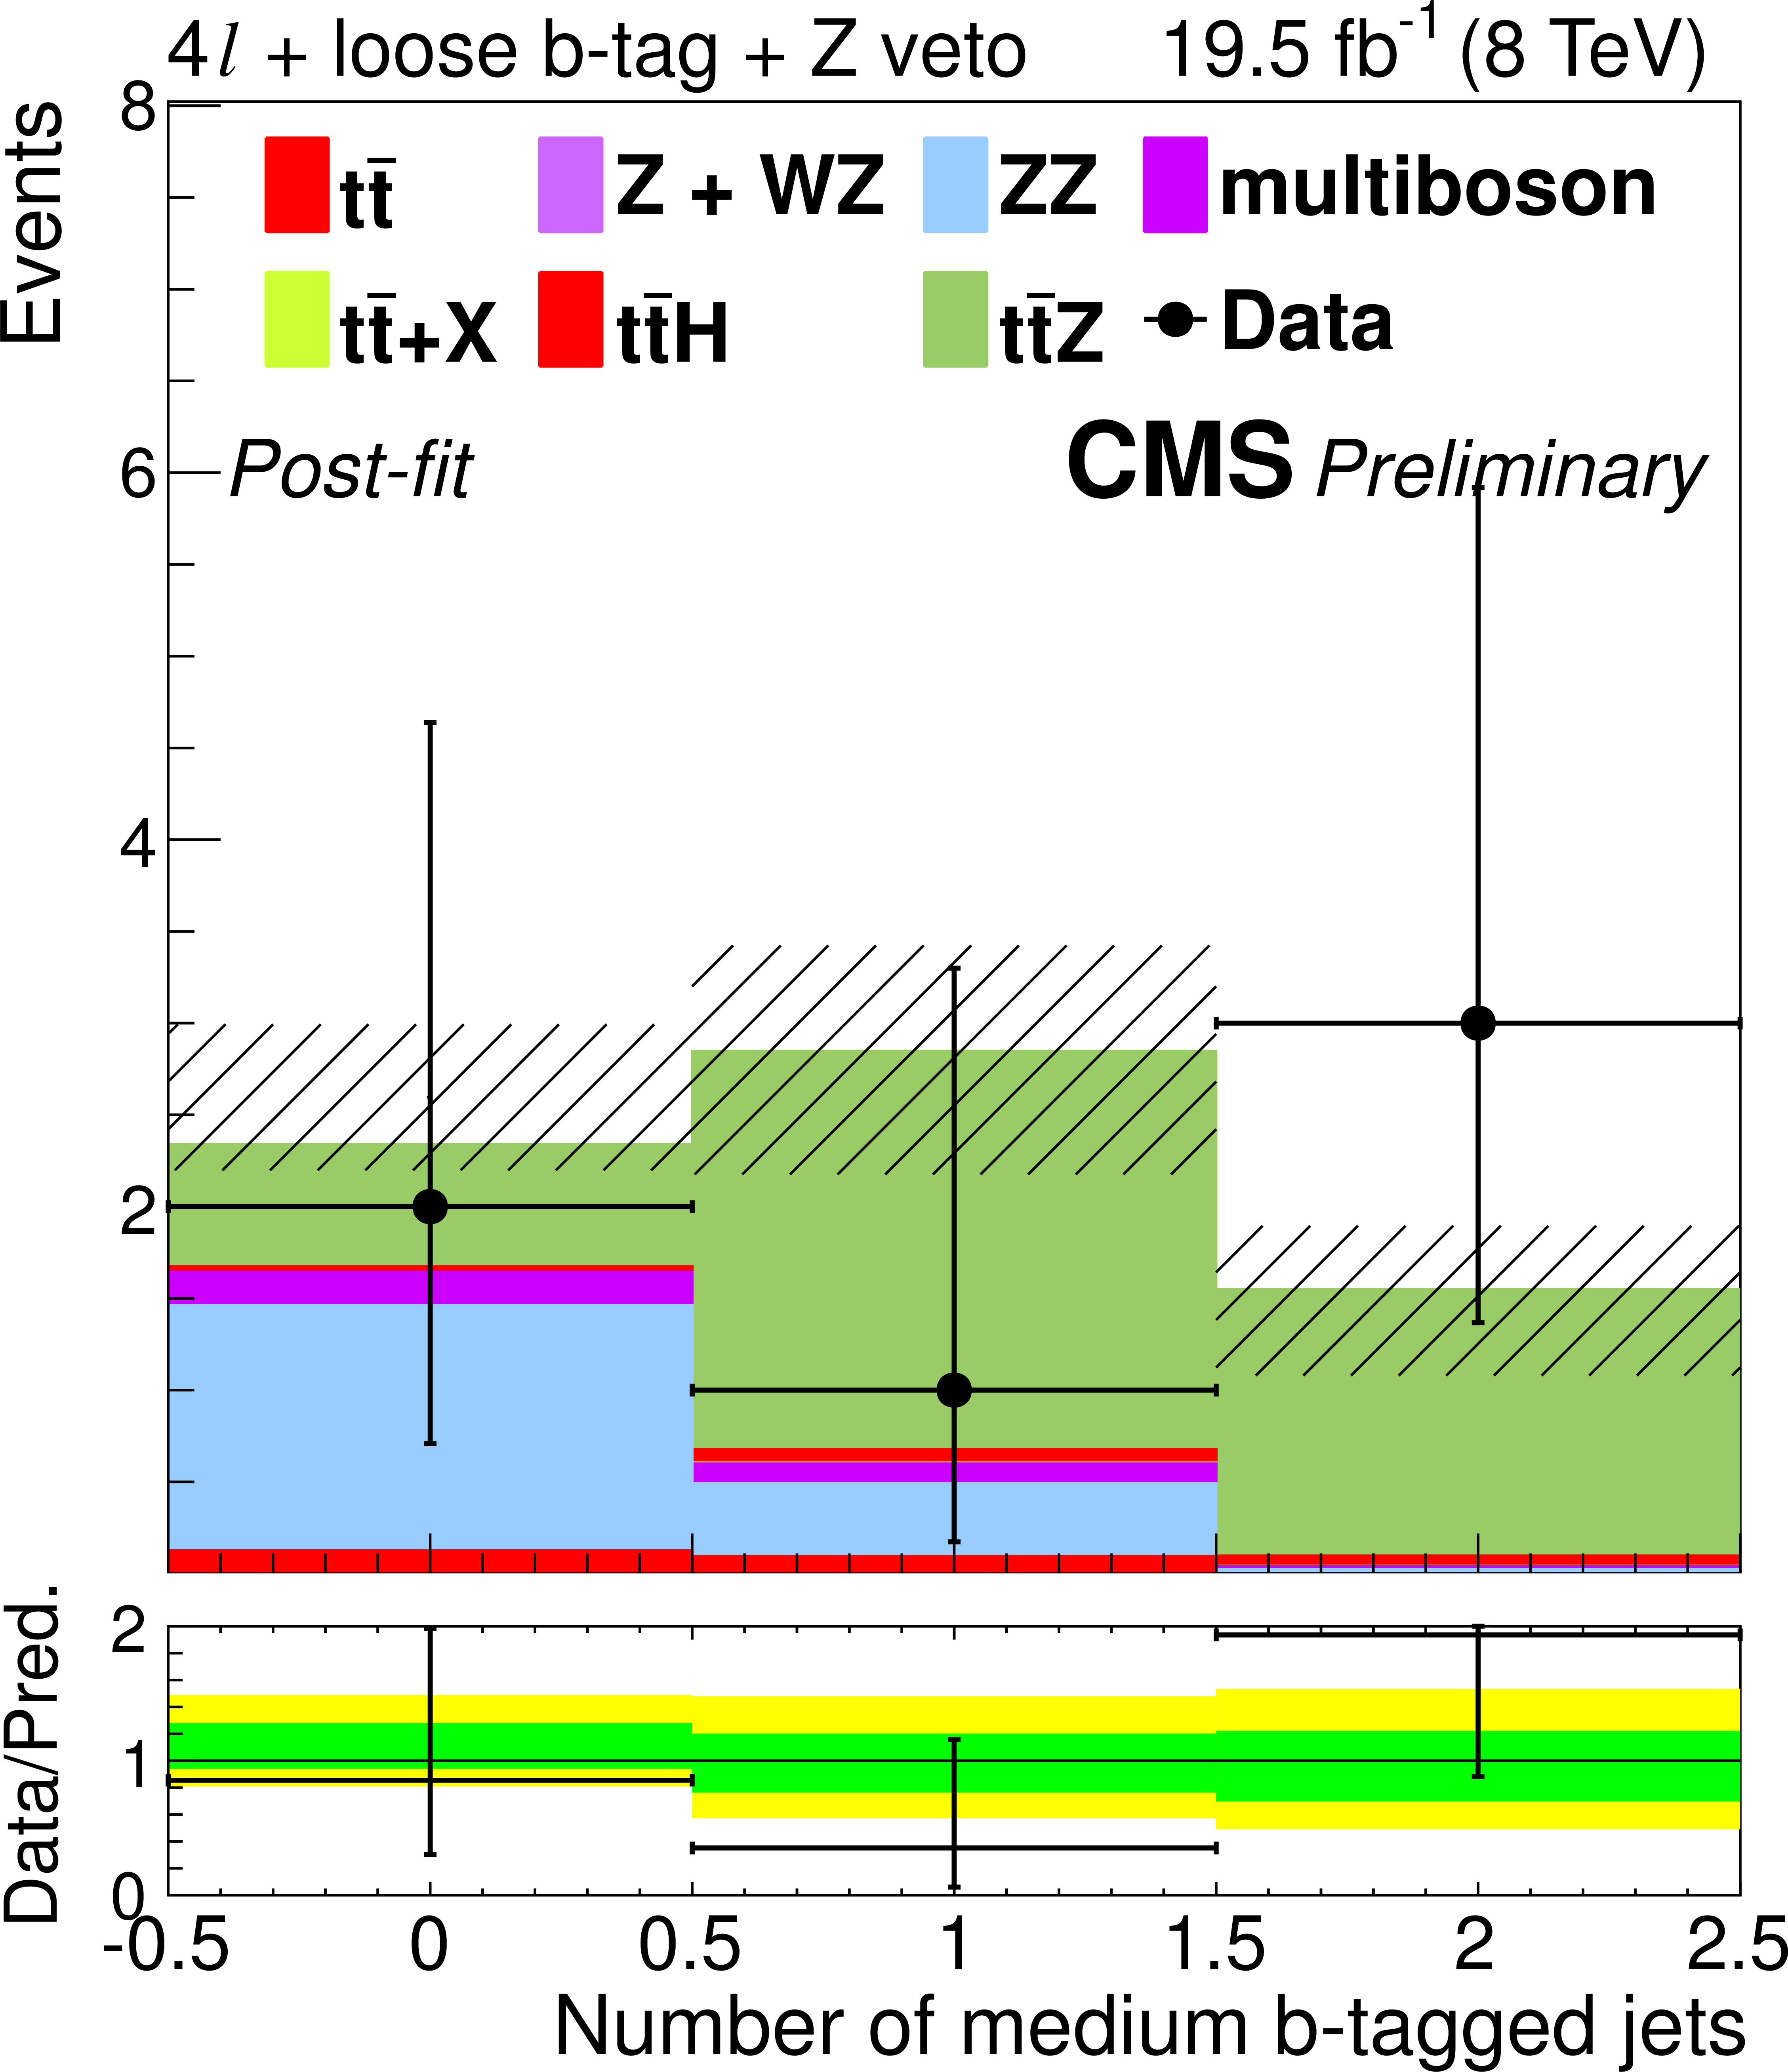
Figure 5-a:
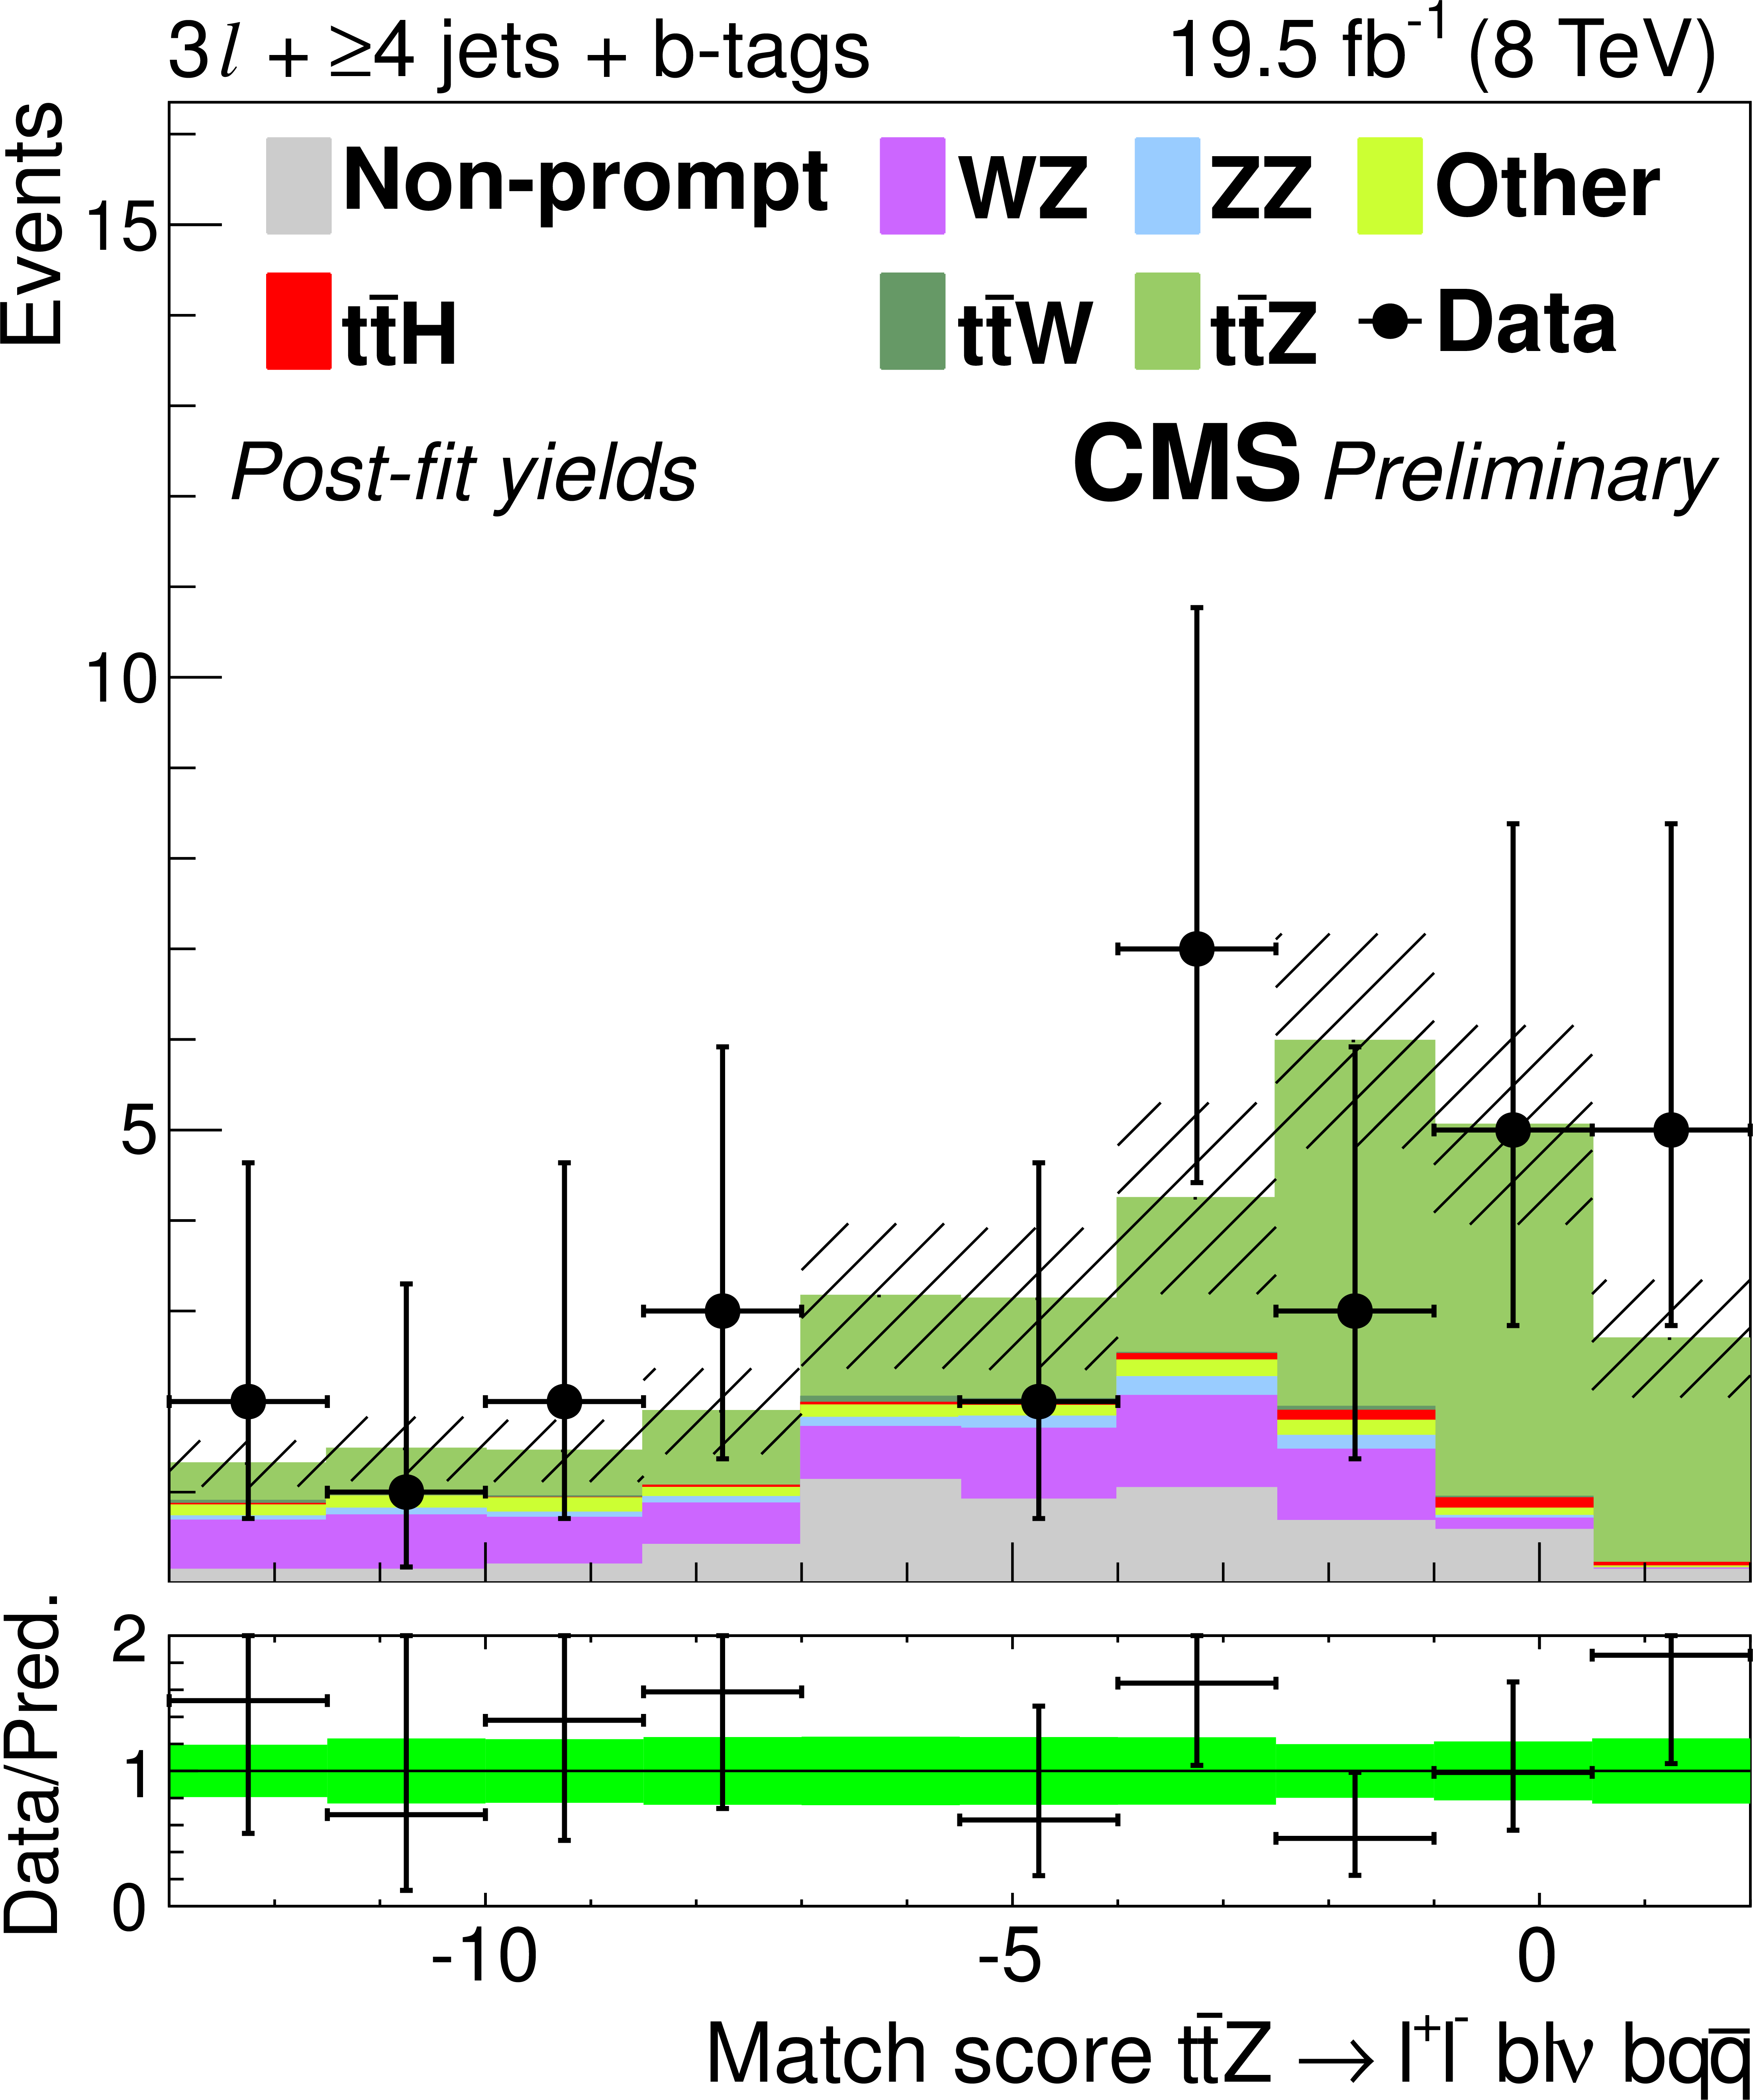
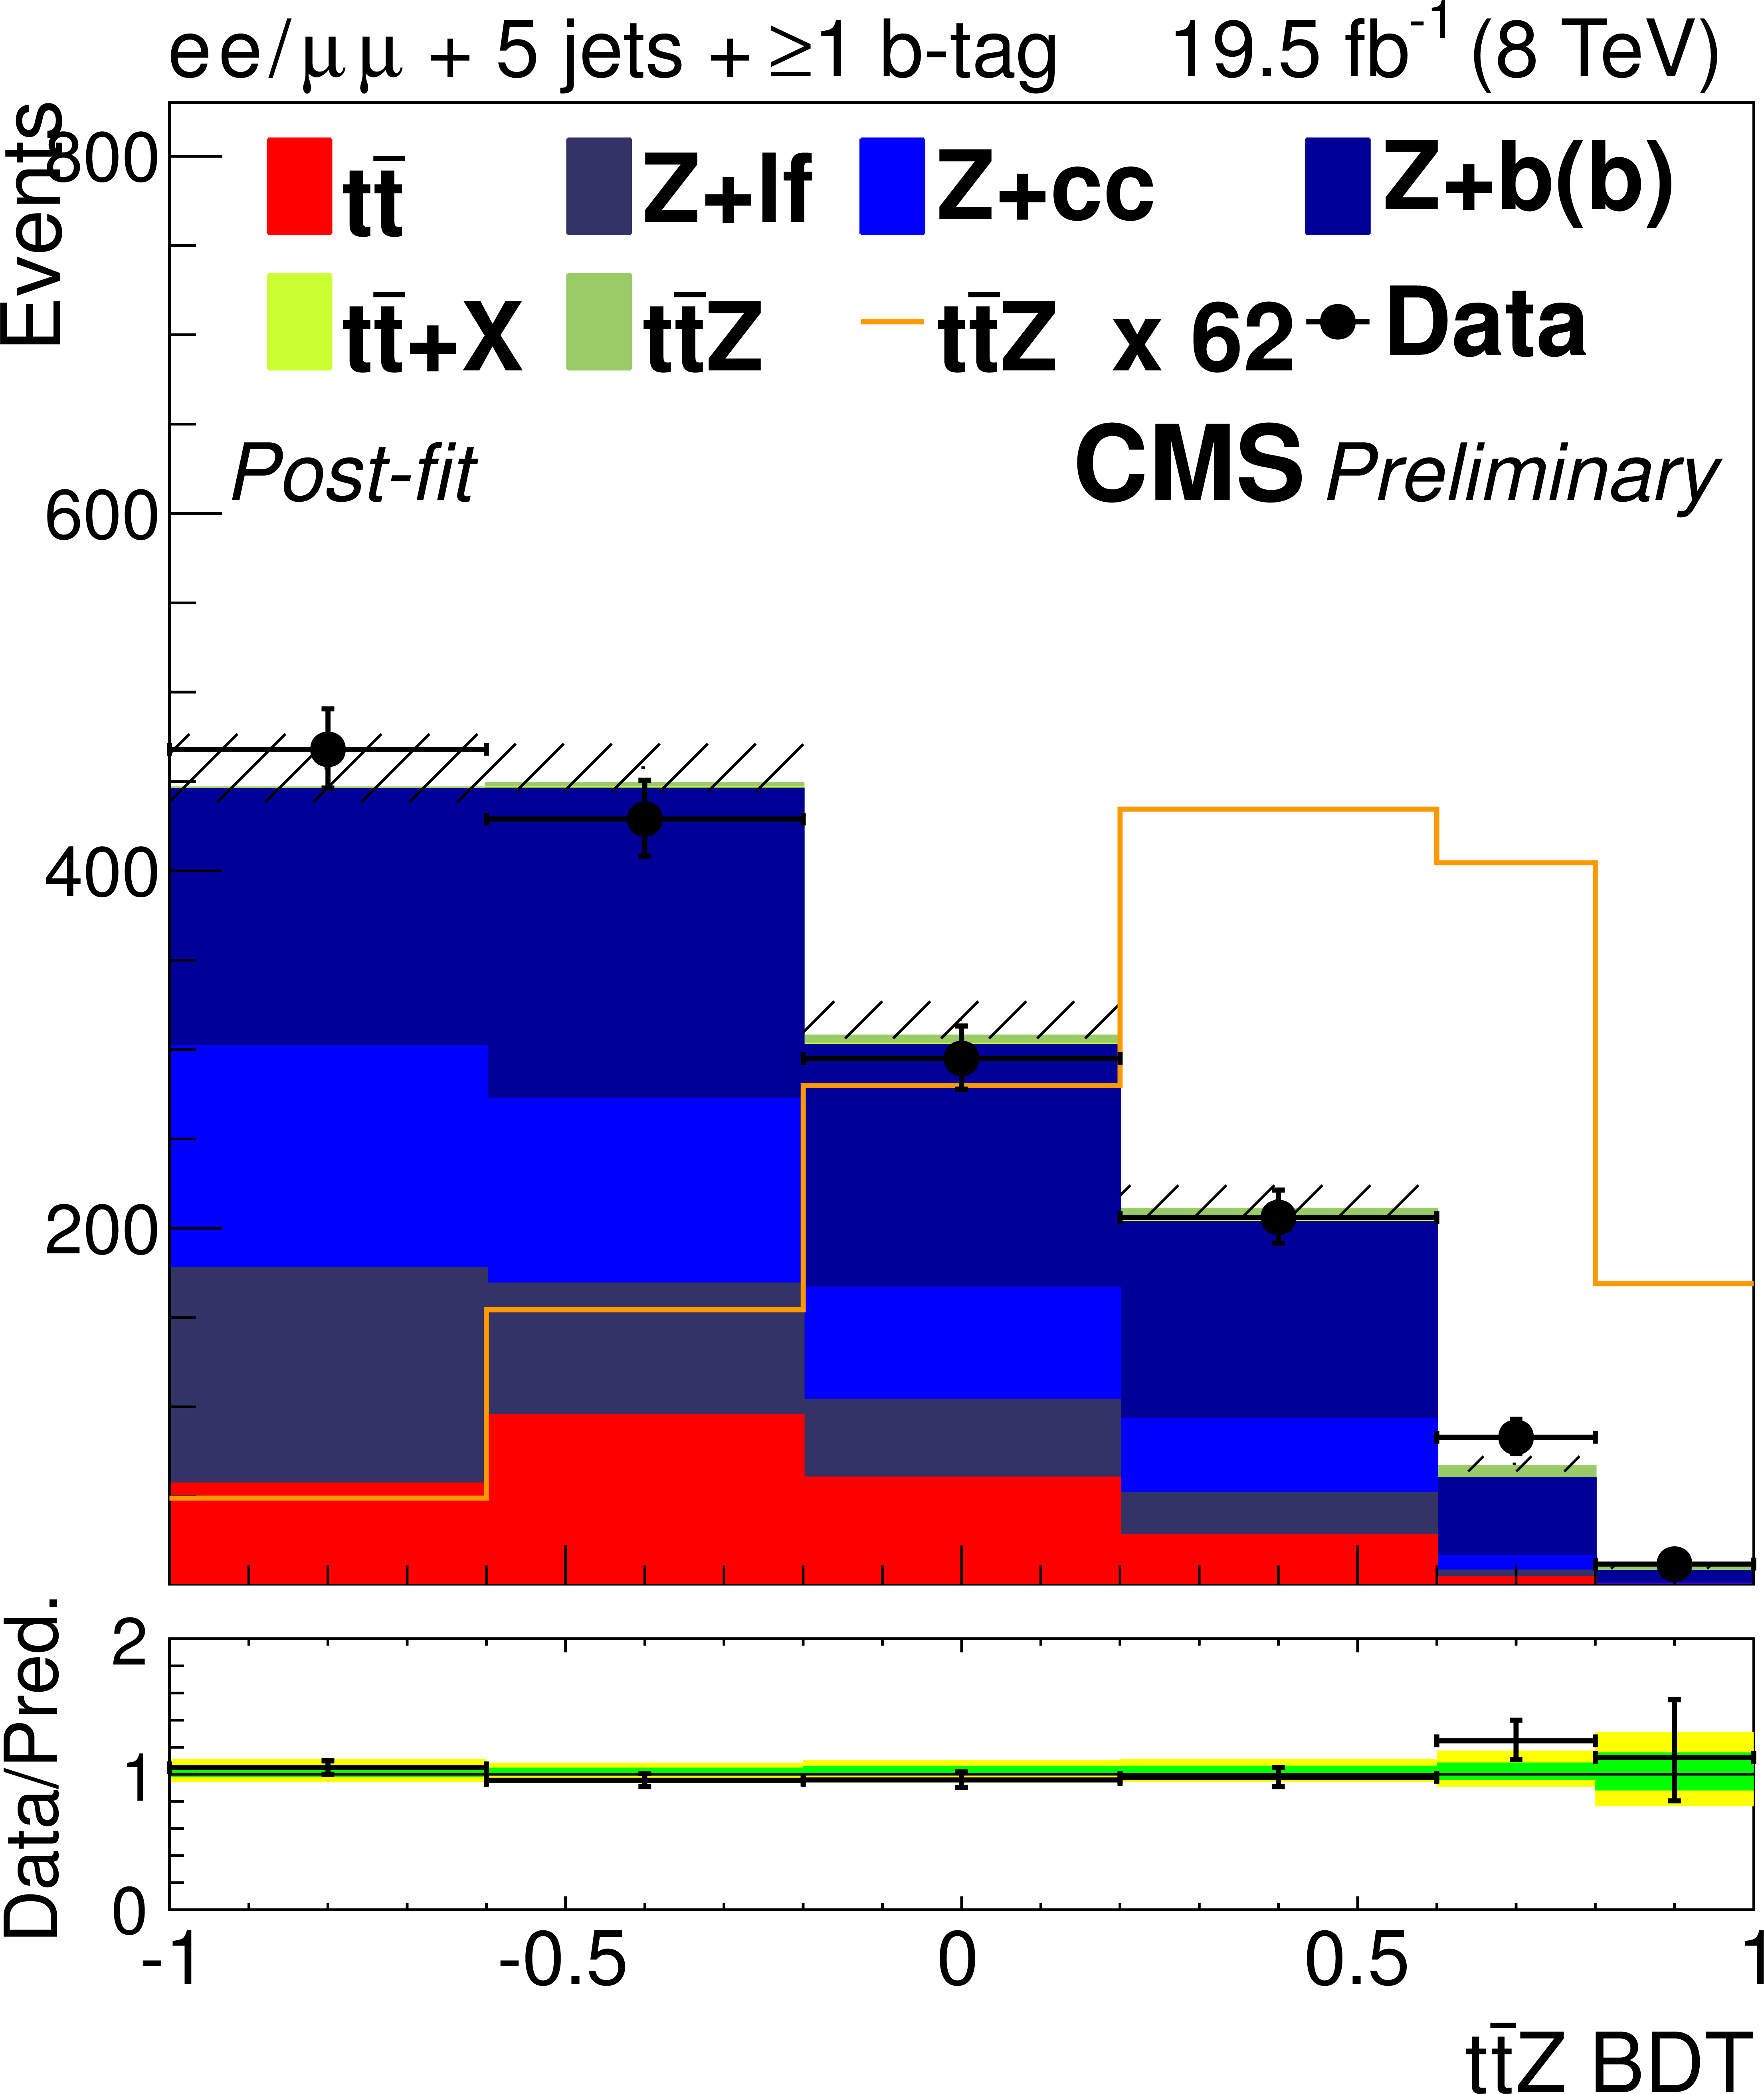
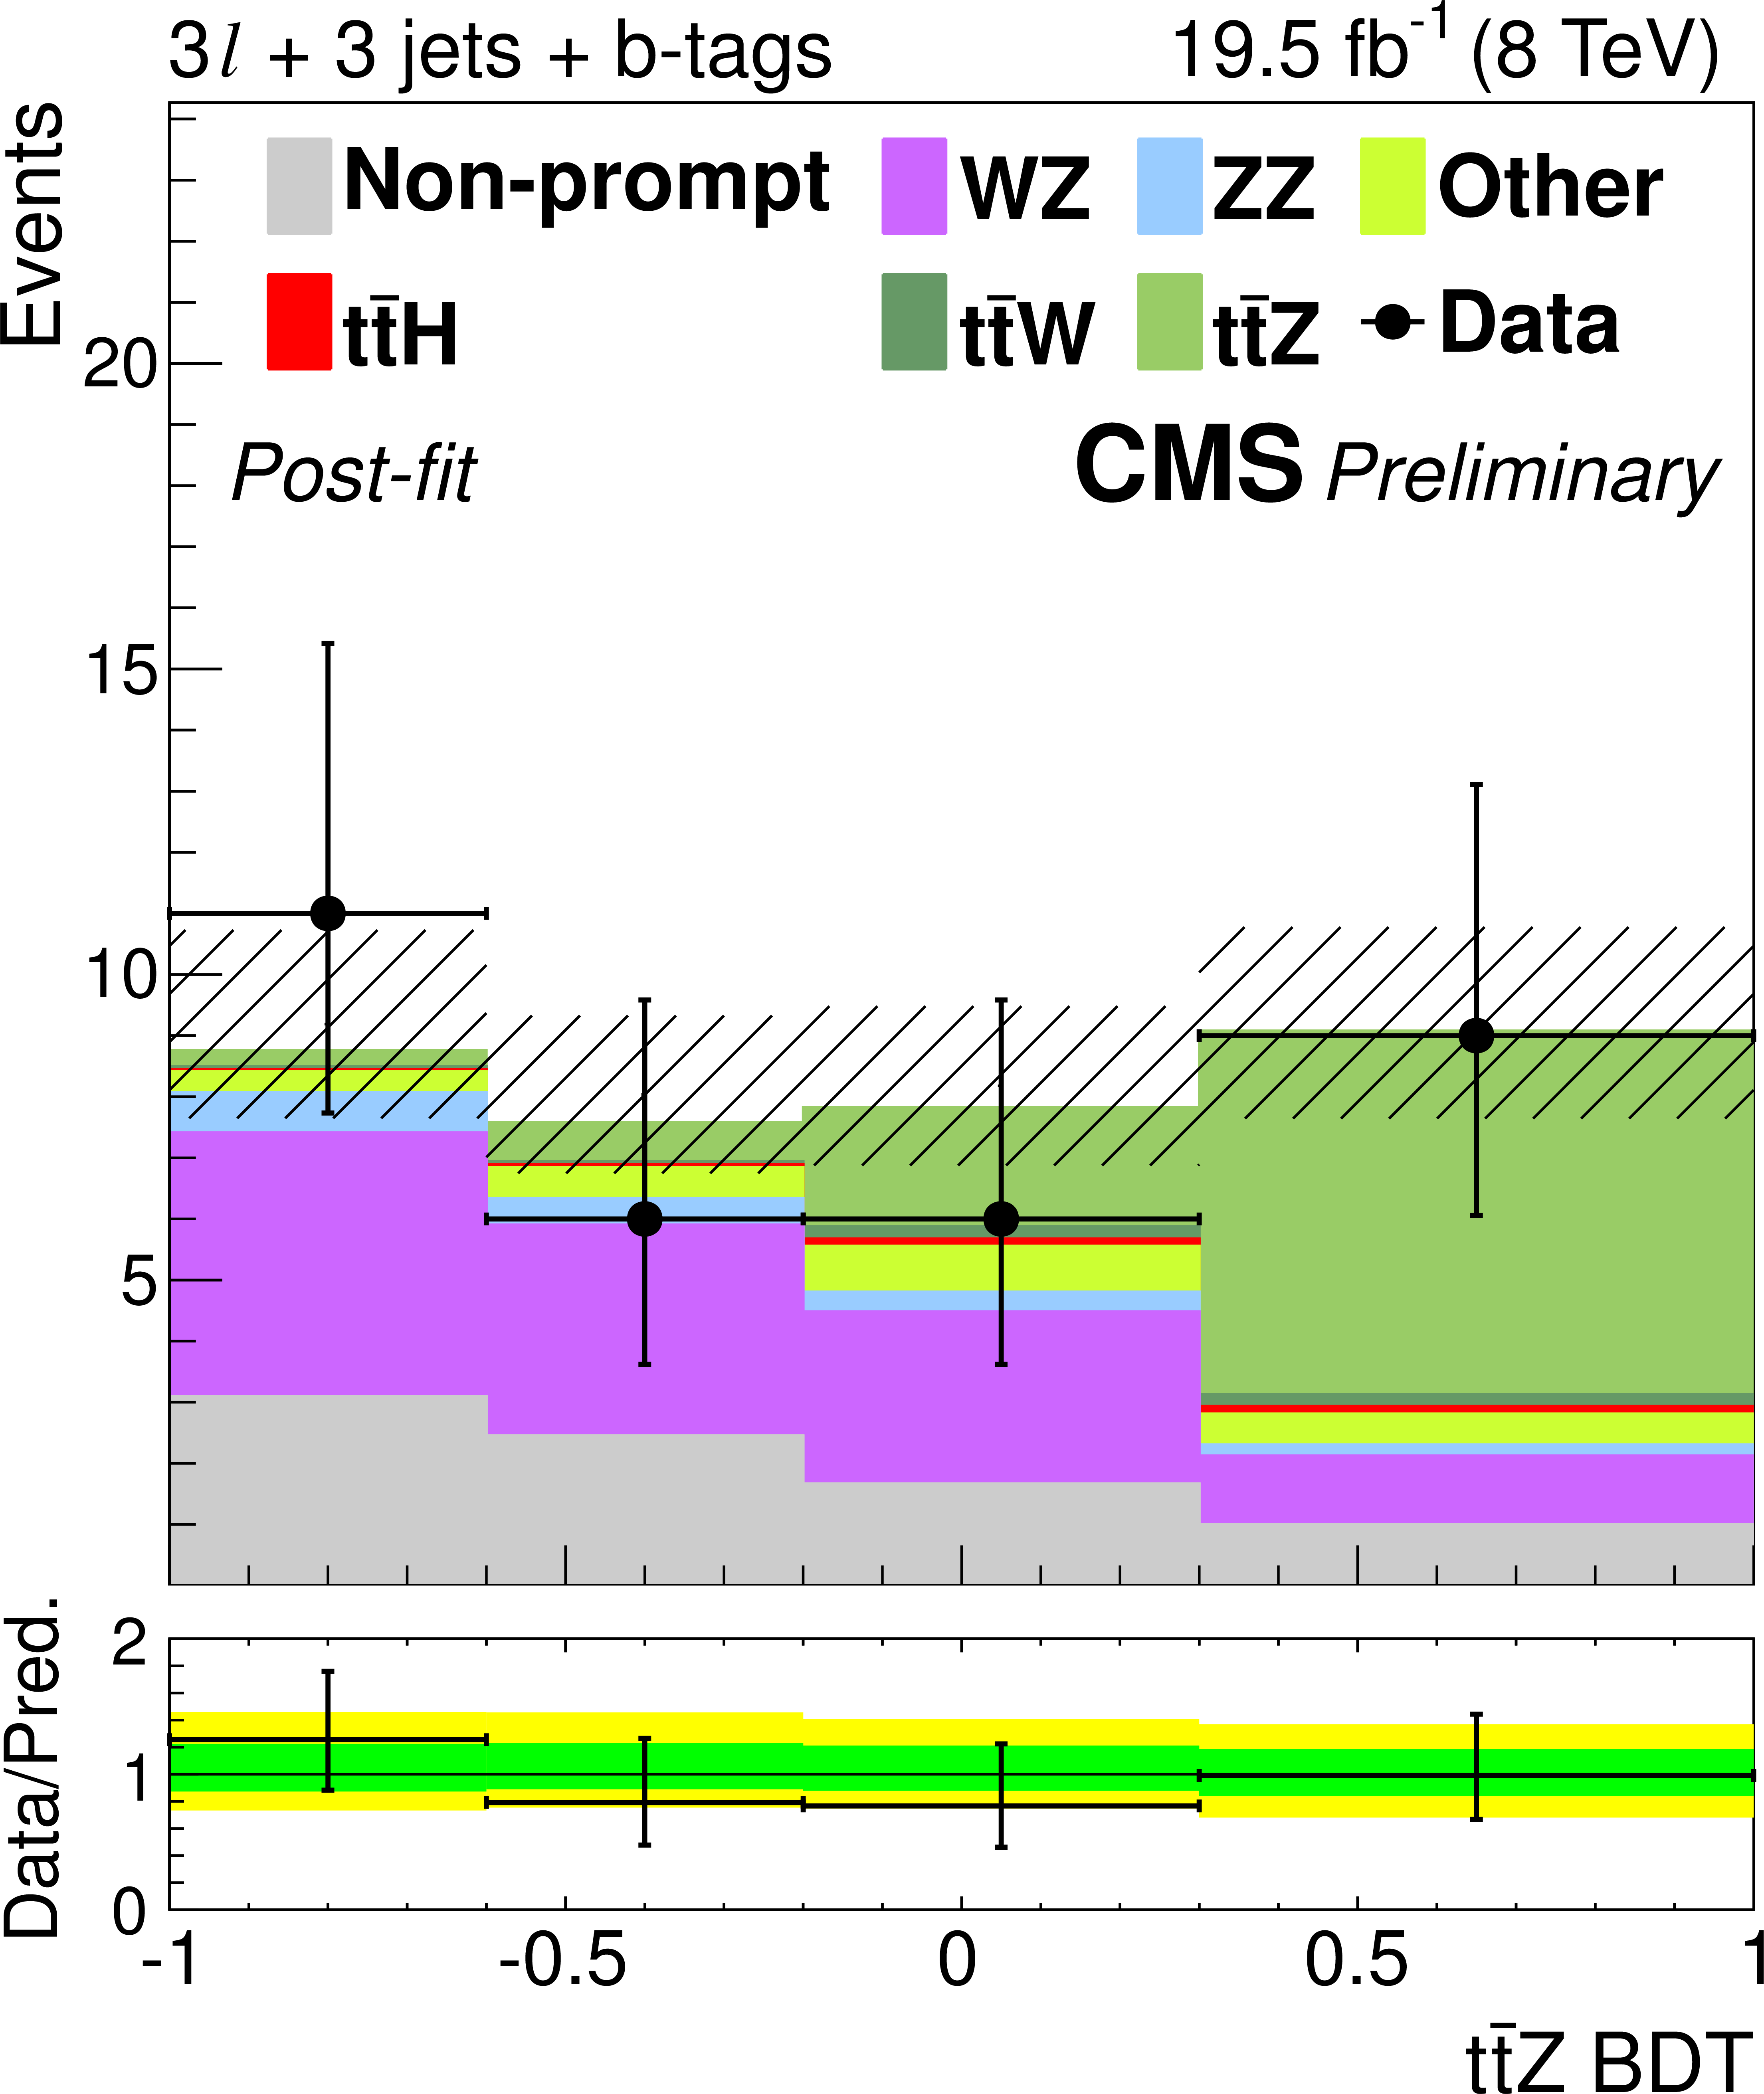
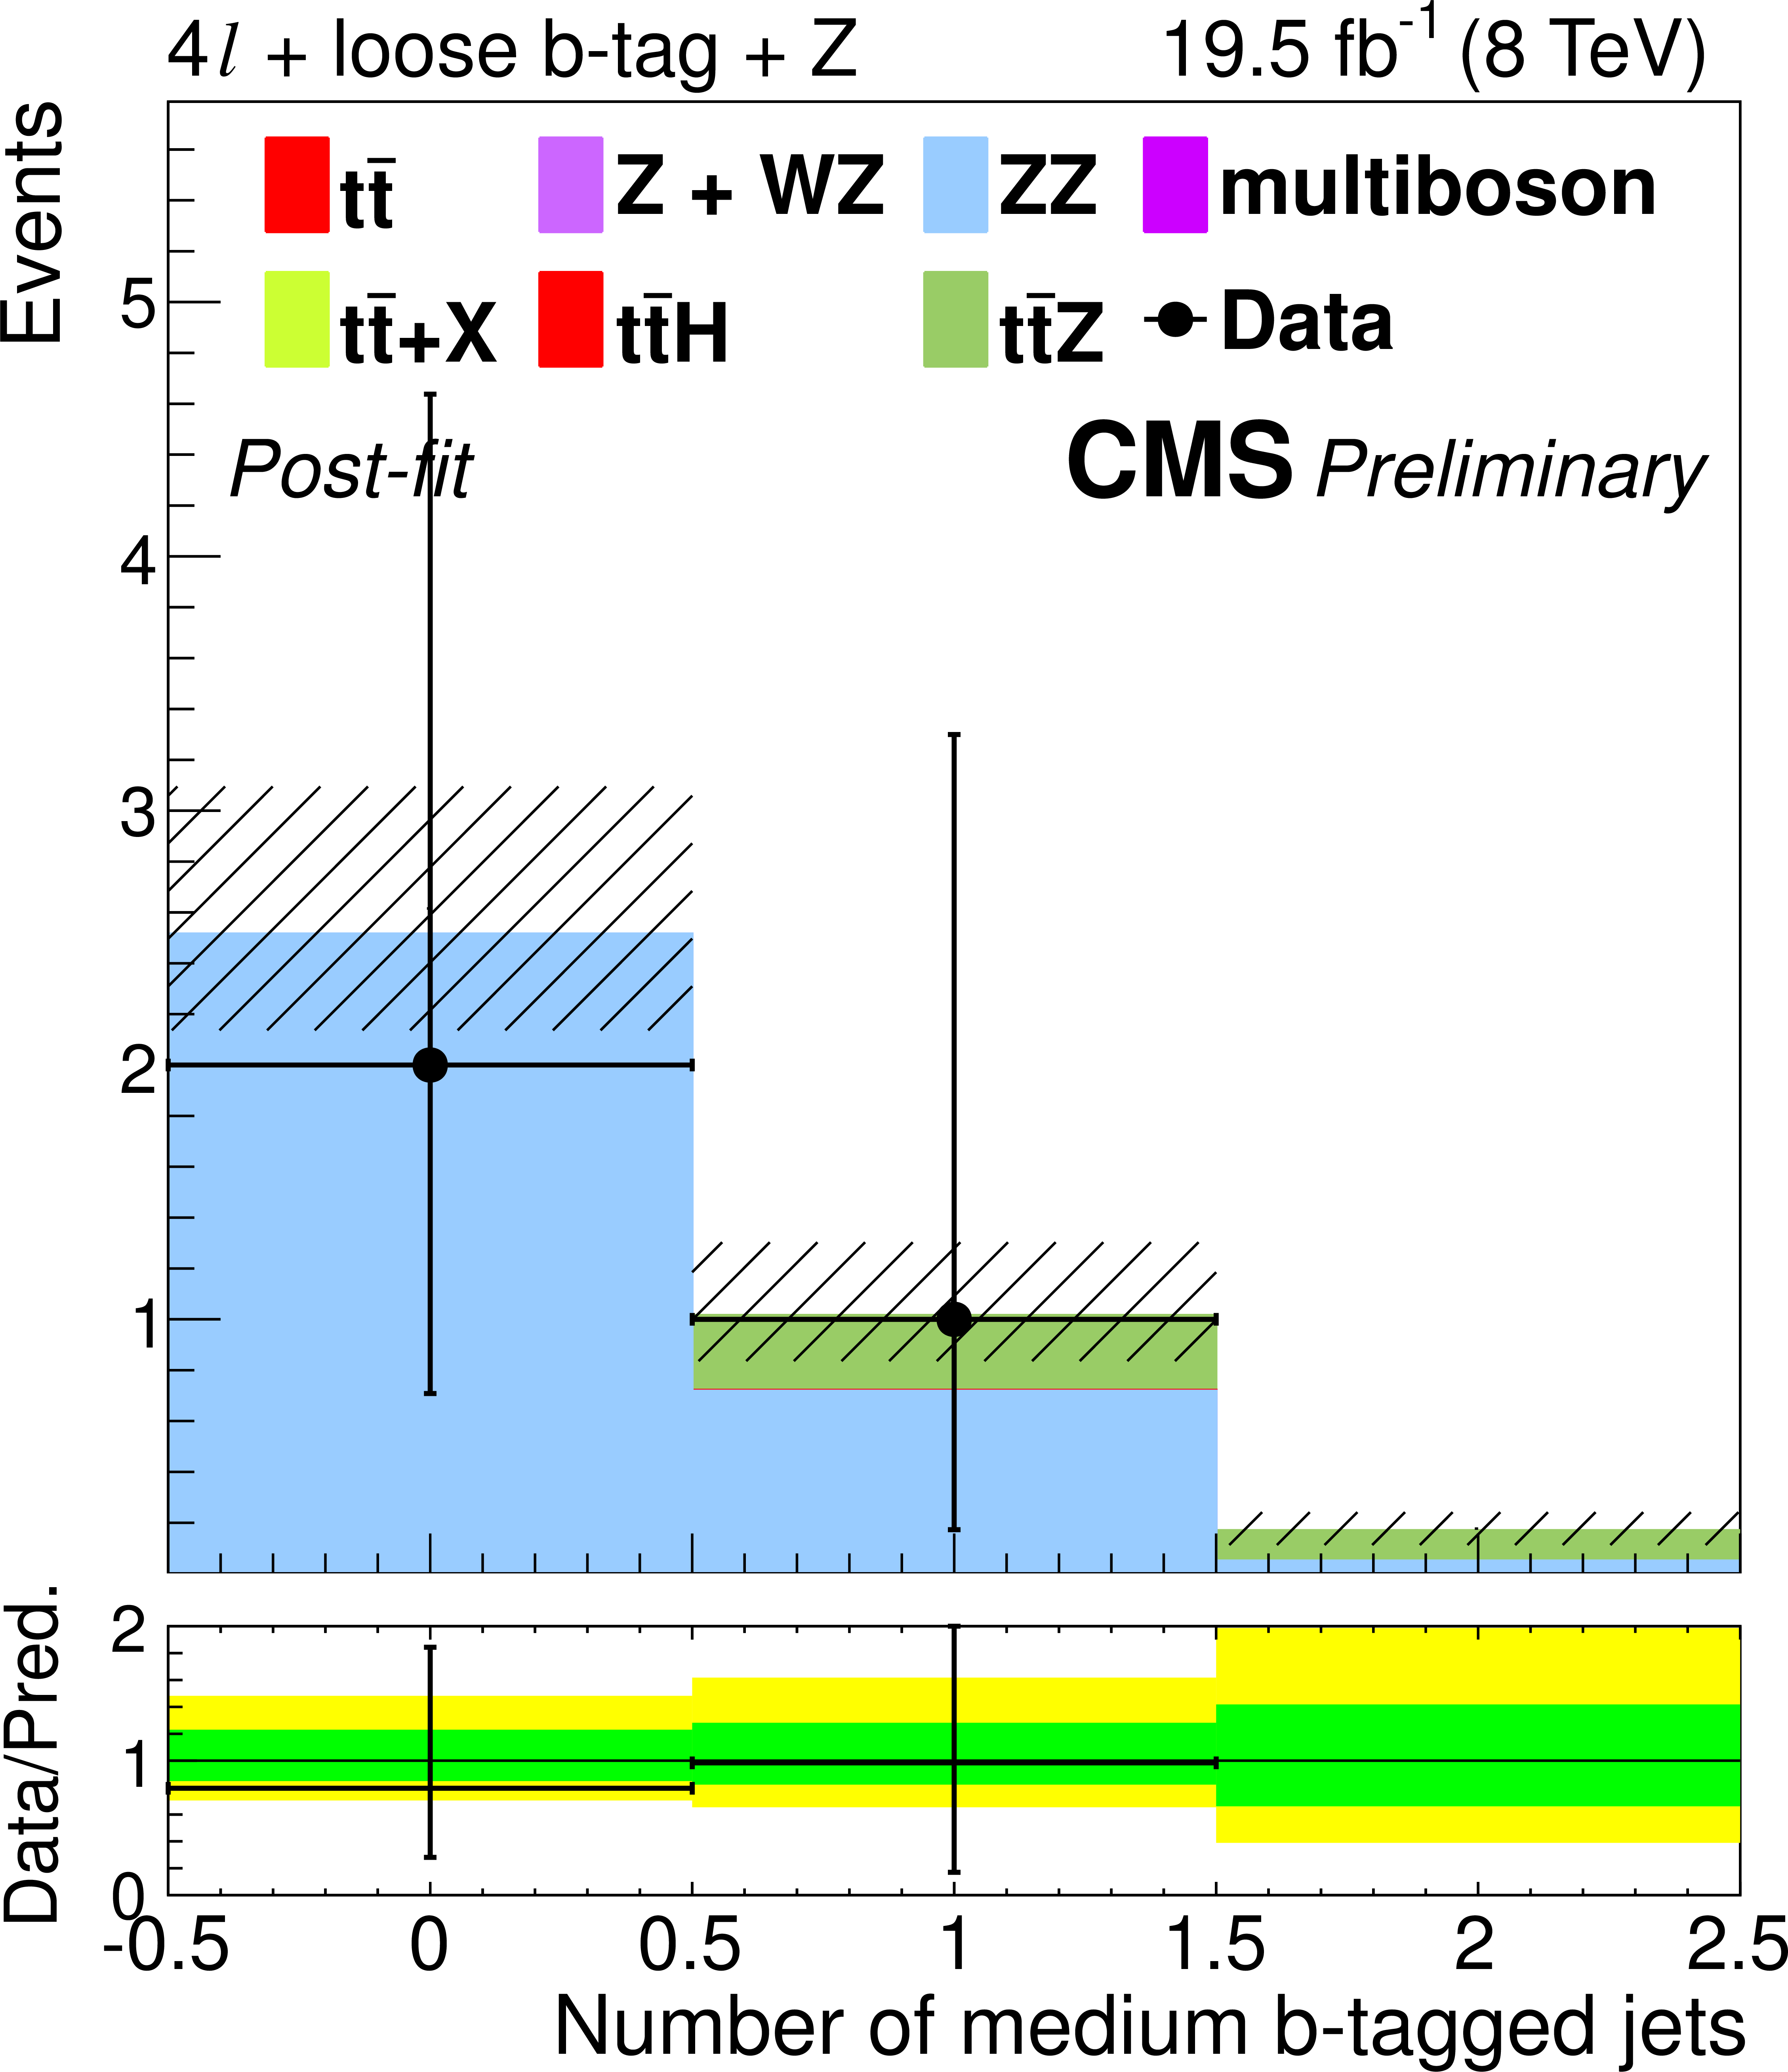
The final discriminant for $ {\mathrm {t}\overline {\mathrm {t}}} {\mathrm {Z}} $ channel events with two opposite-sign leptons (left) and 5 jets (top) or $\geq $6 jets (bottom), three leptons (center) and 3 jets (top) or $\geq $4 jets (bottom), or four leptons (right) and two lepton pairs (top) or exactly one lepton pair (bottom) consistent with a $Z \rightarrow \ell \ell $ decay, after the final fit described in Section Results-SM. The 68% CL uncertainty in the fitted signal plus background is represented by hash marks in the stack histogram, and a green shaded region in the data-to-prediction ratio plot. The 95% CL band from the fit is shown in yellow. The $ {\mathrm {t}\overline {\mathrm {t}}} $+X background includes $ {\mathrm {t}\overline {\mathrm {t}}} {\mathrm {W}}$, $ {\mathrm {t}\overline {\mathrm {t}}} {\mathrm {H}} $, and $ {\mathrm {t}\overline {\mathrm {t}}} {\mathrm {W}} {\mathrm {W}}$; ``Other'' includes $ {\mathrm {t}\overline {\mathrm {t}}} \gamma $, $ {\mathrm {t}\overline {\mathrm {t}}} \gamma ^{*}$, $ {\mathrm {t}\overline {\mathrm {t}}} {\mathrm {W}} {\mathrm {W}}$, tb$ {\mathrm {Z}}$, WWW, and WWZ. |
png ; pdf |
Figure 5-b:
The final discriminant for $ {\mathrm {t}\overline {\mathrm {t}}} {\mathrm {Z}} $ channel events with two opposite-sign leptons (left) and 5 jets (top) or $\geq $6 jets (bottom), three leptons (center) and 3 jets (top) or $\geq $4 jets (bottom), or four leptons (right) and two lepton pairs (top) or exactly one lepton pair (bottom) consistent with a $Z \rightarrow \ell \ell $ decay, after the final fit described in Section Results-SM. The 68% CL uncertainty in the fitted signal plus background is represented by hash marks in the stack histogram, and a green shaded region in the data-to-prediction ratio plot. The 95% CL band from the fit is shown in yellow. The $ {\mathrm {t}\overline {\mathrm {t}}} $+X background includes $ {\mathrm {t}\overline {\mathrm {t}}} {\mathrm {W}}$, $ {\mathrm {t}\overline {\mathrm {t}}} {\mathrm {H}} $, and $ {\mathrm {t}\overline {\mathrm {t}}} {\mathrm {W}} {\mathrm {W}}$; ``Other'' includes $ {\mathrm {t}\overline {\mathrm {t}}} \gamma $, $ {\mathrm {t}\overline {\mathrm {t}}} \gamma ^{*}$, $ {\mathrm {t}\overline {\mathrm {t}}} {\mathrm {W}} {\mathrm {W}}$, tb$ {\mathrm {Z}}$, WWW, and WWZ. |
png ; pdf |
Figure 5-c:
The final discriminant for $ {\mathrm {t}\overline {\mathrm {t}}} {\mathrm {Z}} $ channel events with two opposite-sign leptons (left) and 5 jets (top) or $\geq $6 jets (bottom), three leptons (center) and 3 jets (top) or $\geq $4 jets (bottom), or four leptons (right) and two lepton pairs (top) or exactly one lepton pair (bottom) consistent with a $Z \rightarrow \ell \ell $ decay, after the final fit described in Section Results-SM. The 68% CL uncertainty in the fitted signal plus background is represented by hash marks in the stack histogram, and a green shaded region in the data-to-prediction ratio plot. The 95% CL band from the fit is shown in yellow. The $ {\mathrm {t}\overline {\mathrm {t}}} $+X background includes $ {\mathrm {t}\overline {\mathrm {t}}} {\mathrm {W}}$, $ {\mathrm {t}\overline {\mathrm {t}}} {\mathrm {H}} $, and $ {\mathrm {t}\overline {\mathrm {t}}} {\mathrm {W}} {\mathrm {W}}$; ``Other'' includes $ {\mathrm {t}\overline {\mathrm {t}}} \gamma $, $ {\mathrm {t}\overline {\mathrm {t}}} \gamma ^{*}$, $ {\mathrm {t}\overline {\mathrm {t}}} {\mathrm {W}} {\mathrm {W}}$, tb$ {\mathrm {Z}}$, WWW, and WWZ. |
png ; pdf |
Figure 5-d:
The final discriminant for $ {\mathrm {t}\overline {\mathrm {t}}} {\mathrm {Z}} $ channel events with two opposite-sign leptons (left) and 5 jets (top) or $\geq $6 jets (bottom), three leptons (center) and 3 jets (top) or $\geq $4 jets (bottom), or four leptons (right) and two lepton pairs (top) or exactly one lepton pair (bottom) consistent with a $Z \rightarrow \ell \ell $ decay, after the final fit described in Section Results-SM. The 68% CL uncertainty in the fitted signal plus background is represented by hash marks in the stack histogram, and a green shaded region in the data-to-prediction ratio plot. The 95% CL band from the fit is shown in yellow. The $ {\mathrm {t}\overline {\mathrm {t}}} $+X background includes $ {\mathrm {t}\overline {\mathrm {t}}} {\mathrm {W}}$, $ {\mathrm {t}\overline {\mathrm {t}}} {\mathrm {H}} $, and $ {\mathrm {t}\overline {\mathrm {t}}} {\mathrm {W}} {\mathrm {W}}$; ``Other'' includes $ {\mathrm {t}\overline {\mathrm {t}}} \gamma $, $ {\mathrm {t}\overline {\mathrm {t}}} \gamma ^{*}$, $ {\mathrm {t}\overline {\mathrm {t}}} {\mathrm {W}} {\mathrm {W}}$, tb$ {\mathrm {Z}}$, WWW, and WWZ. |
png ; pdf |
Figure 5-e:
The final discriminant for $ {\mathrm {t}\overline {\mathrm {t}}} {\mathrm {Z}} $ channel events with two opposite-sign leptons (left) and 5 jets (top) or $\geq $6 jets (bottom), three leptons (center) and 3 jets (top) or $\geq $4 jets (bottom), or four leptons (right) and two lepton pairs (top) or exactly one lepton pair (bottom) consistent with a $Z \rightarrow \ell \ell $ decay, after the final fit described in Section Results-SM. The 68% CL uncertainty in the fitted signal plus background is represented by hash marks in the stack histogram, and a green shaded region in the data-to-prediction ratio plot. The 95% CL band from the fit is shown in yellow. The $ {\mathrm {t}\overline {\mathrm {t}}} $+X background includes $ {\mathrm {t}\overline {\mathrm {t}}} {\mathrm {W}}$, $ {\mathrm {t}\overline {\mathrm {t}}} {\mathrm {H}} $, and $ {\mathrm {t}\overline {\mathrm {t}}} {\mathrm {W}} {\mathrm {W}}$; ``Other'' includes $ {\mathrm {t}\overline {\mathrm {t}}} \gamma $, $ {\mathrm {t}\overline {\mathrm {t}}} \gamma ^{*}$, $ {\mathrm {t}\overline {\mathrm {t}}} {\mathrm {W}} {\mathrm {W}}$, tb$ {\mathrm {Z}}$, WWW, and WWZ. |
png ; pdf |
Figure 5-f:
The final discriminant for $ {\mathrm {t}\overline {\mathrm {t}}} {\mathrm {Z}} $ channel events with two opposite-sign leptons (left) and 5 jets (top) or $\geq $6 jets (bottom), three leptons (center) and 3 jets (top) or $\geq $4 jets (bottom), or four leptons (right) and two lepton pairs (top) or exactly one lepton pair (bottom) consistent with a $Z \rightarrow \ell \ell $ decay, after the final fit described in Section Results-SM. The 68% CL uncertainty in the fitted signal plus background is represented by hash marks in the stack histogram, and a green shaded region in the data-to-prediction ratio plot. The 95% CL band from the fit is shown in yellow. The $ {\mathrm {t}\overline {\mathrm {t}}} $+X background includes $ {\mathrm {t}\overline {\mathrm {t}}} {\mathrm {W}}$, $ {\mathrm {t}\overline {\mathrm {t}}} {\mathrm {H}} $, and $ {\mathrm {t}\overline {\mathrm {t}}} {\mathrm {W}} {\mathrm {W}}$; ``Other'' includes $ {\mathrm {t}\overline {\mathrm {t}}} \gamma $, $ {\mathrm {t}\overline {\mathrm {t}}} \gamma ^{*}$, $ {\mathrm {t}\overline {\mathrm {t}}} {\mathrm {W}} {\mathrm {W}}$, tb$ {\mathrm {Z}}$, WWW, and WWZ. |
png ; pdf |
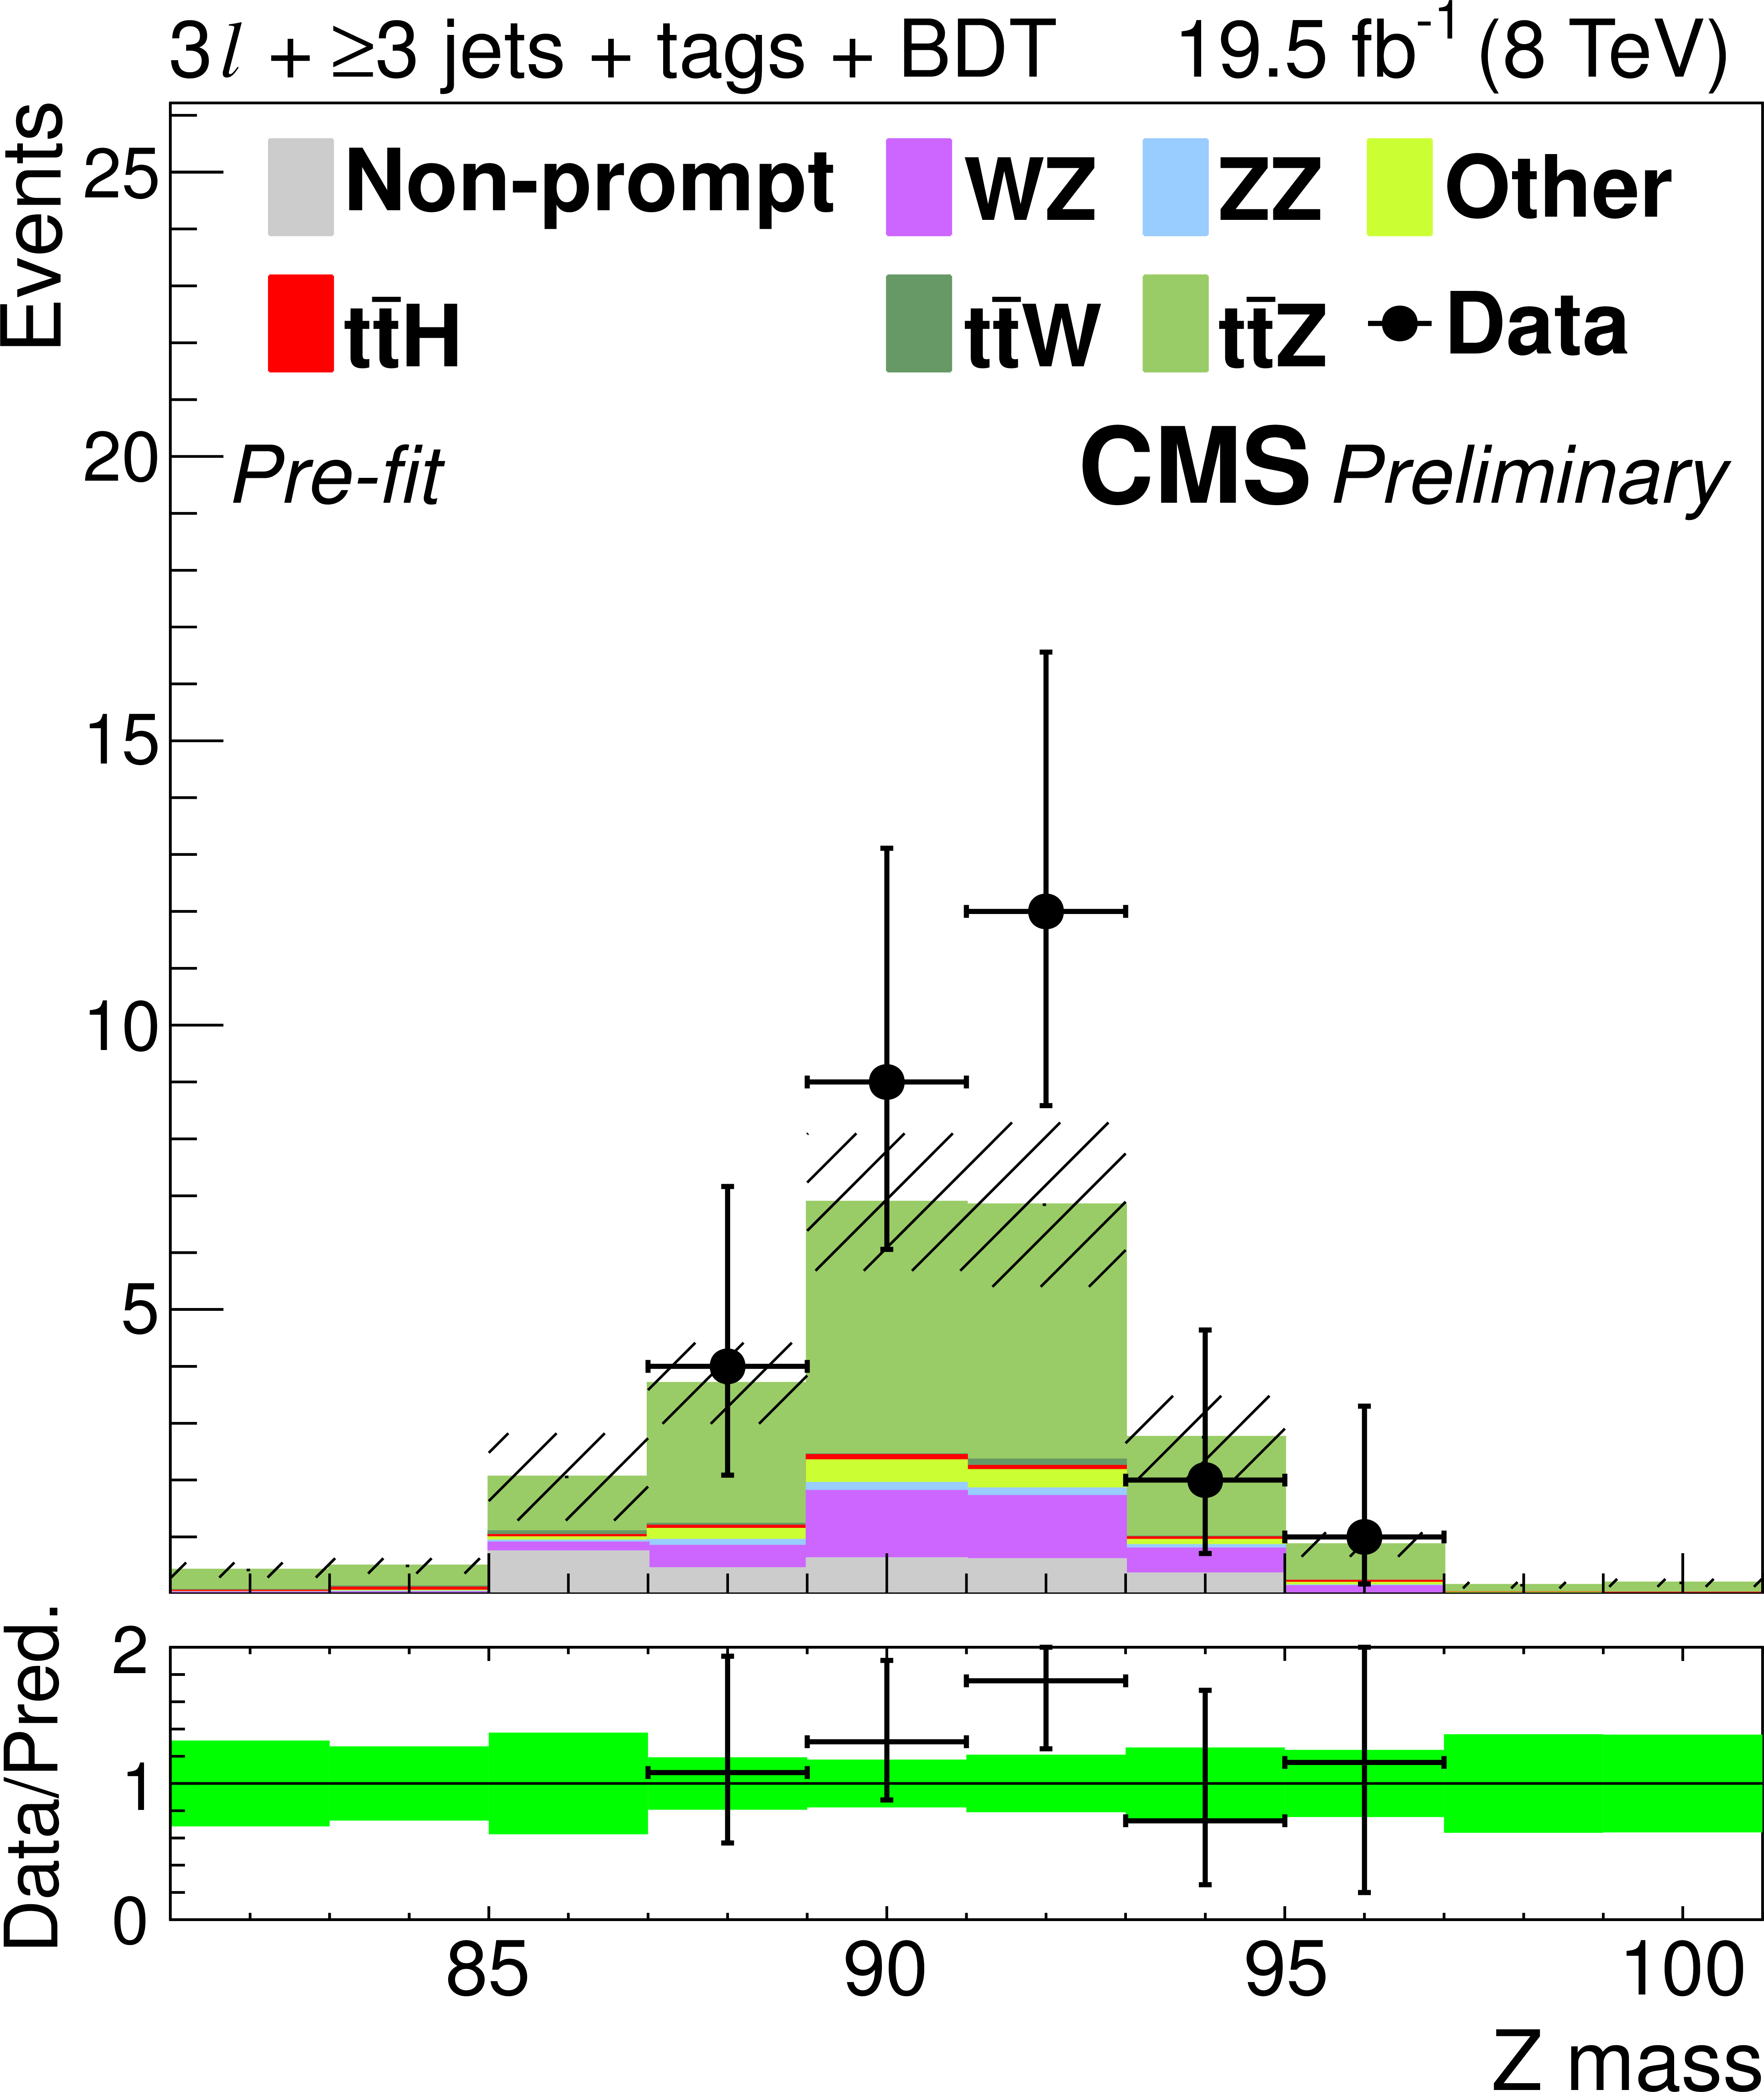
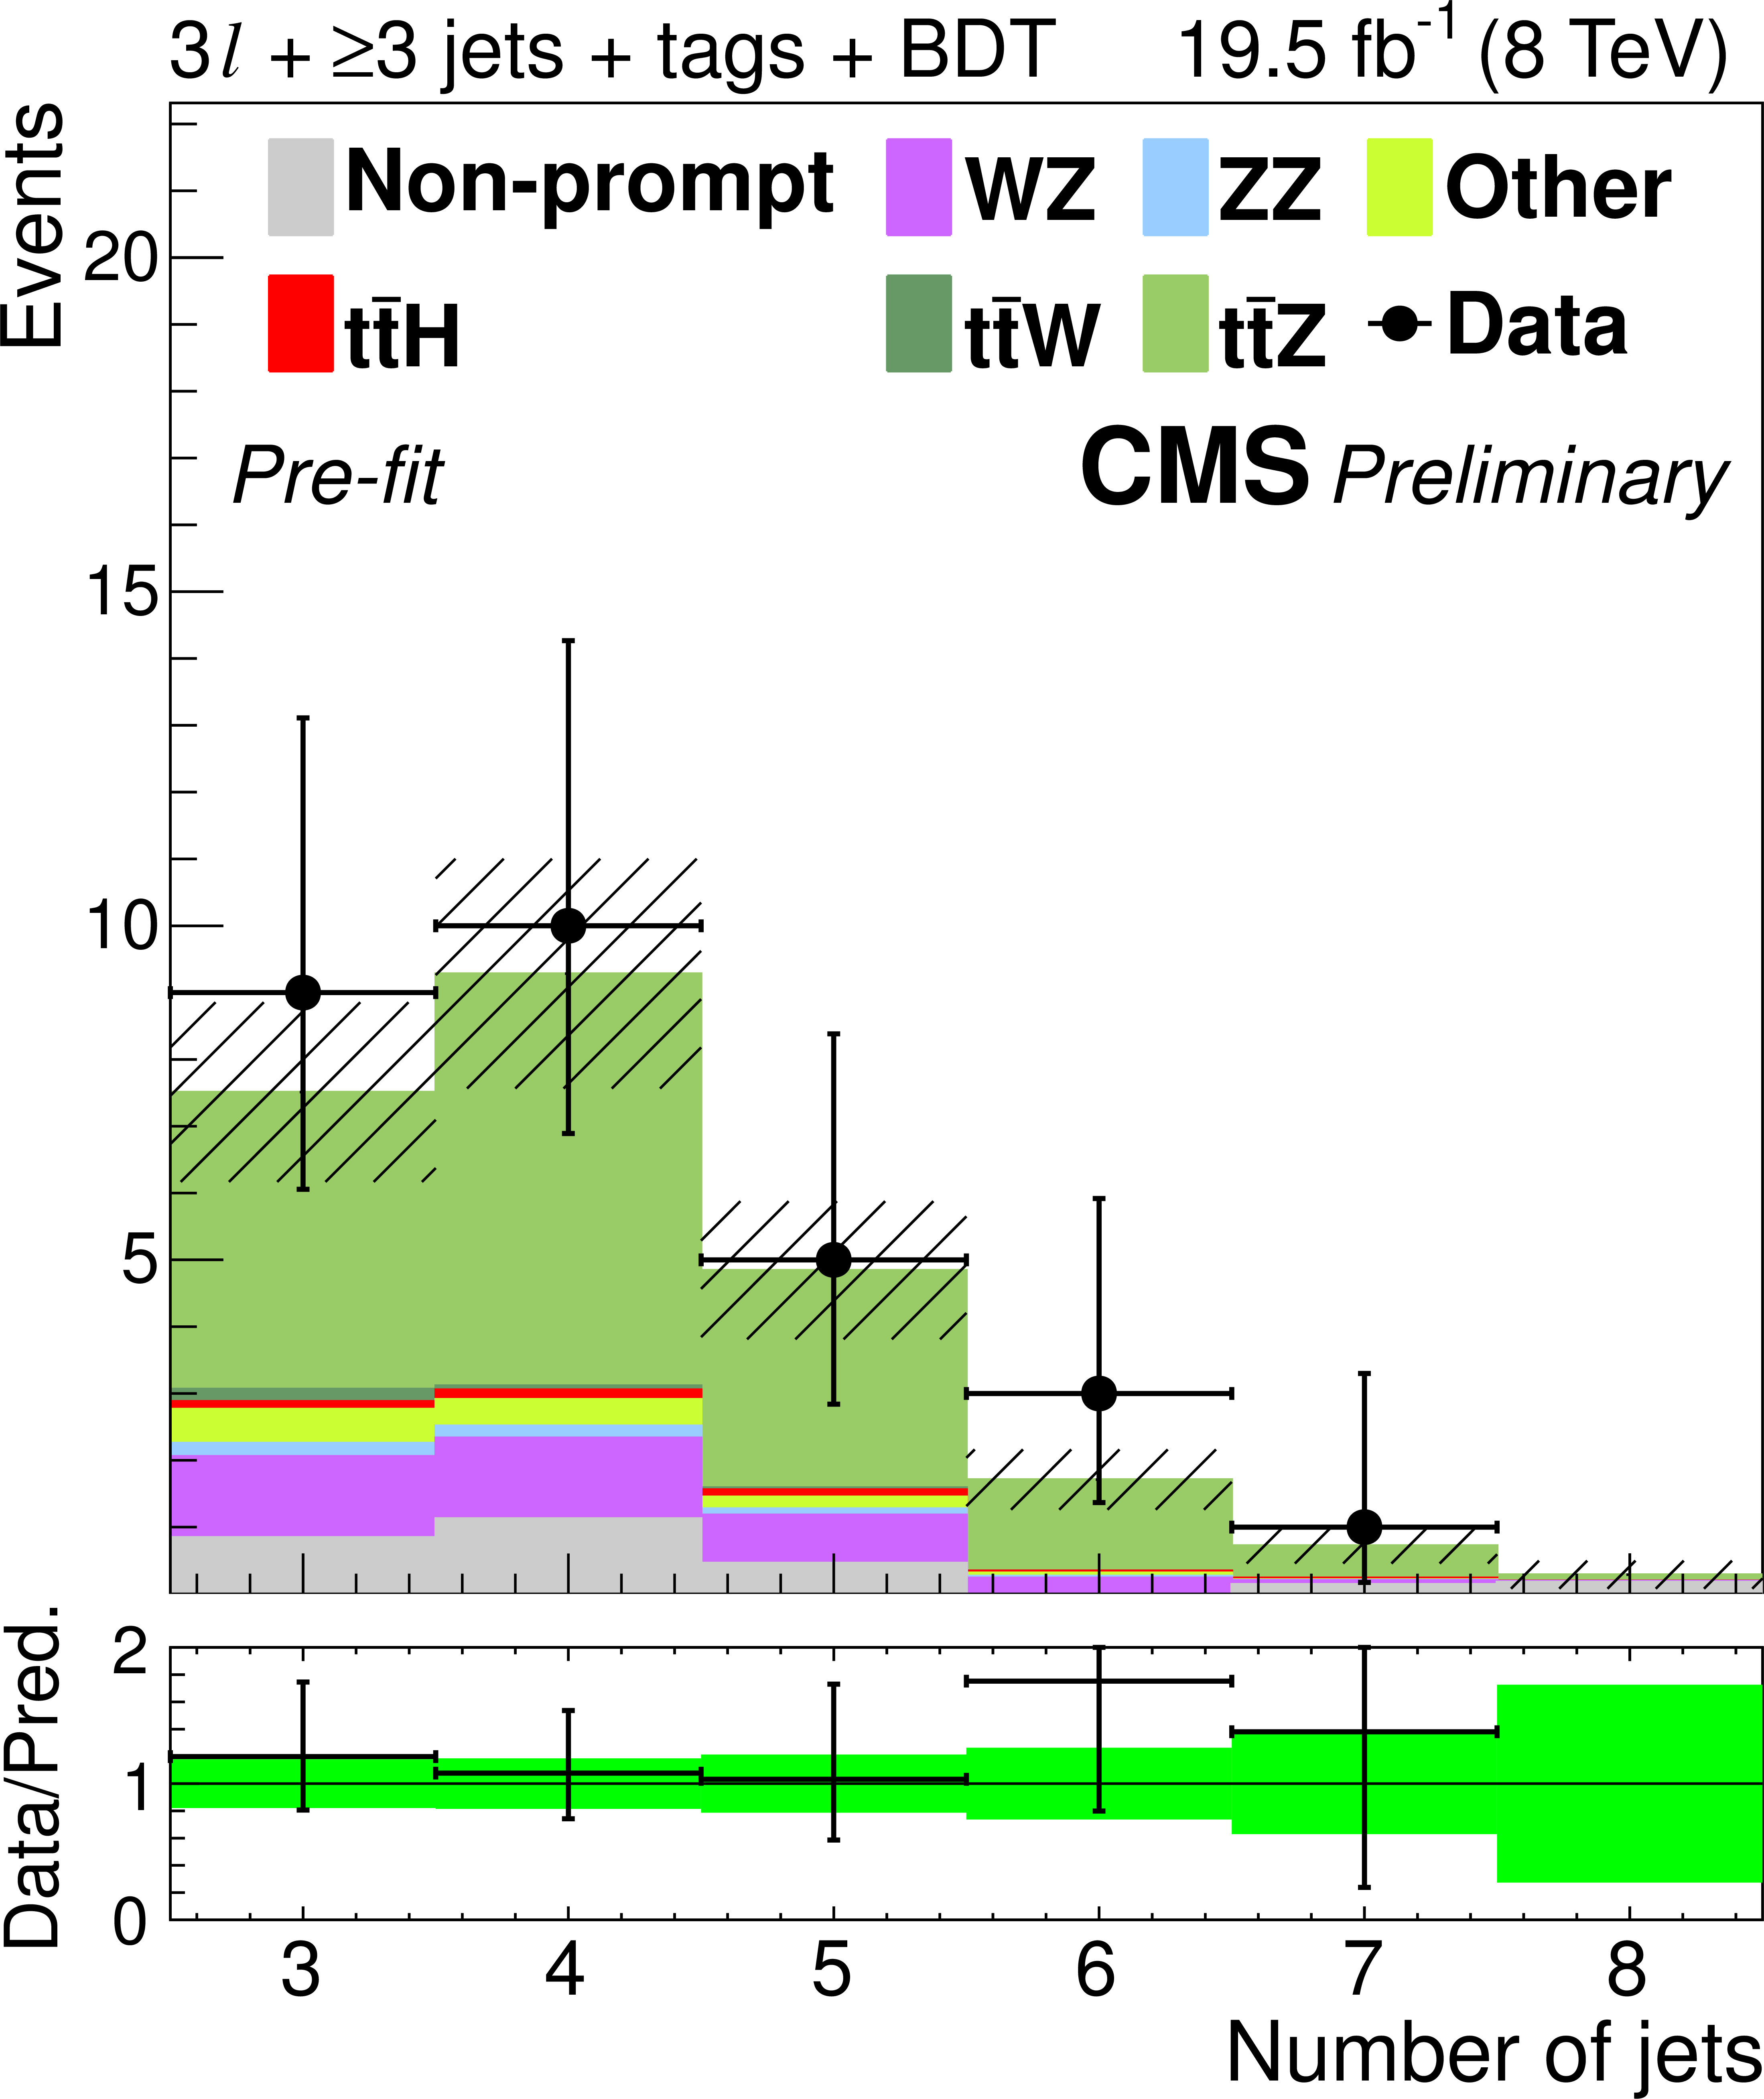
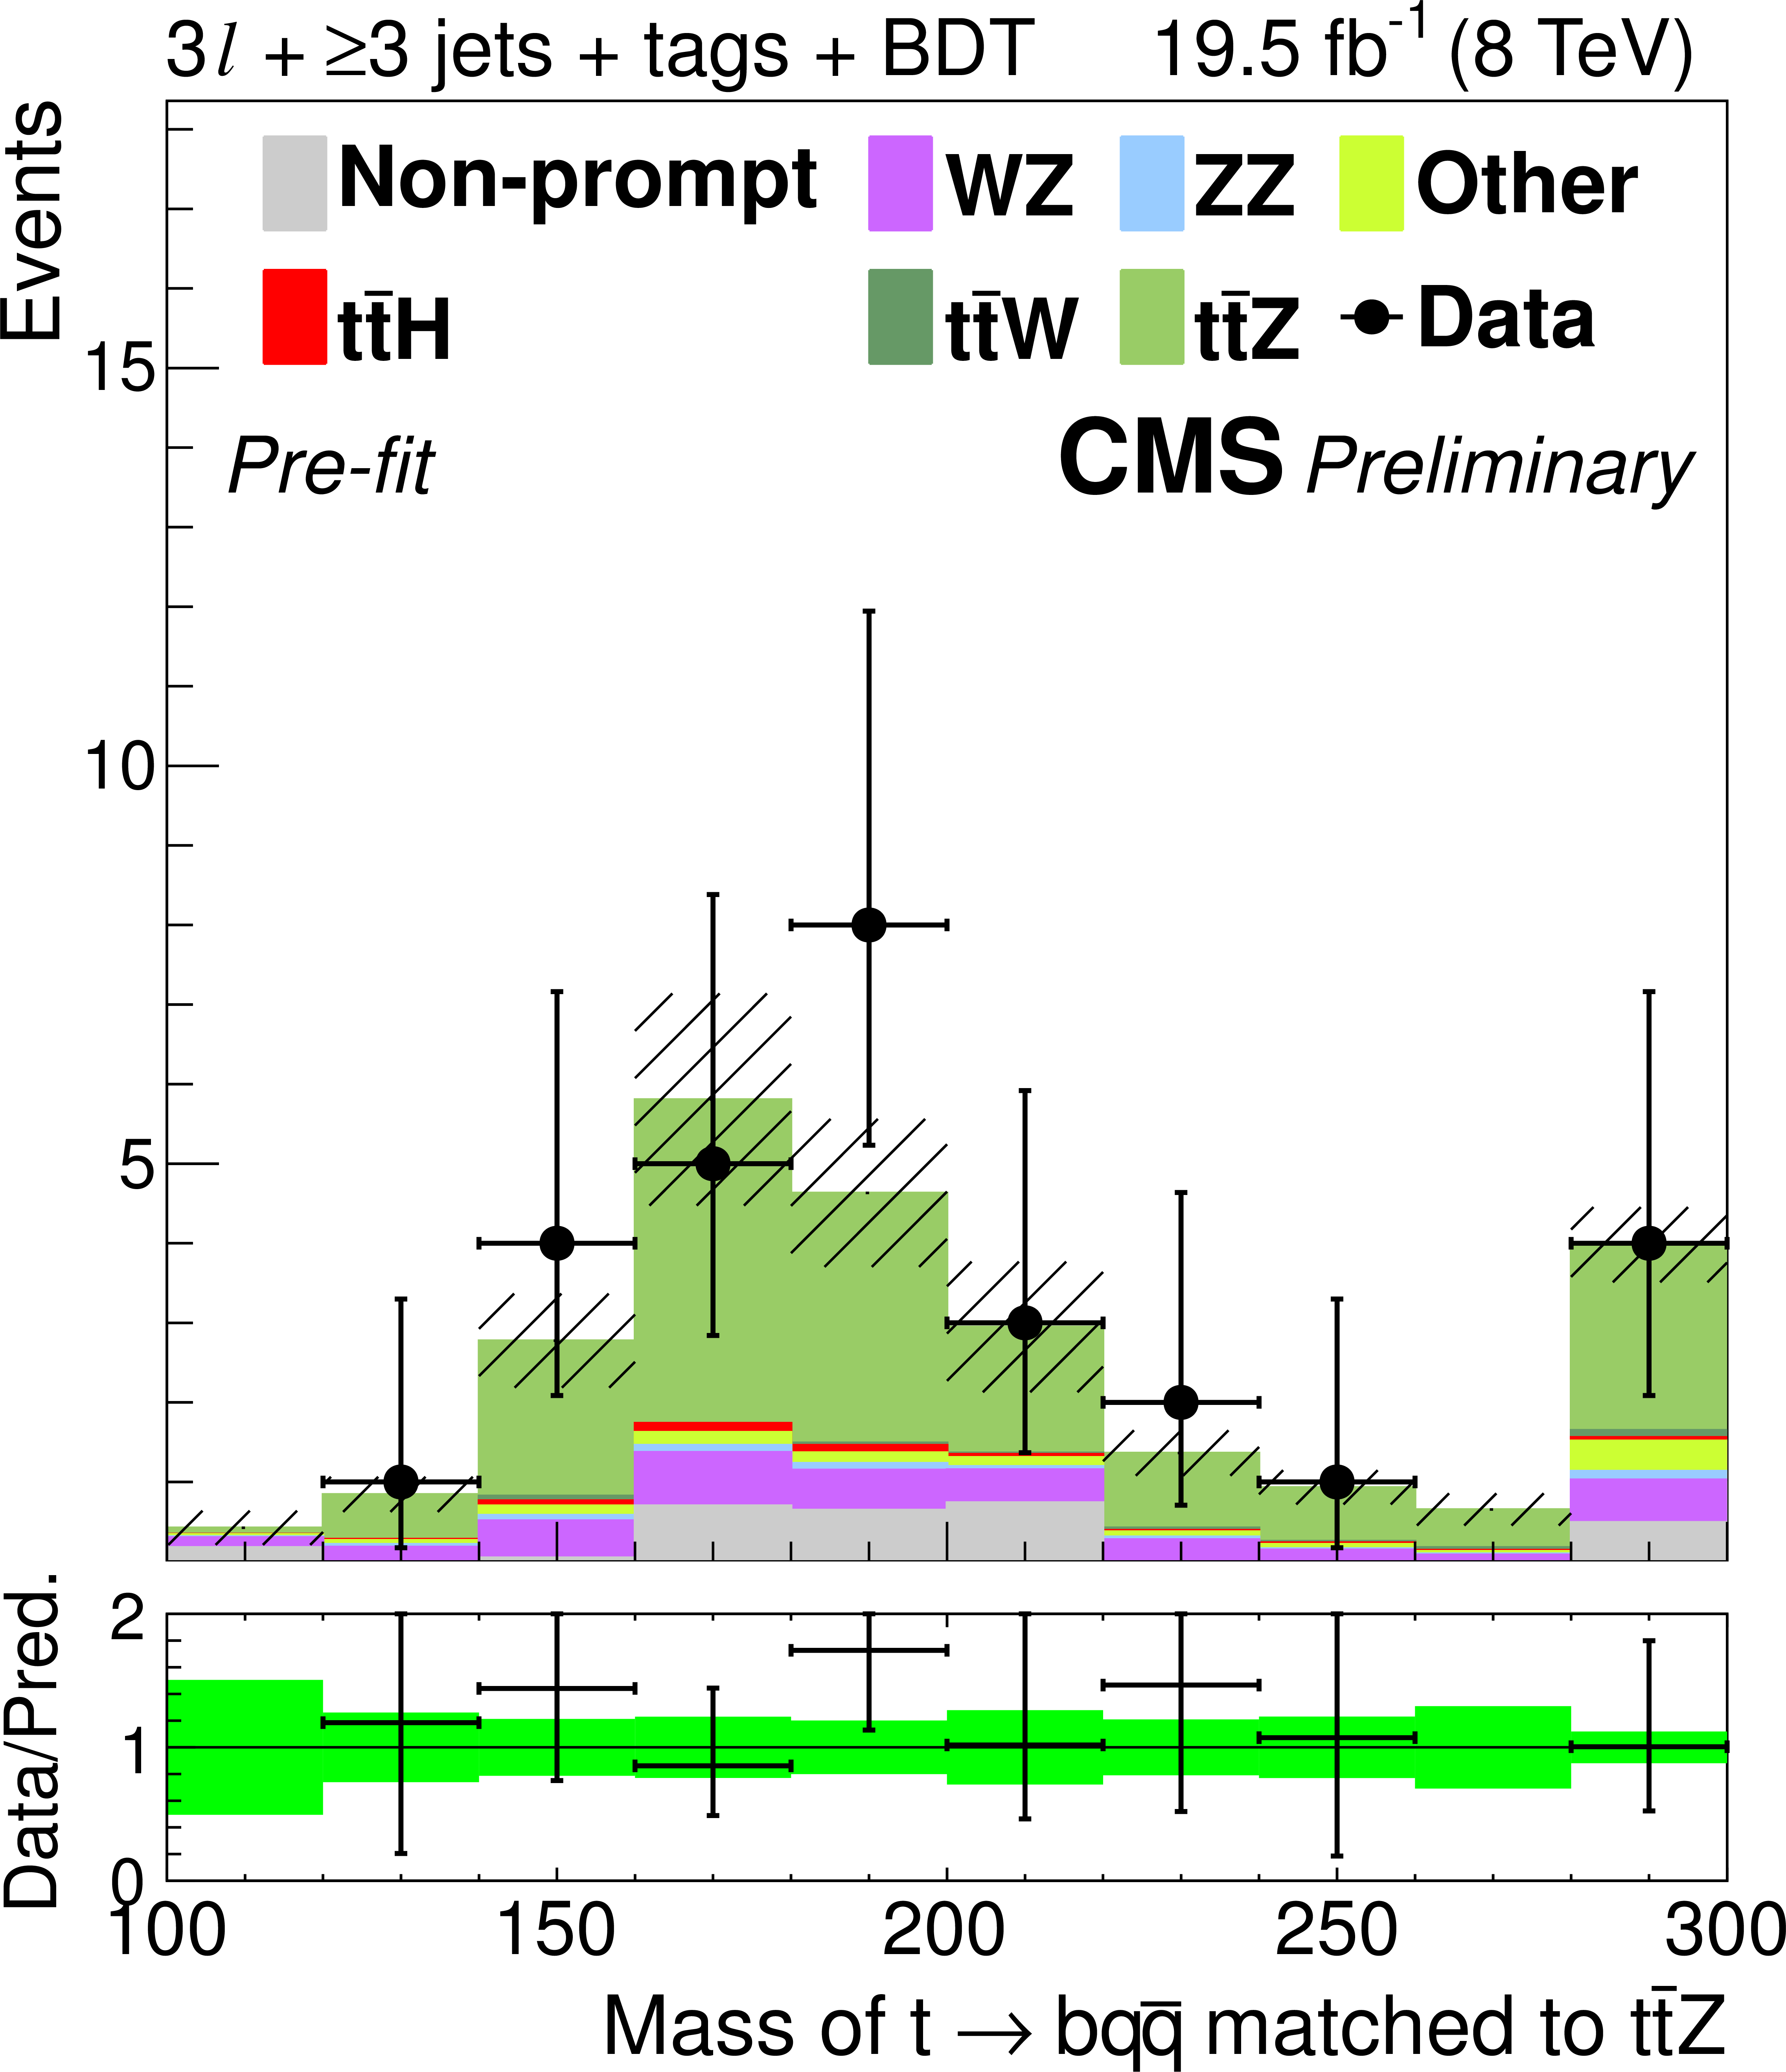
Figure 6-a:
Distributions of the mass and $ {p_{\mathrm {T}}} $ of the lepton pair identified with the Z boson decay, the number of jets and medium b-tagged jets, and the mass of the best fit dijet pair from a W boson decay and trijet system from a top decay. The plots show signal-like events from the 3$\ell $ $ {\mathrm {t}\overline {\mathrm {t}}} {\mathrm {Z}} $ channel (3 jets with BDT $> 0.3$ and $\geq $4 jets with BDT $> -0.2$) before the final fit described in Section Results-SM is performed. The green band in the data-to-prediction ratio plot denotes the 68% CL uncertainty in the signal plus background prediction. ``Other'' includes $ {\mathrm {t}\overline {\mathrm {t}}} \gamma $, $ {\mathrm {t}\overline {\mathrm {t}}} \gamma ^{*}$, $ {\mathrm {t}\overline {\mathrm {t}}} {\mathrm {W}} {\mathrm {W}}$, tb$ {\mathrm {Z}}$, WWW, and WWZ. |
png ; pdf |
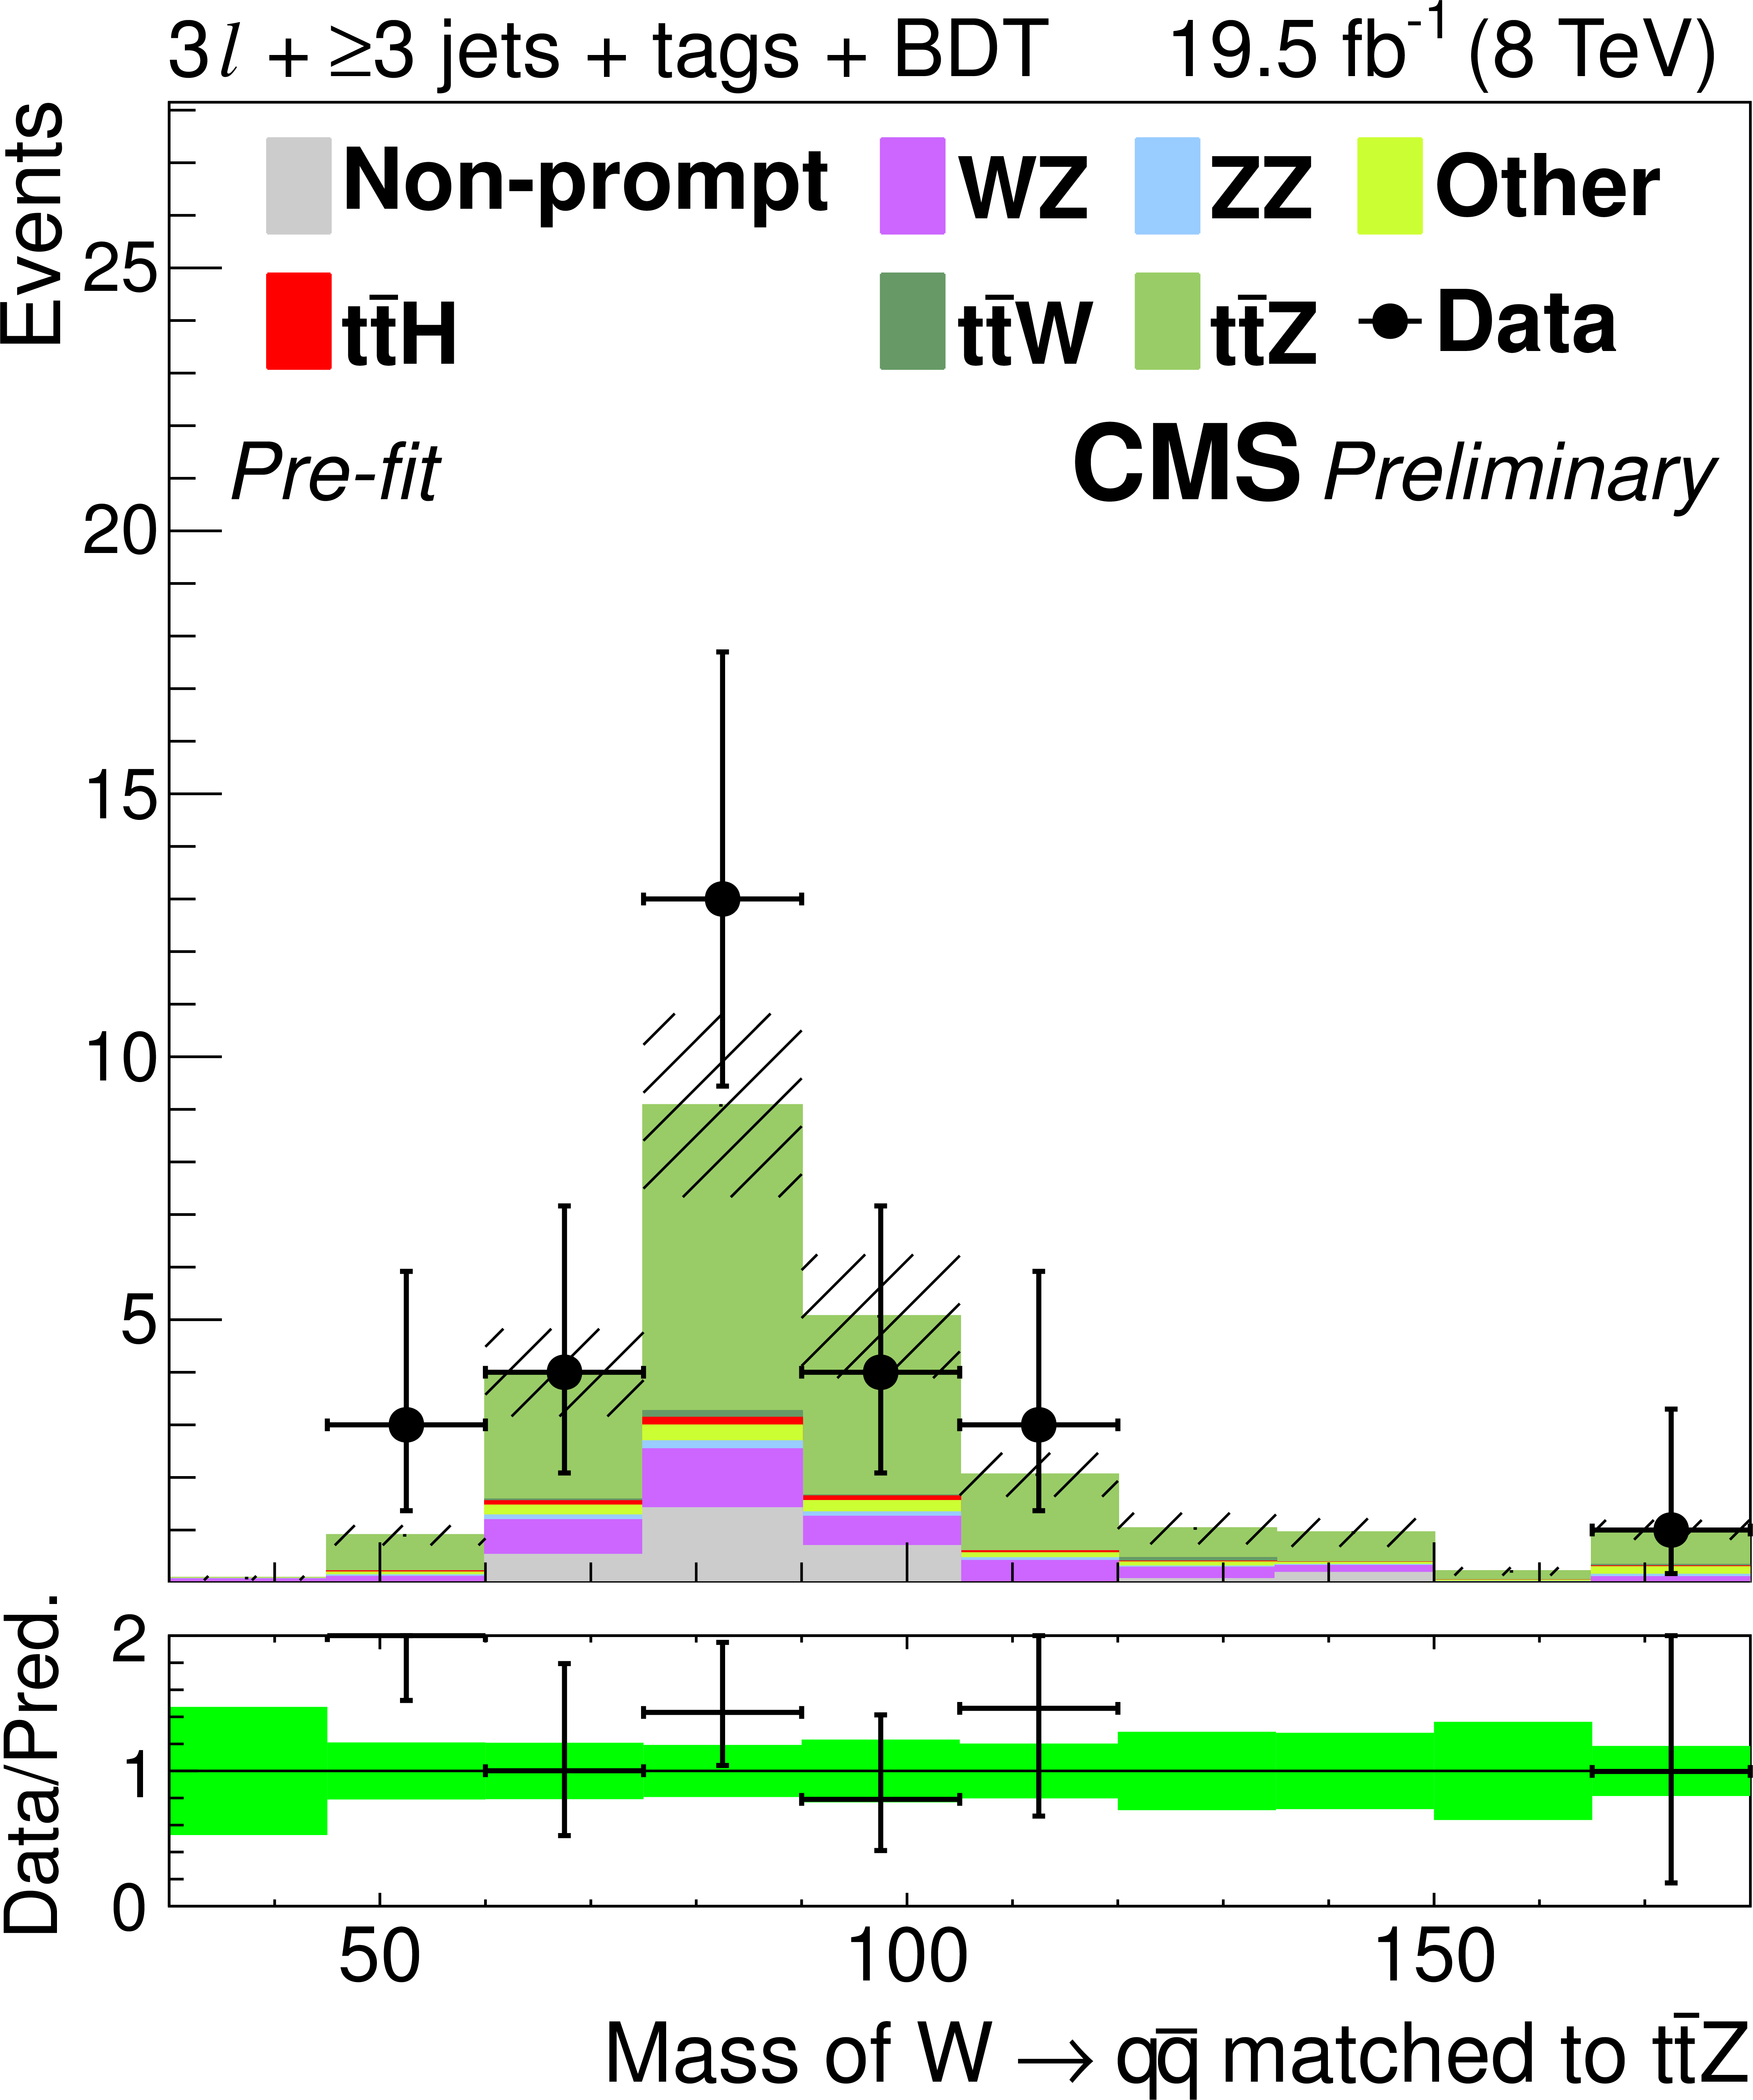
Figure 6-b:
Distributions of the mass and $ {p_{\mathrm {T}}} $ of the lepton pair identified with the Z boson decay, the number of jets and medium b-tagged jets, and the mass of the best fit dijet pair from a W boson decay and trijet system from a top decay. The plots show signal-like events from the 3$\ell $ $ {\mathrm {t}\overline {\mathrm {t}}} {\mathrm {Z}} $ channel (3 jets with BDT $> 0.3$ and $\geq $4 jets with BDT $> -0.2$) before the final fit described in Section Results-SM is performed. The green band in the data-to-prediction ratio plot denotes the 68% CL uncertainty in the signal plus background prediction. ``Other'' includes $ {\mathrm {t}\overline {\mathrm {t}}} \gamma $, $ {\mathrm {t}\overline {\mathrm {t}}} \gamma ^{*}$, $ {\mathrm {t}\overline {\mathrm {t}}} {\mathrm {W}} {\mathrm {W}}$, tb$ {\mathrm {Z}}$, WWW, and WWZ. |
png ; pdf |
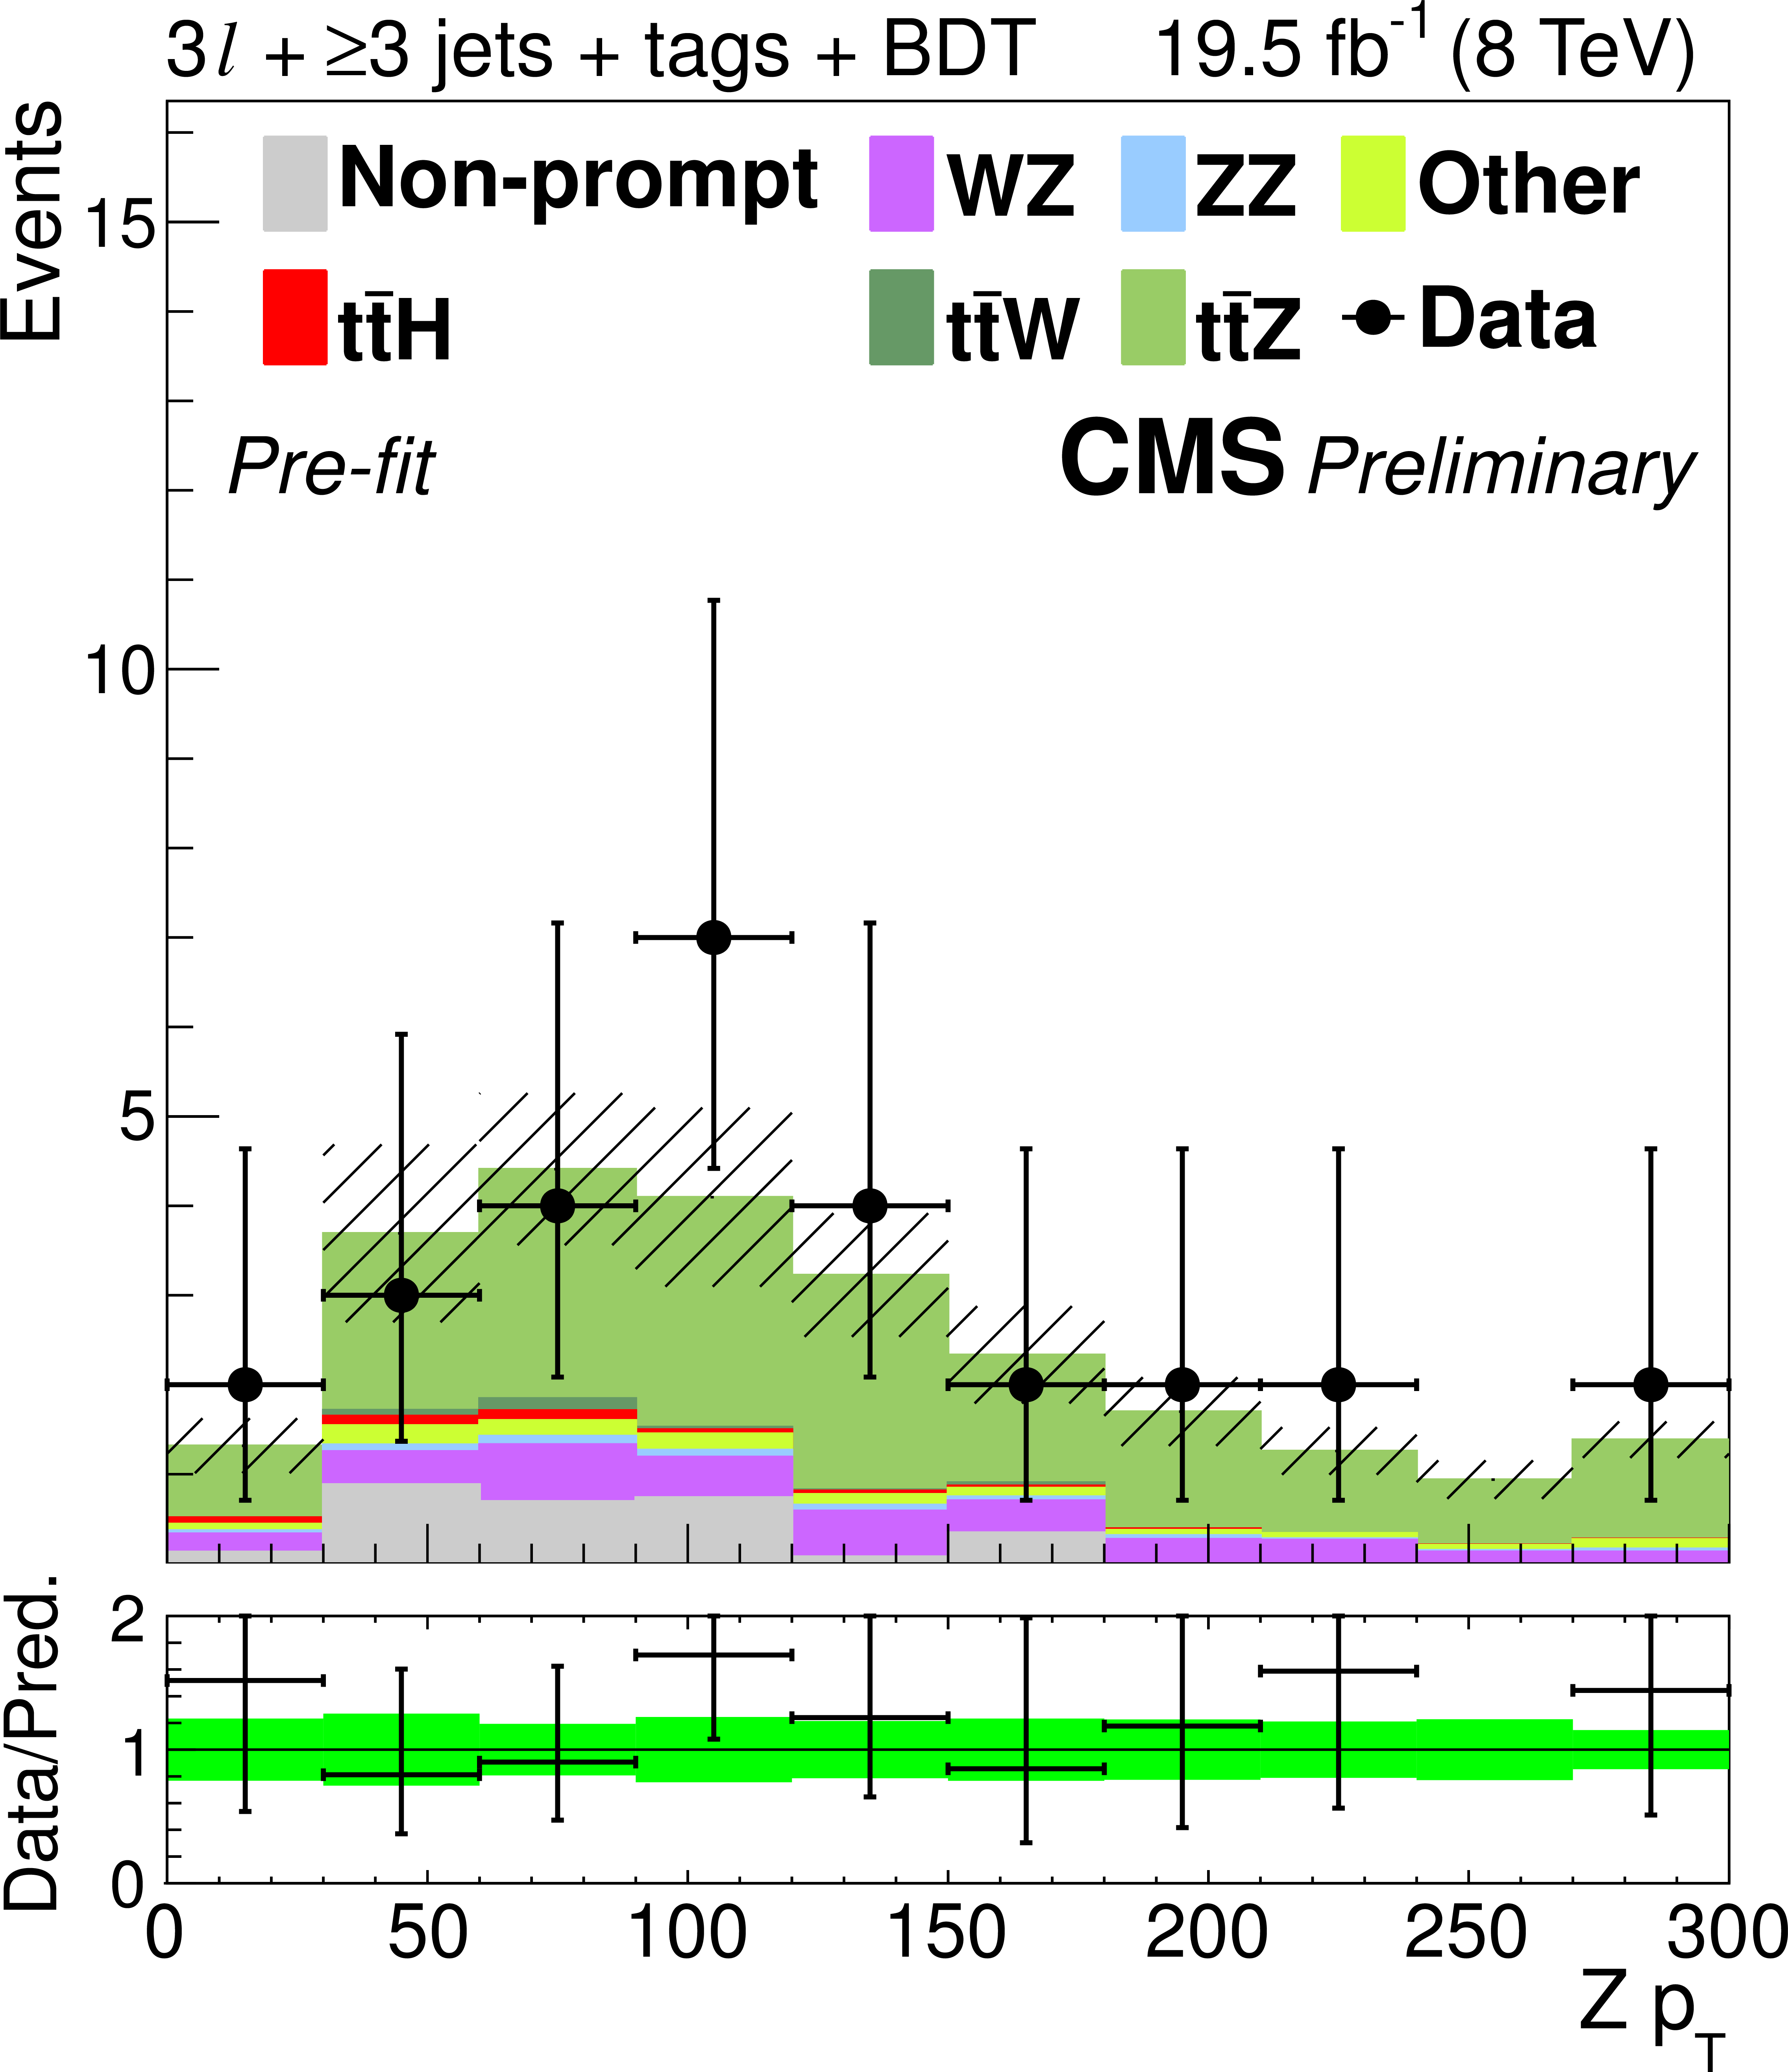
Figure 6-c:
Distributions of the mass and $ {p_{\mathrm {T}}} $ of the lepton pair identified with the Z boson decay, the number of jets and medium b-tagged jets, and the mass of the best fit dijet pair from a W boson decay and trijet system from a top decay. The plots show signal-like events from the 3$\ell $ $ {\mathrm {t}\overline {\mathrm {t}}} {\mathrm {Z}} $ channel (3 jets with BDT $> 0.3$ and $\geq $4 jets with BDT $> -0.2$) before the final fit described in Section Results-SM is performed. The green band in the data-to-prediction ratio plot denotes the 68% CL uncertainty in the signal plus background prediction. ``Other'' includes $ {\mathrm {t}\overline {\mathrm {t}}} \gamma $, $ {\mathrm {t}\overline {\mathrm {t}}} \gamma ^{*}$, $ {\mathrm {t}\overline {\mathrm {t}}} {\mathrm {W}} {\mathrm {W}}$, tb$ {\mathrm {Z}}$, WWW, and WWZ. |
png ; pdf |
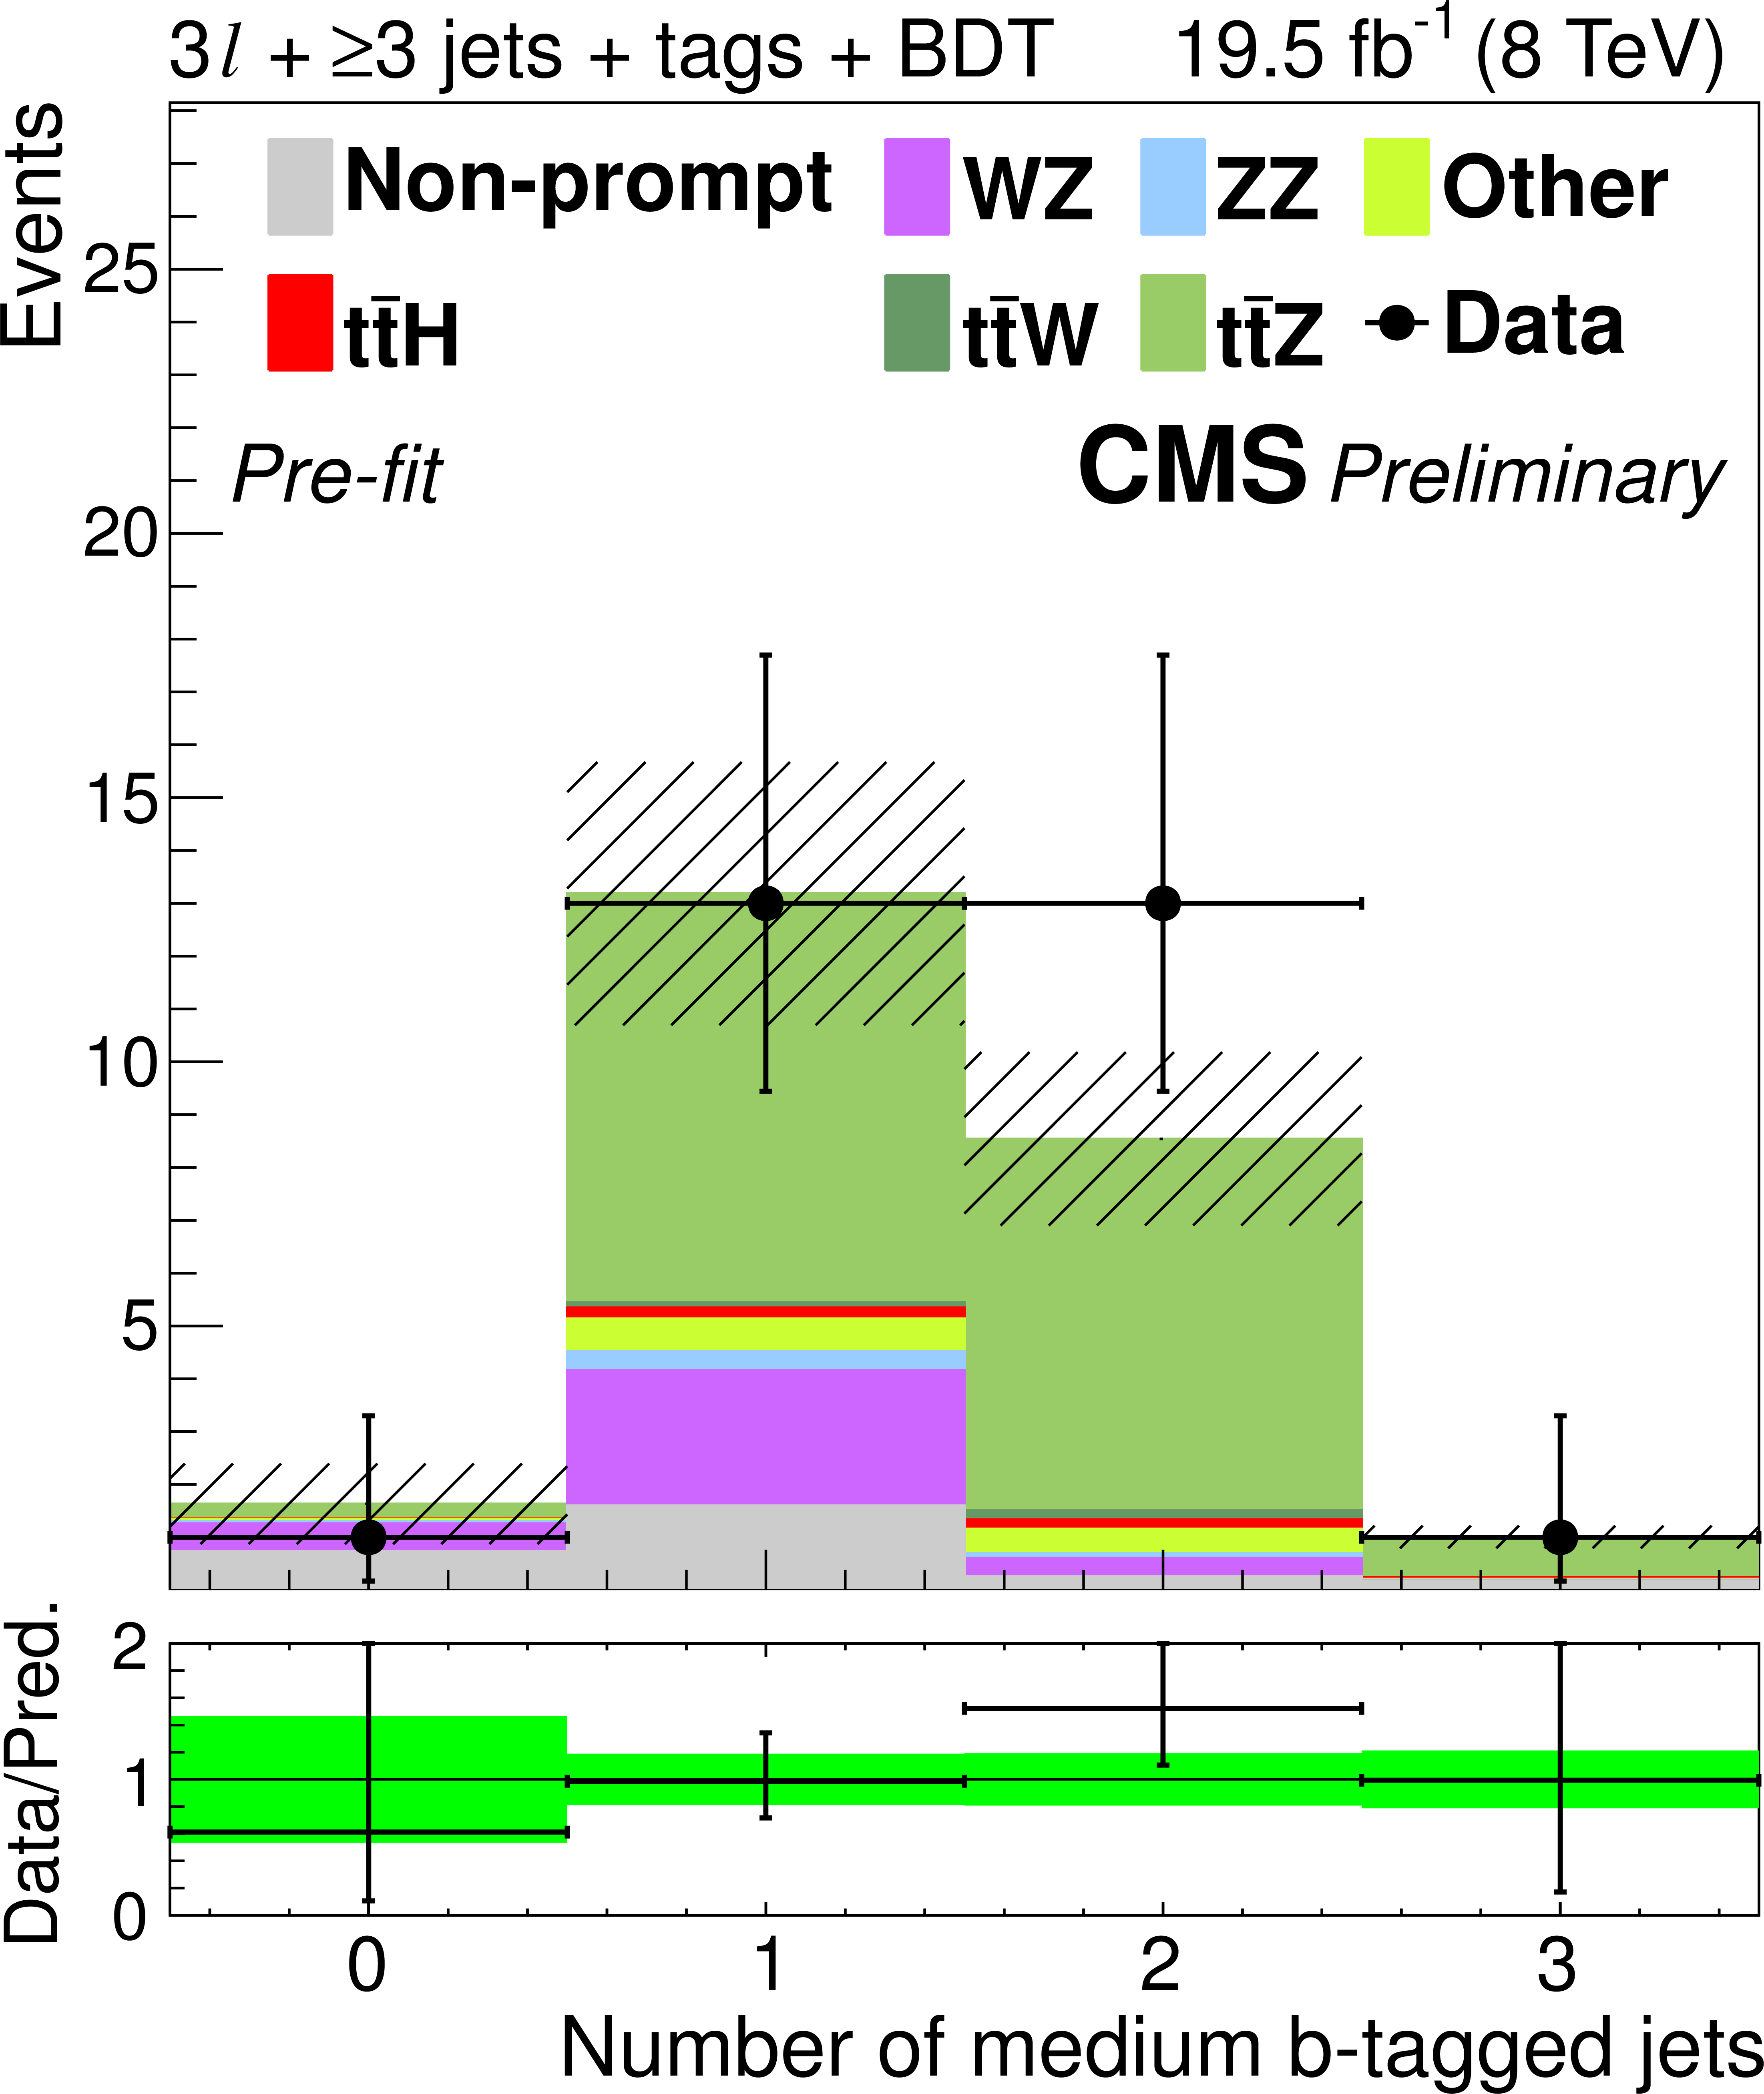
Figure 6-d:
Distributions of the mass and $ {p_{\mathrm {T}}} $ of the lepton pair identified with the Z boson decay, the number of jets and medium b-tagged jets, and the mass of the best fit dijet pair from a W boson decay and trijet system from a top decay. The plots show signal-like events from the 3$\ell $ $ {\mathrm {t}\overline {\mathrm {t}}} {\mathrm {Z}} $ channel (3 jets with BDT $> 0.3$ and $\geq $4 jets with BDT $> -0.2$) before the final fit described in Section Results-SM is performed. The green band in the data-to-prediction ratio plot denotes the 68% CL uncertainty in the signal plus background prediction. ``Other'' includes $ {\mathrm {t}\overline {\mathrm {t}}} \gamma $, $ {\mathrm {t}\overline {\mathrm {t}}} \gamma ^{*}$, $ {\mathrm {t}\overline {\mathrm {t}}} {\mathrm {W}} {\mathrm {W}}$, tb$ {\mathrm {Z}}$, WWW, and WWZ. |
png ; pdf |
Figure 6-e:
Distributions of the mass and $ {p_{\mathrm {T}}} $ of the lepton pair identified with the Z boson decay, the number of jets and medium b-tagged jets, and the mass of the best fit dijet pair from a W boson decay and trijet system from a top decay. The plots show signal-like events from the 3$\ell $ $ {\mathrm {t}\overline {\mathrm {t}}} {\mathrm {Z}} $ channel (3 jets with BDT $> 0.3$ and $\geq $4 jets with BDT $> -0.2$) before the final fit described in Section Results-SM is performed. The green band in the data-to-prediction ratio plot denotes the 68% CL uncertainty in the signal plus background prediction. ``Other'' includes $ {\mathrm {t}\overline {\mathrm {t}}} \gamma $, $ {\mathrm {t}\overline {\mathrm {t}}} \gamma ^{*}$, $ {\mathrm {t}\overline {\mathrm {t}}} {\mathrm {W}} {\mathrm {W}}$, tb$ {\mathrm {Z}}$, WWW, and WWZ. |
png ; pdf |
Figure 6-f:
Distributions of the mass and $ {p_{\mathrm {T}}} $ of the lepton pair identified with the Z boson decay, the number of jets and medium b-tagged jets, and the mass of the best fit dijet pair from a W boson decay and trijet system from a top decay. The plots show signal-like events from the 3$\ell $ $ {\mathrm {t}\overline {\mathrm {t}}} {\mathrm {Z}} $ channel (3 jets with BDT $> 0.3$ and $\geq $4 jets with BDT $> -0.2$) before the final fit described in Section Results-SM is performed. The green band in the data-to-prediction ratio plot denotes the 68% CL uncertainty in the signal plus background prediction. ``Other'' includes $ {\mathrm {t}\overline {\mathrm {t}}} \gamma $, $ {\mathrm {t}\overline {\mathrm {t}}} \gamma ^{*}$, $ {\mathrm {t}\overline {\mathrm {t}}} {\mathrm {W}} {\mathrm {W}}$, tb$ {\mathrm {Z}}$, WWW, and WWZ. |
png ; pdf |
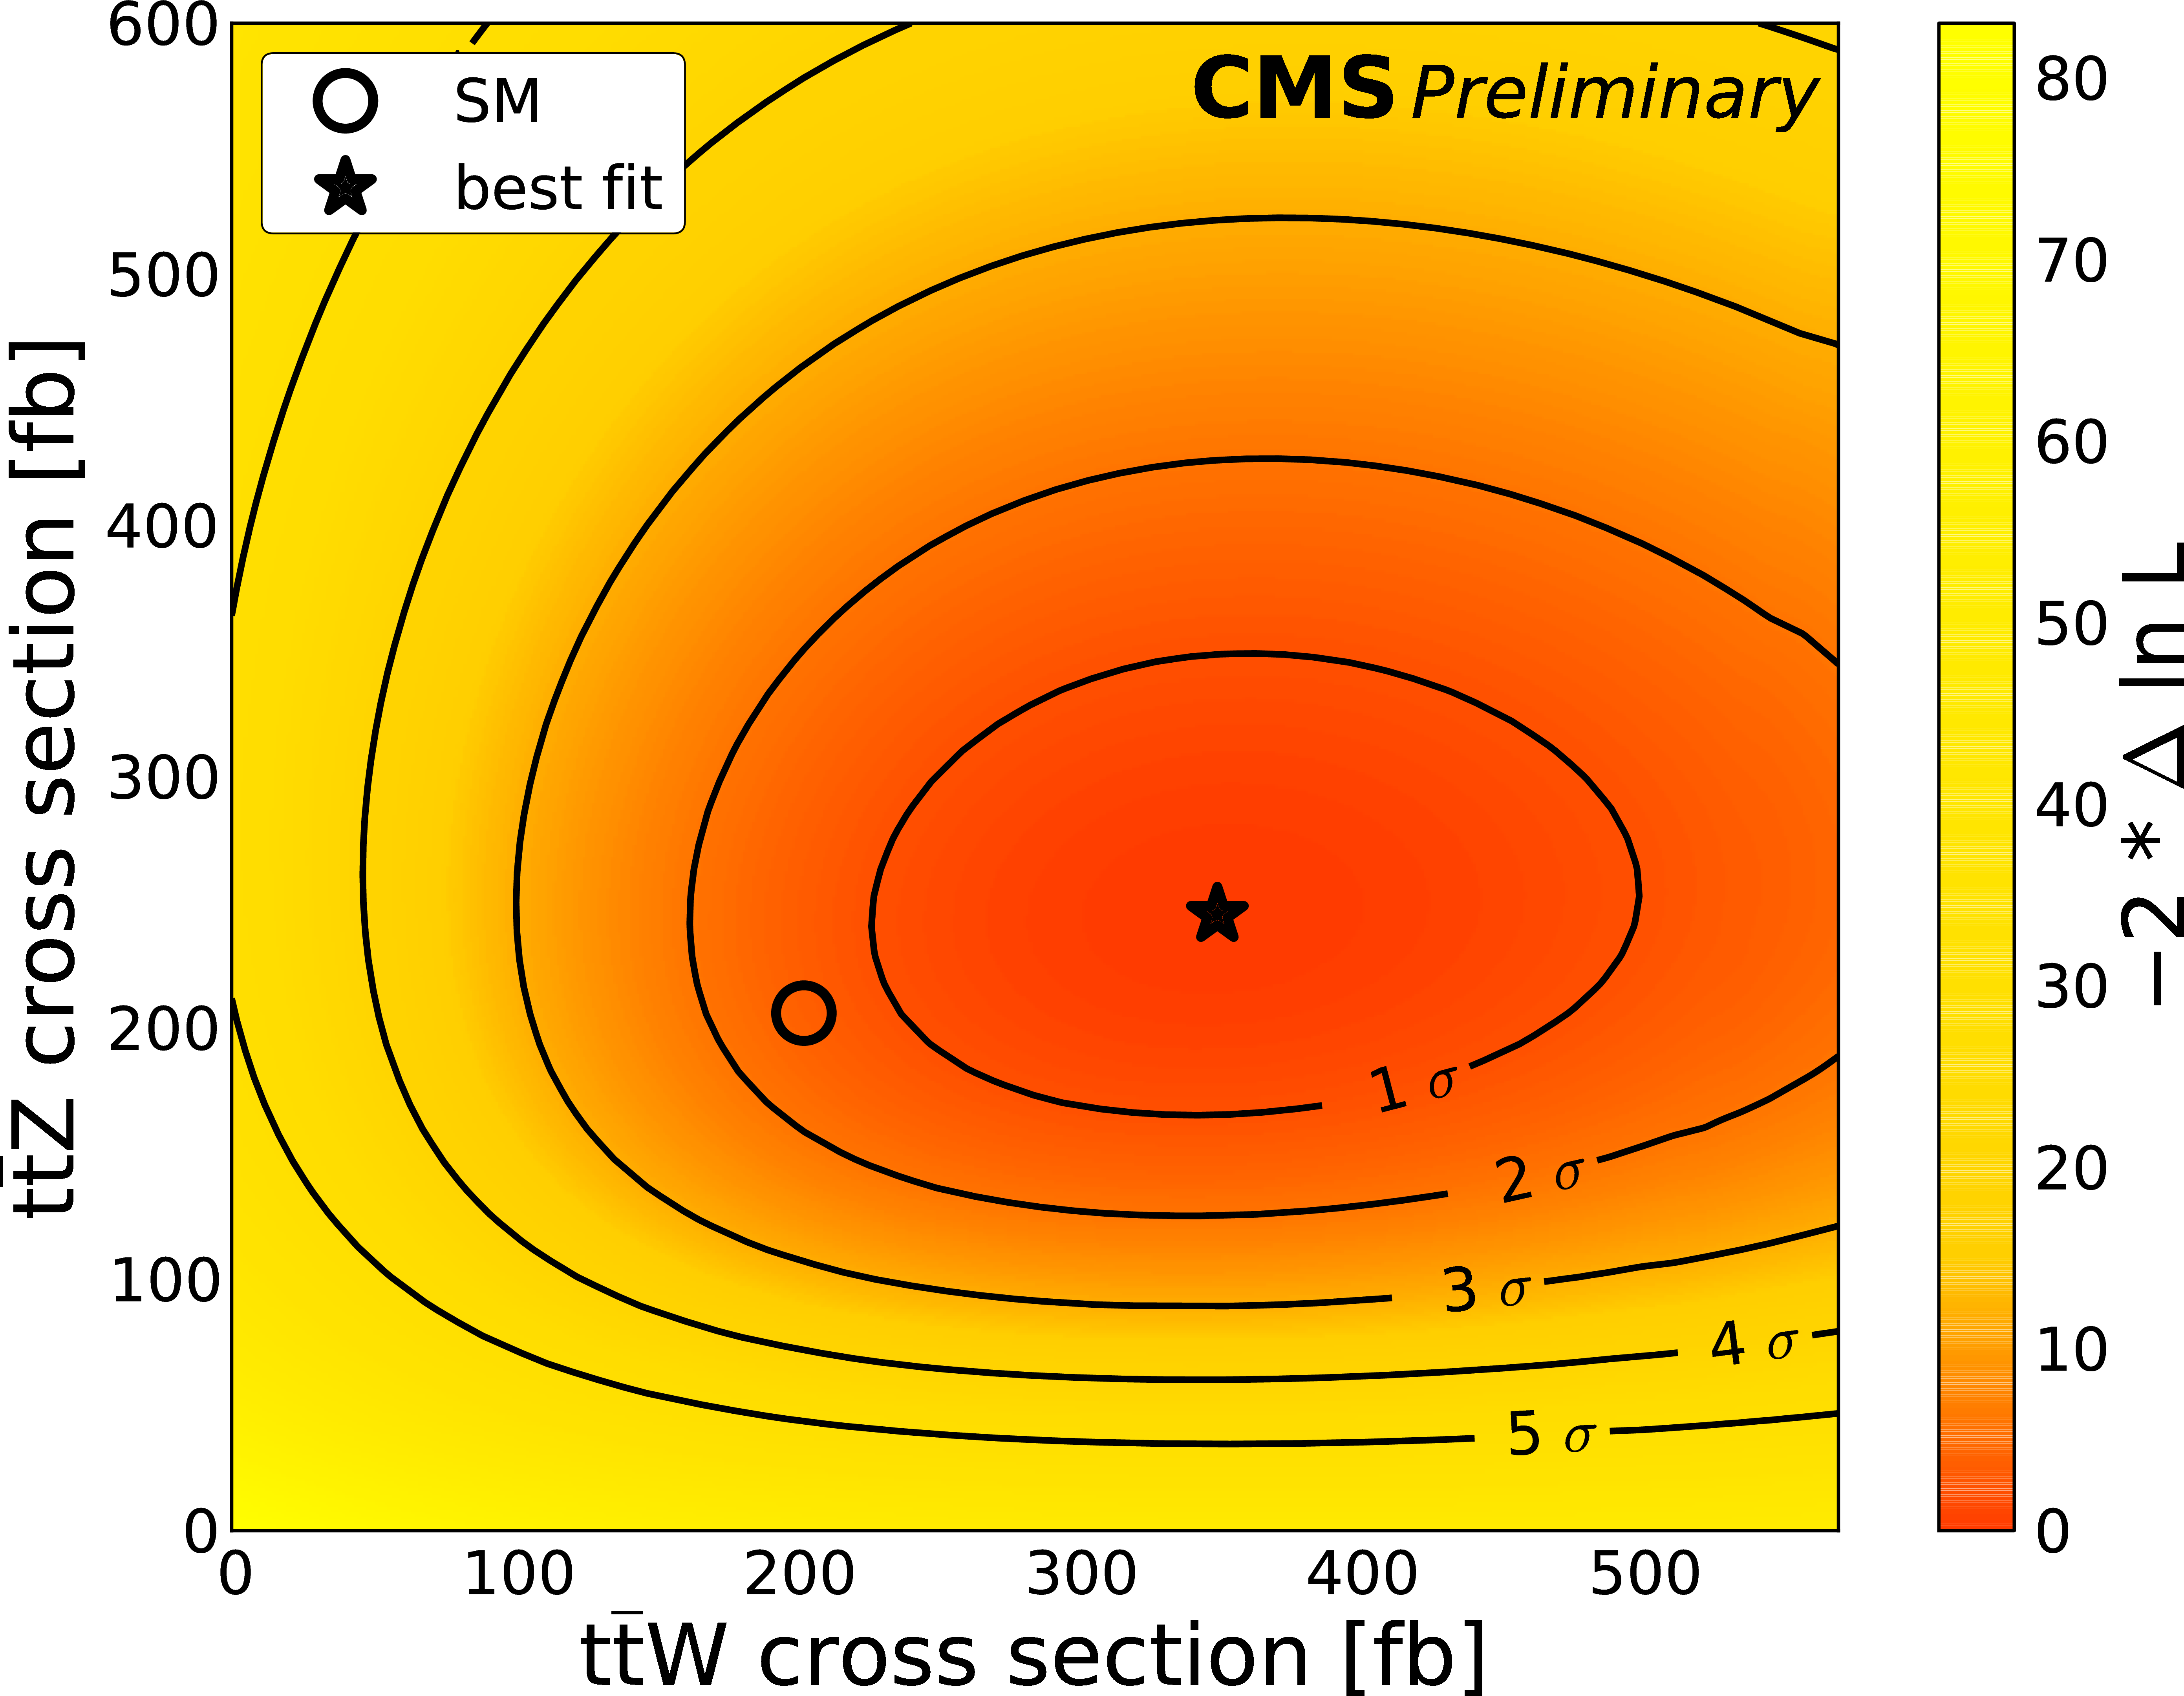
Figure 7:
Profile likelihood as a function of $\sigma ( {\mathrm {t}\overline {\mathrm {t}}} {\mathrm {W}})$ and $\sigma ( {\mathrm {t}\overline {\mathrm {t}}} {\mathrm {Z}} )$. Lines denote 1, 2, 3, 4, and 5\tmspace +\thinmuskip {.1667em}$\sigma $ confidence levels. |
png ; pdf |
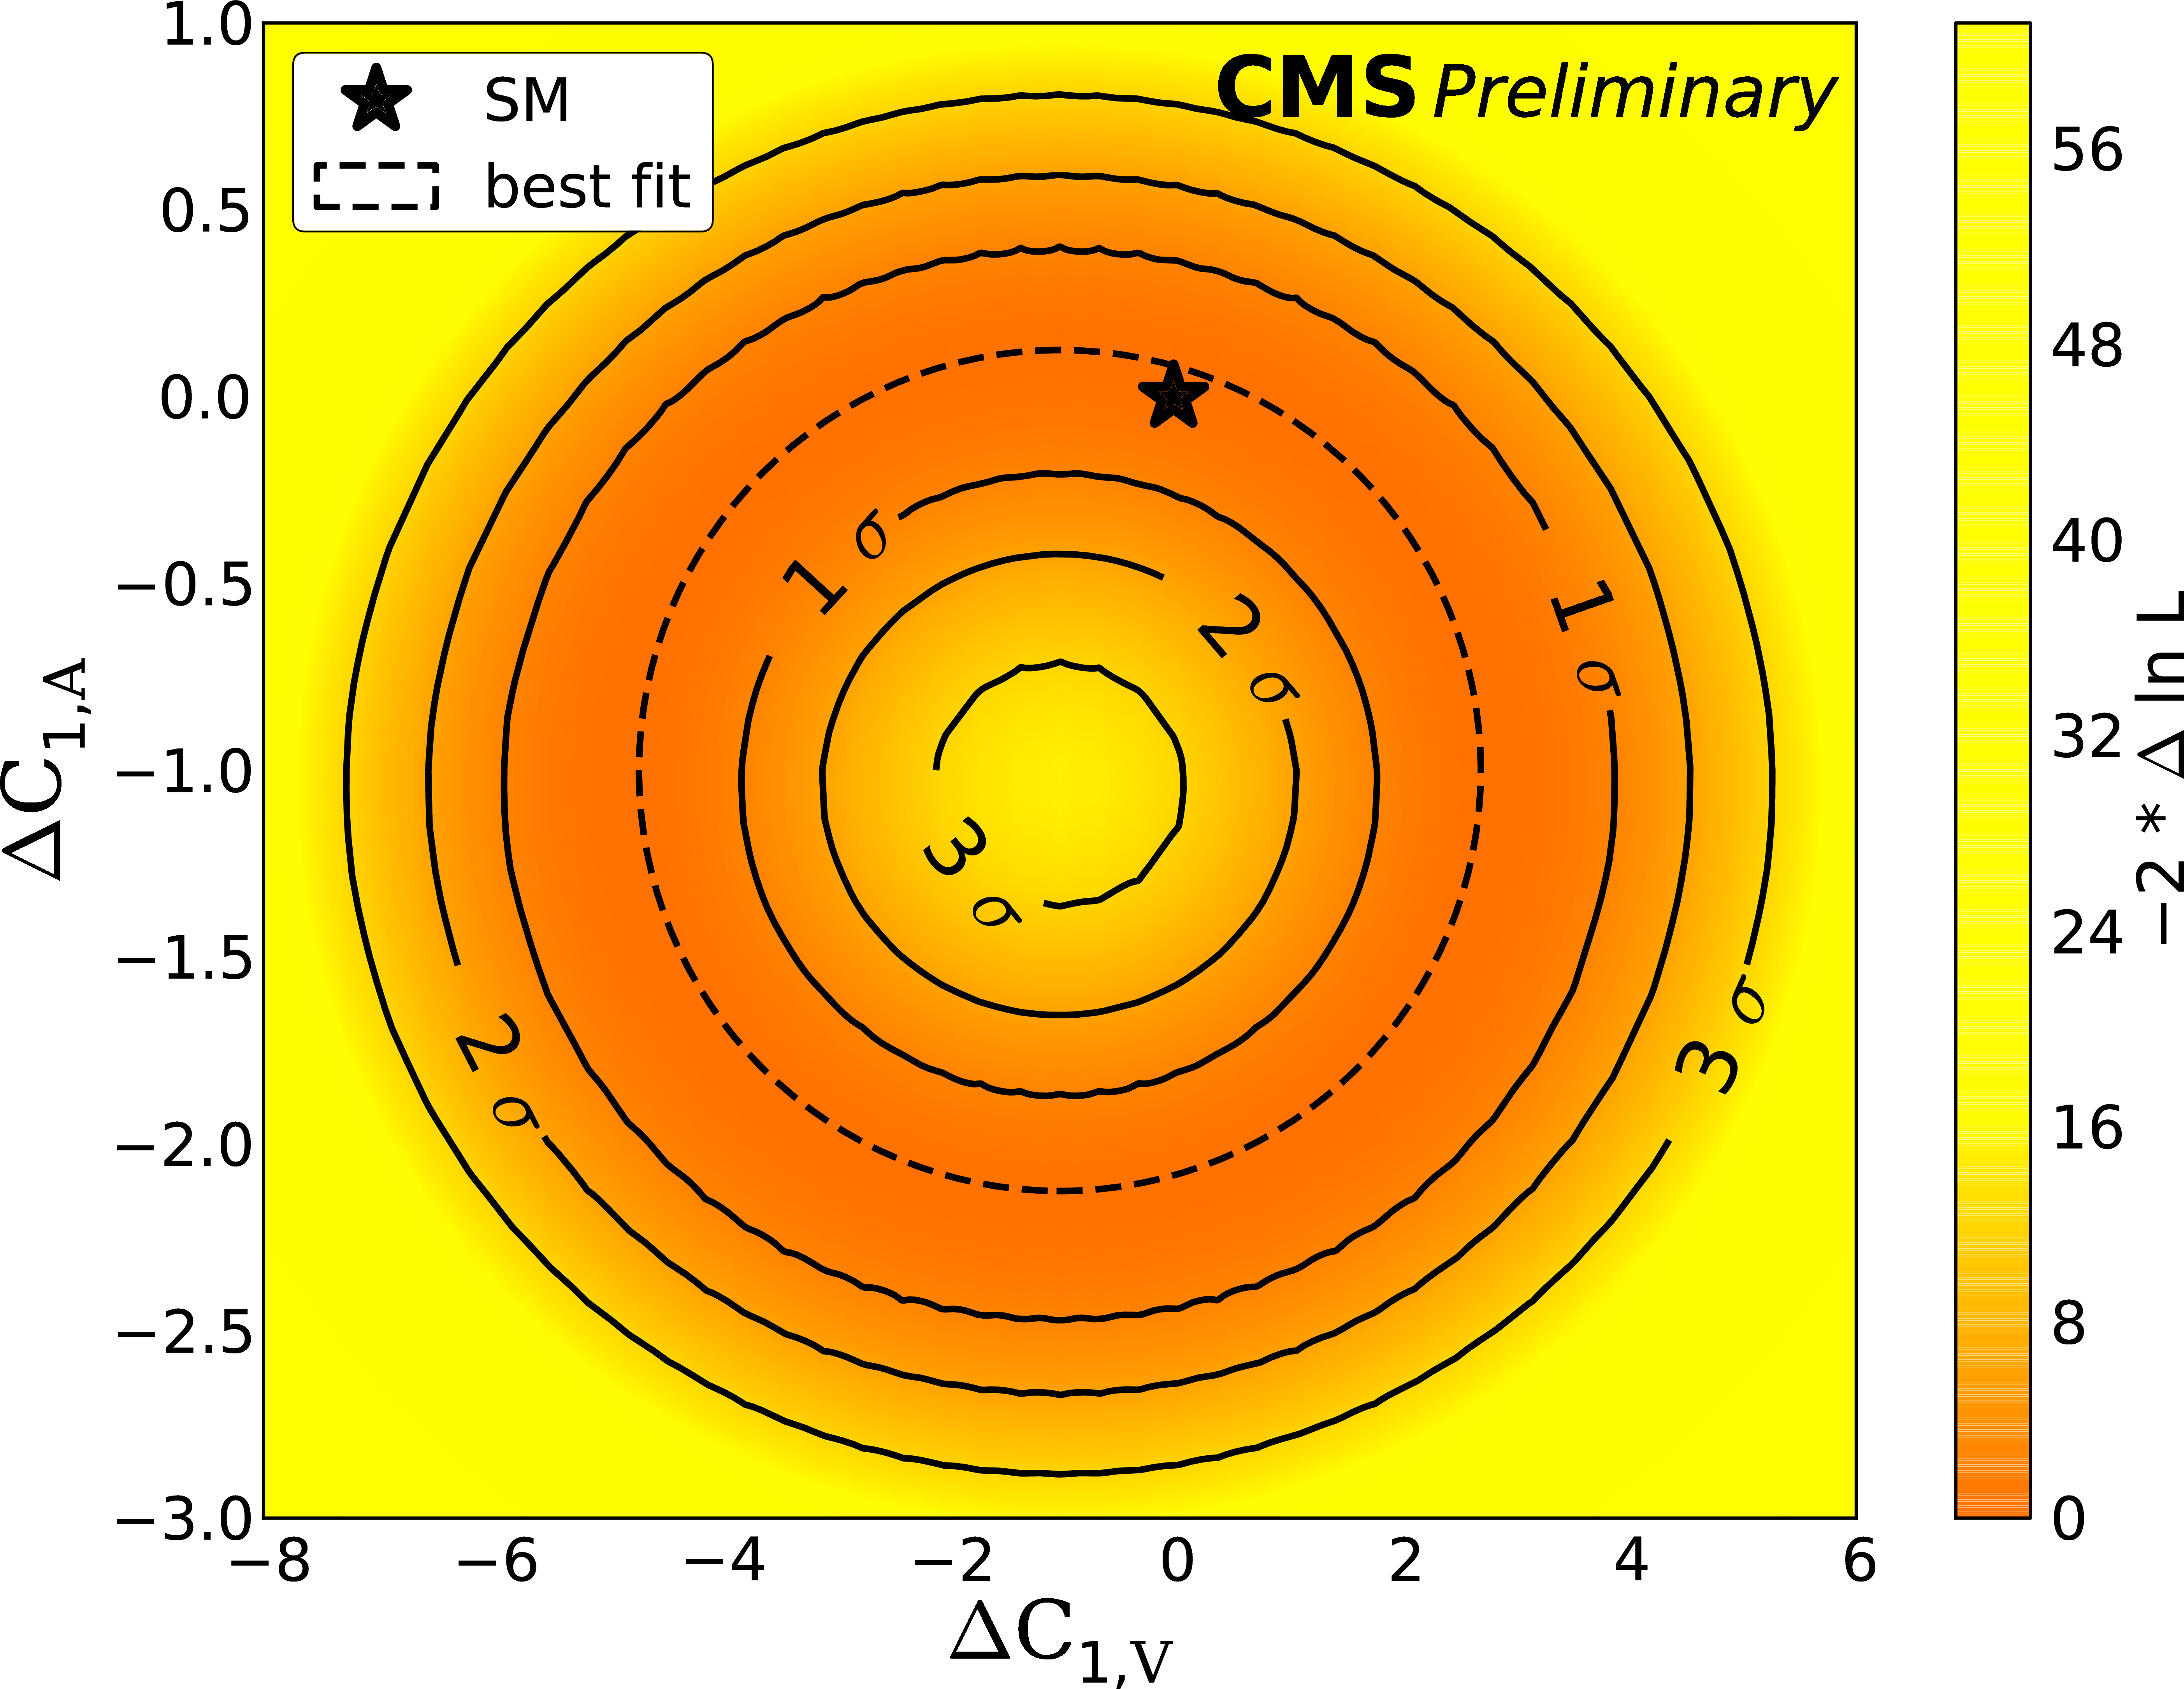
Figure 8:
Difference between the profile likelihood and the best fit profile likelihood functions for the relative vector and axial components of the top-Z coupling. Contours corresponding to the best fit and the 1\tmspace +\thinmuskip {.1667em}$\sigma $, 2\tmspace +\thinmuskip {.1667em}$\sigma $, and 3\tmspace +\thinmuskip {.1667em}$\sigma $ CLs are shown in lines. |
png ; pdf |
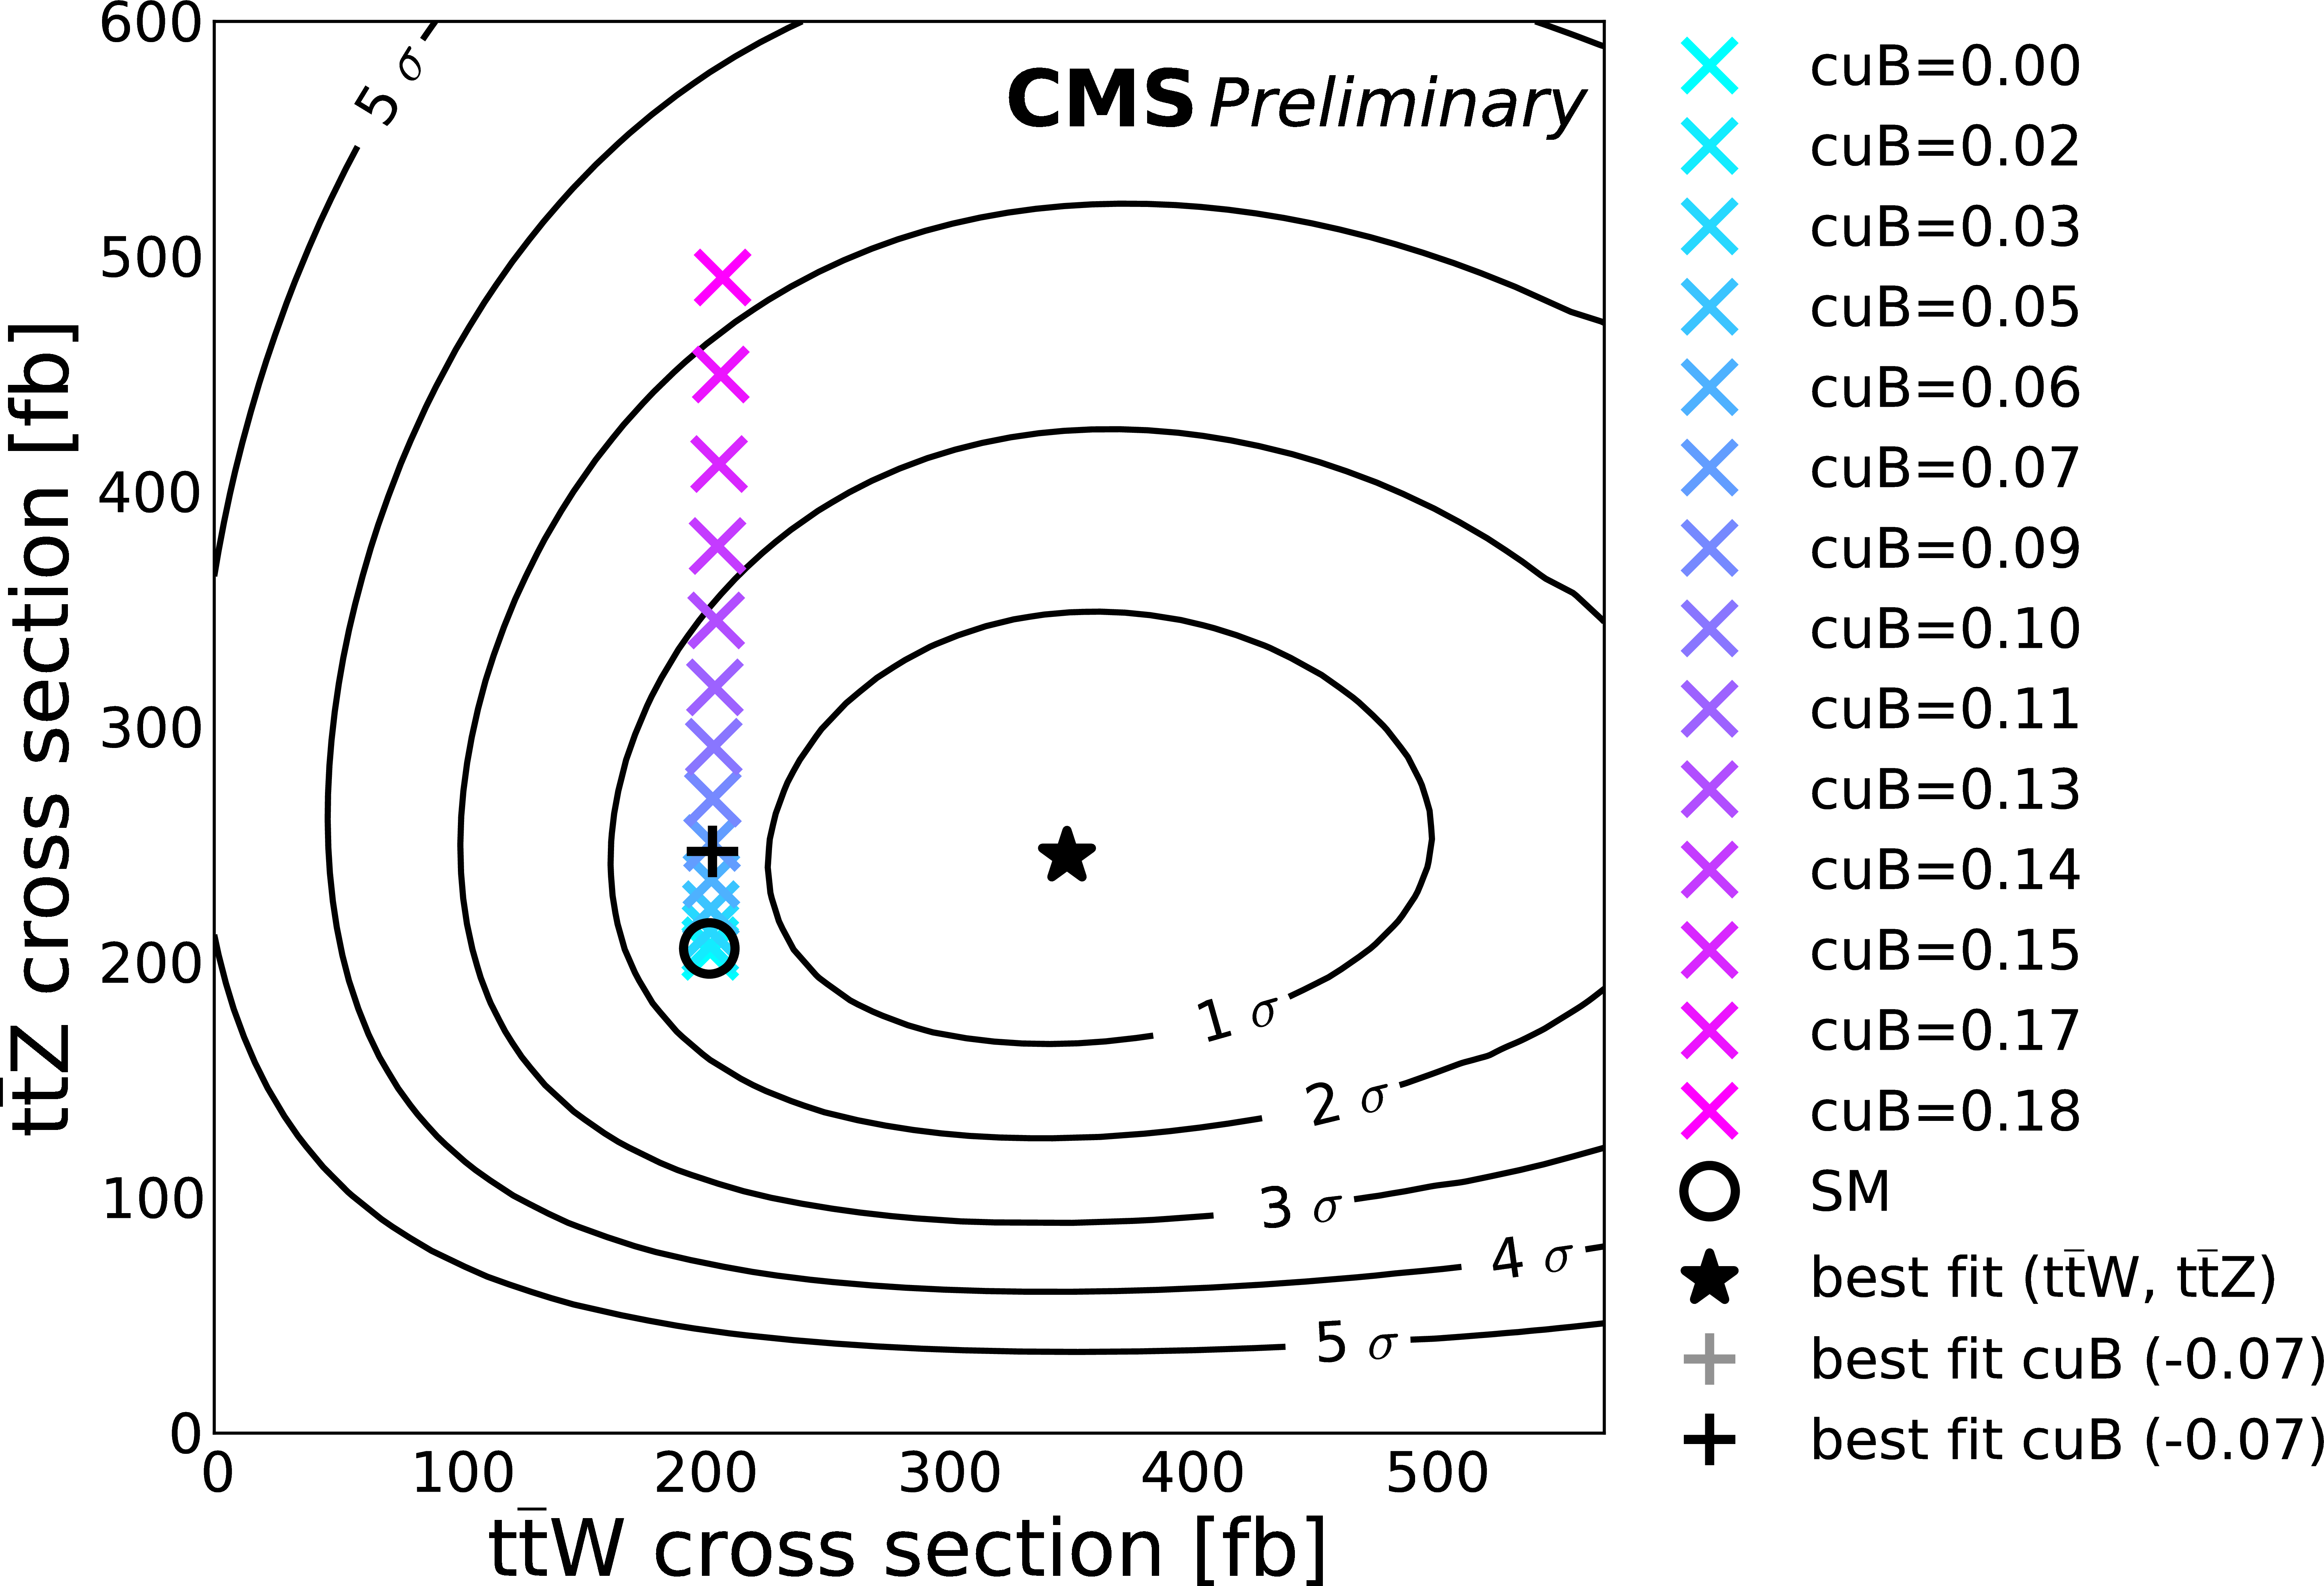
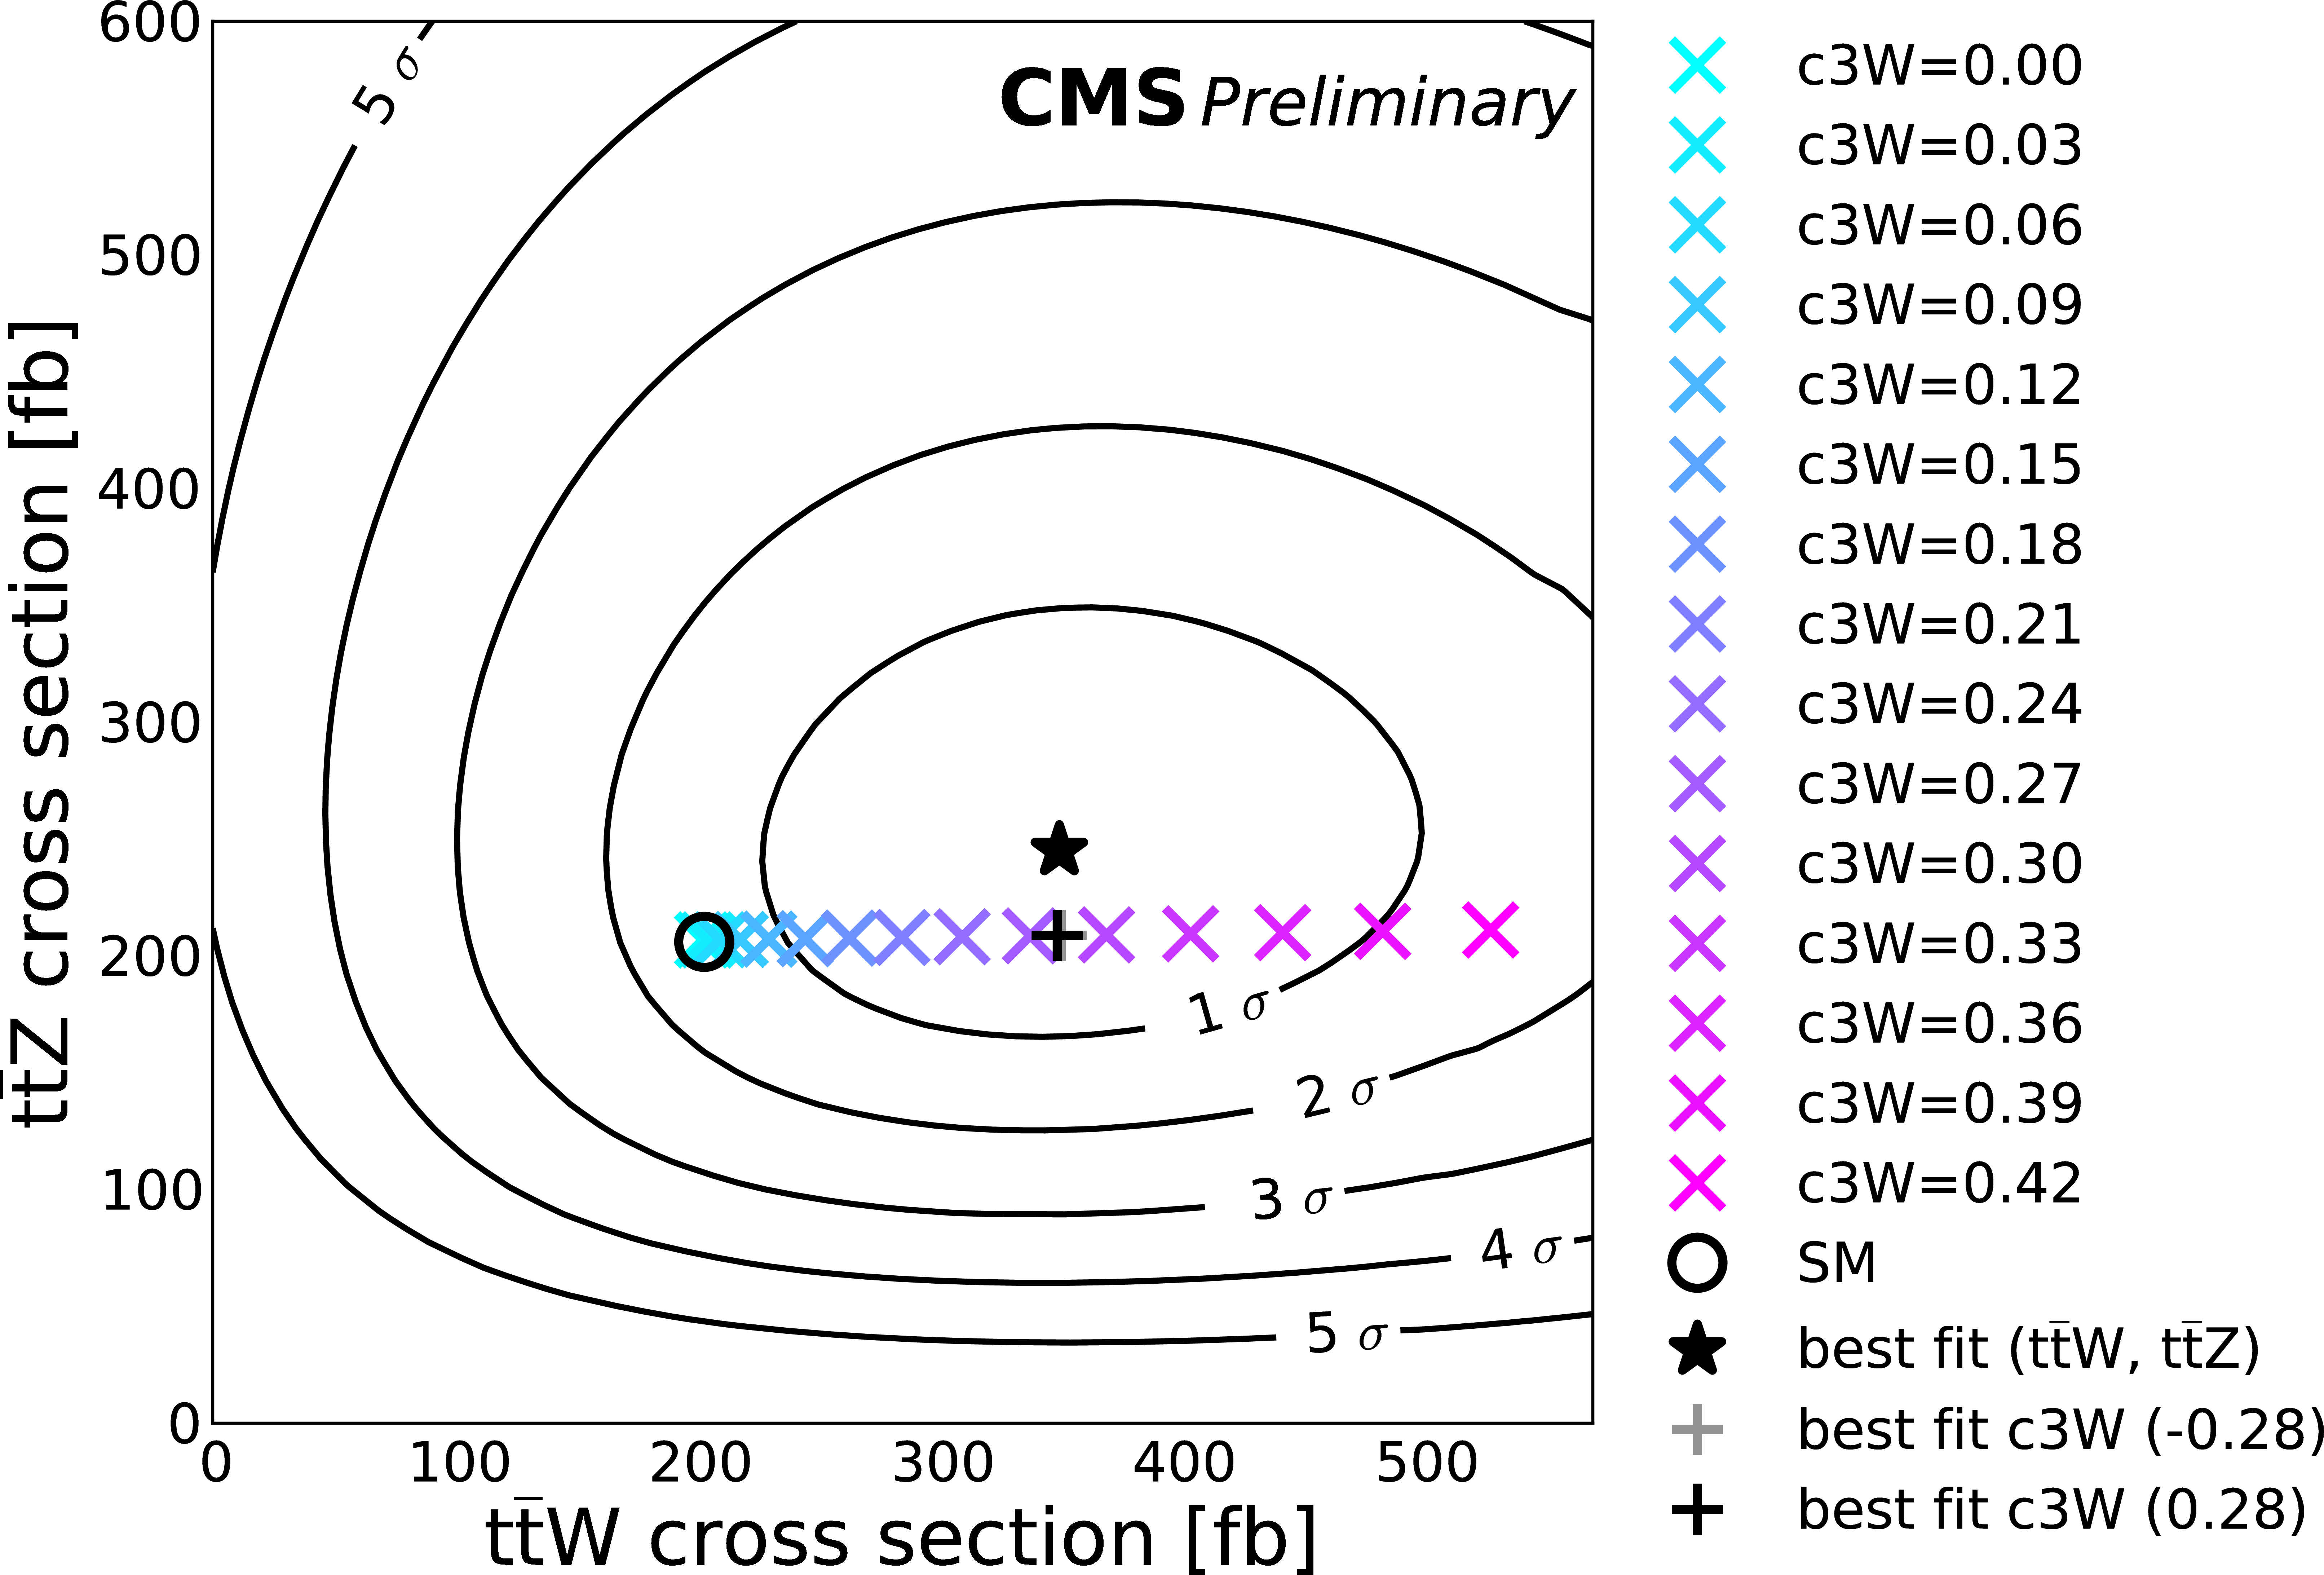
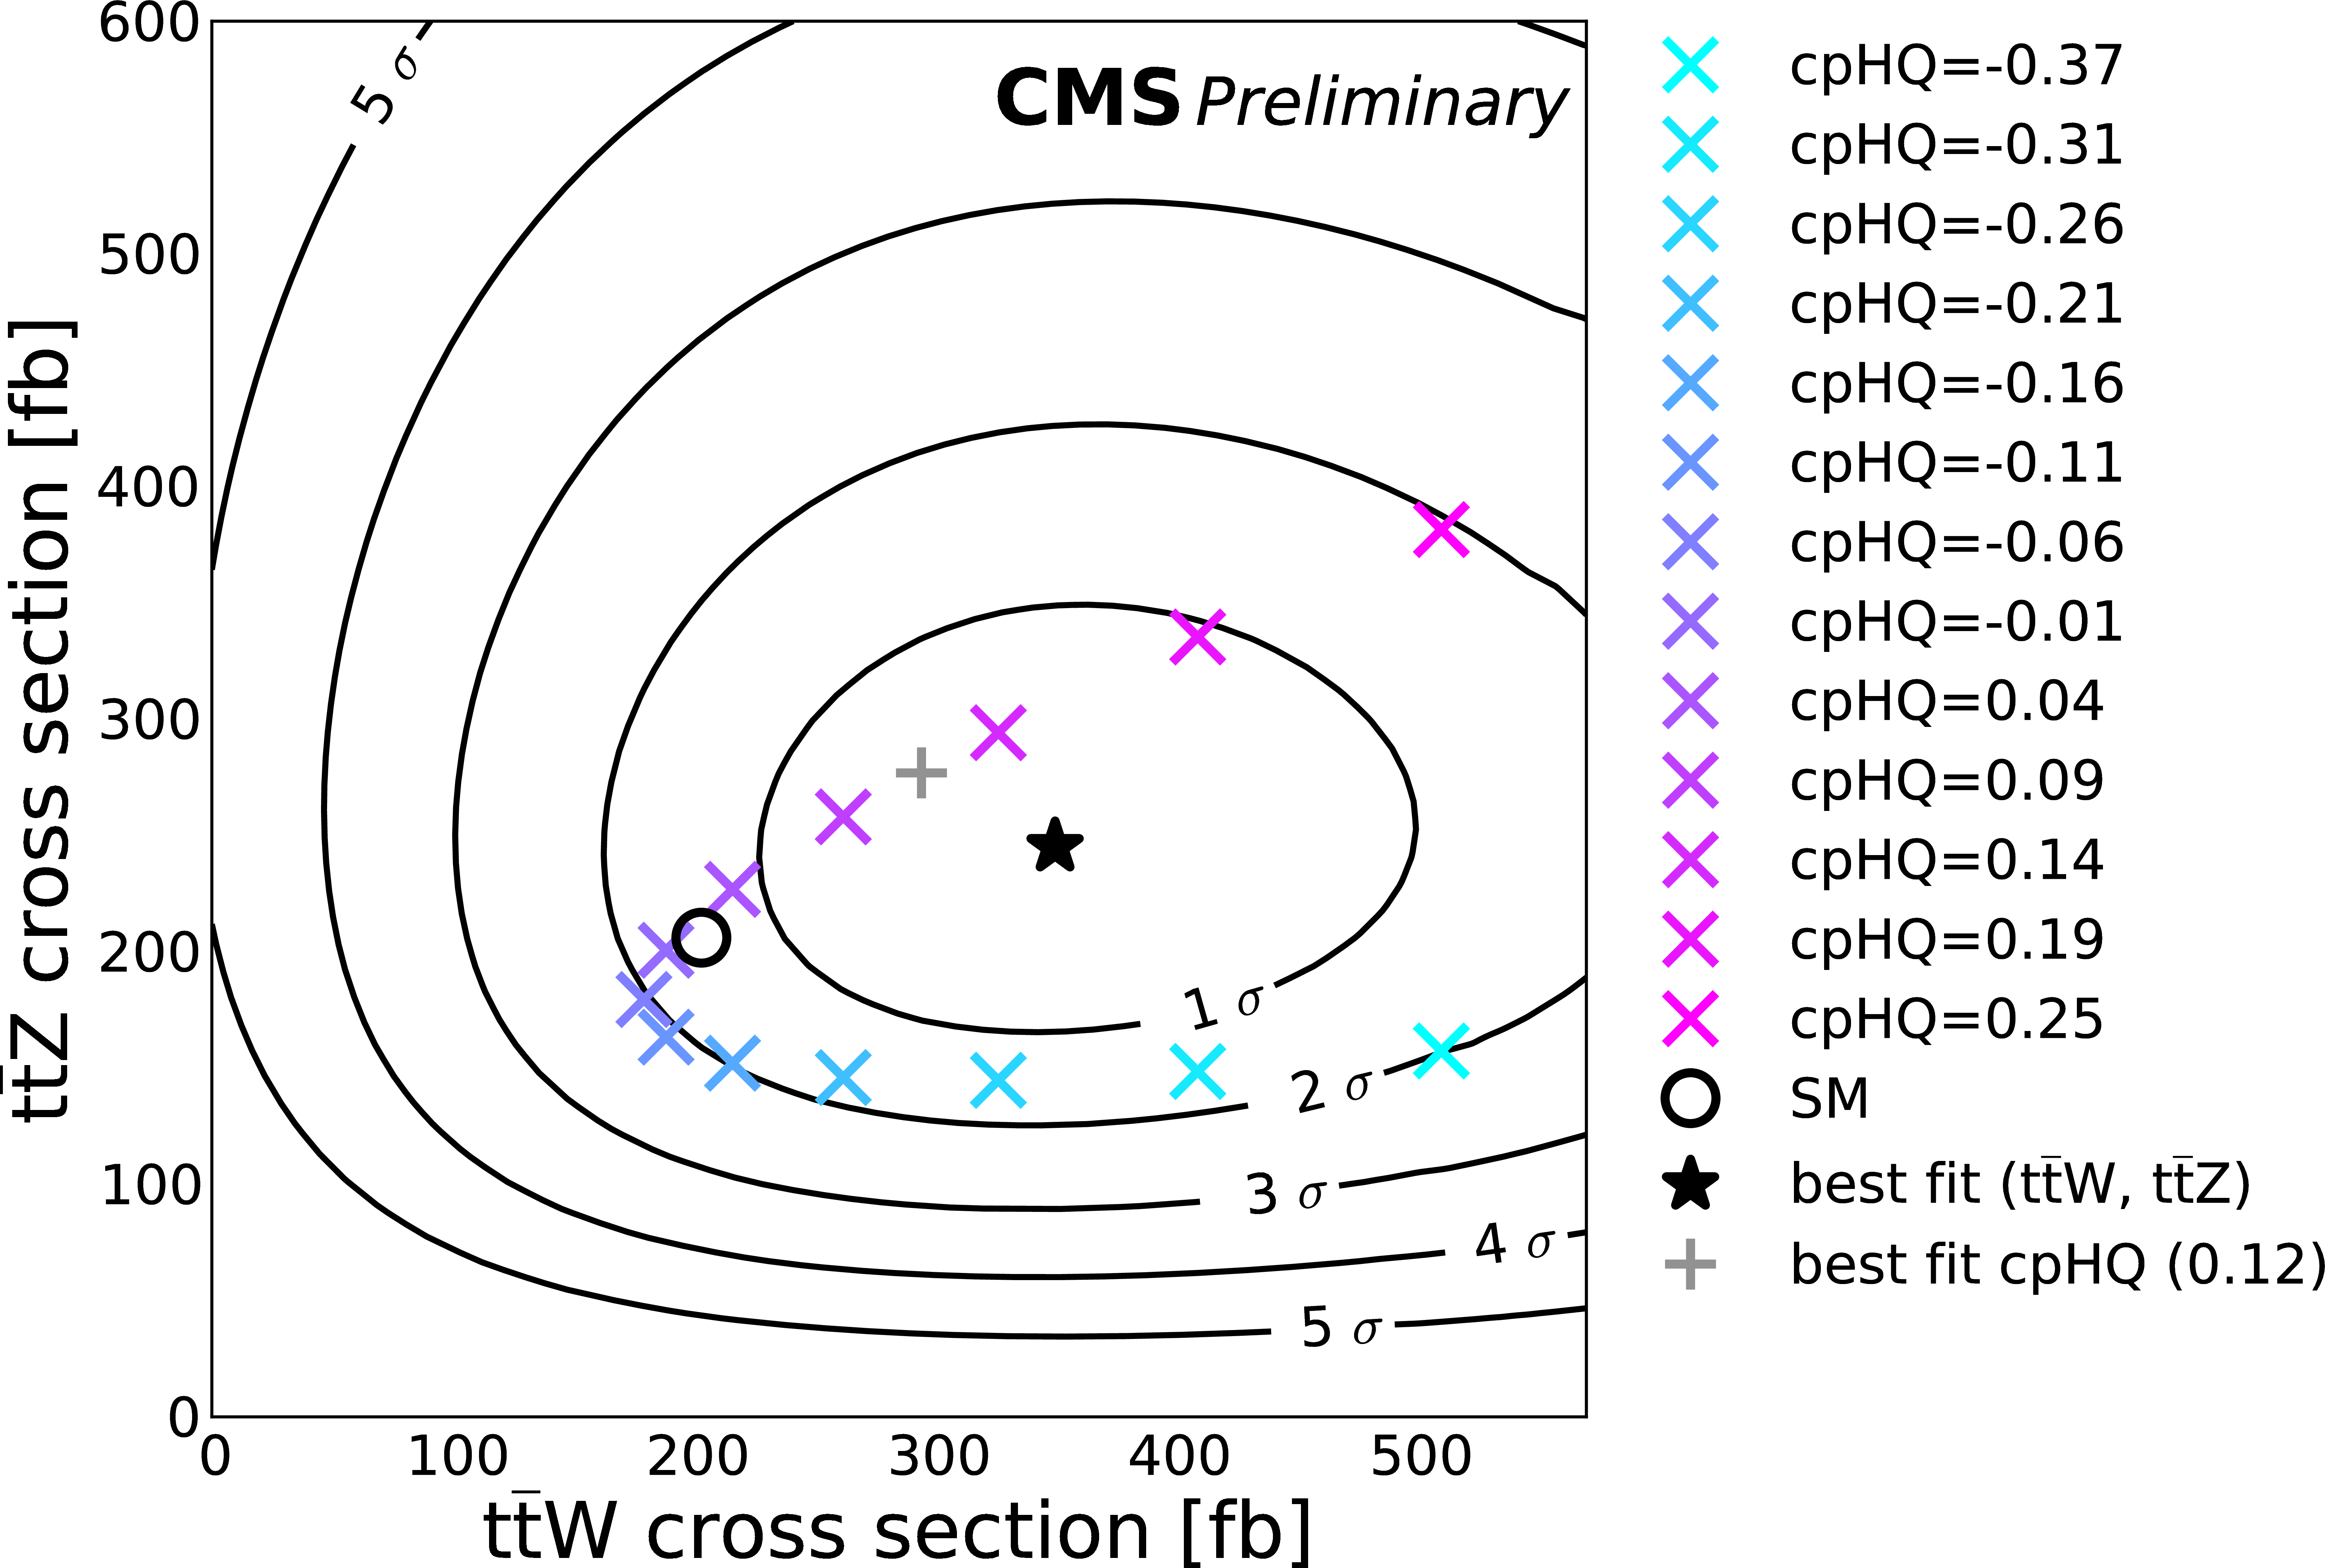
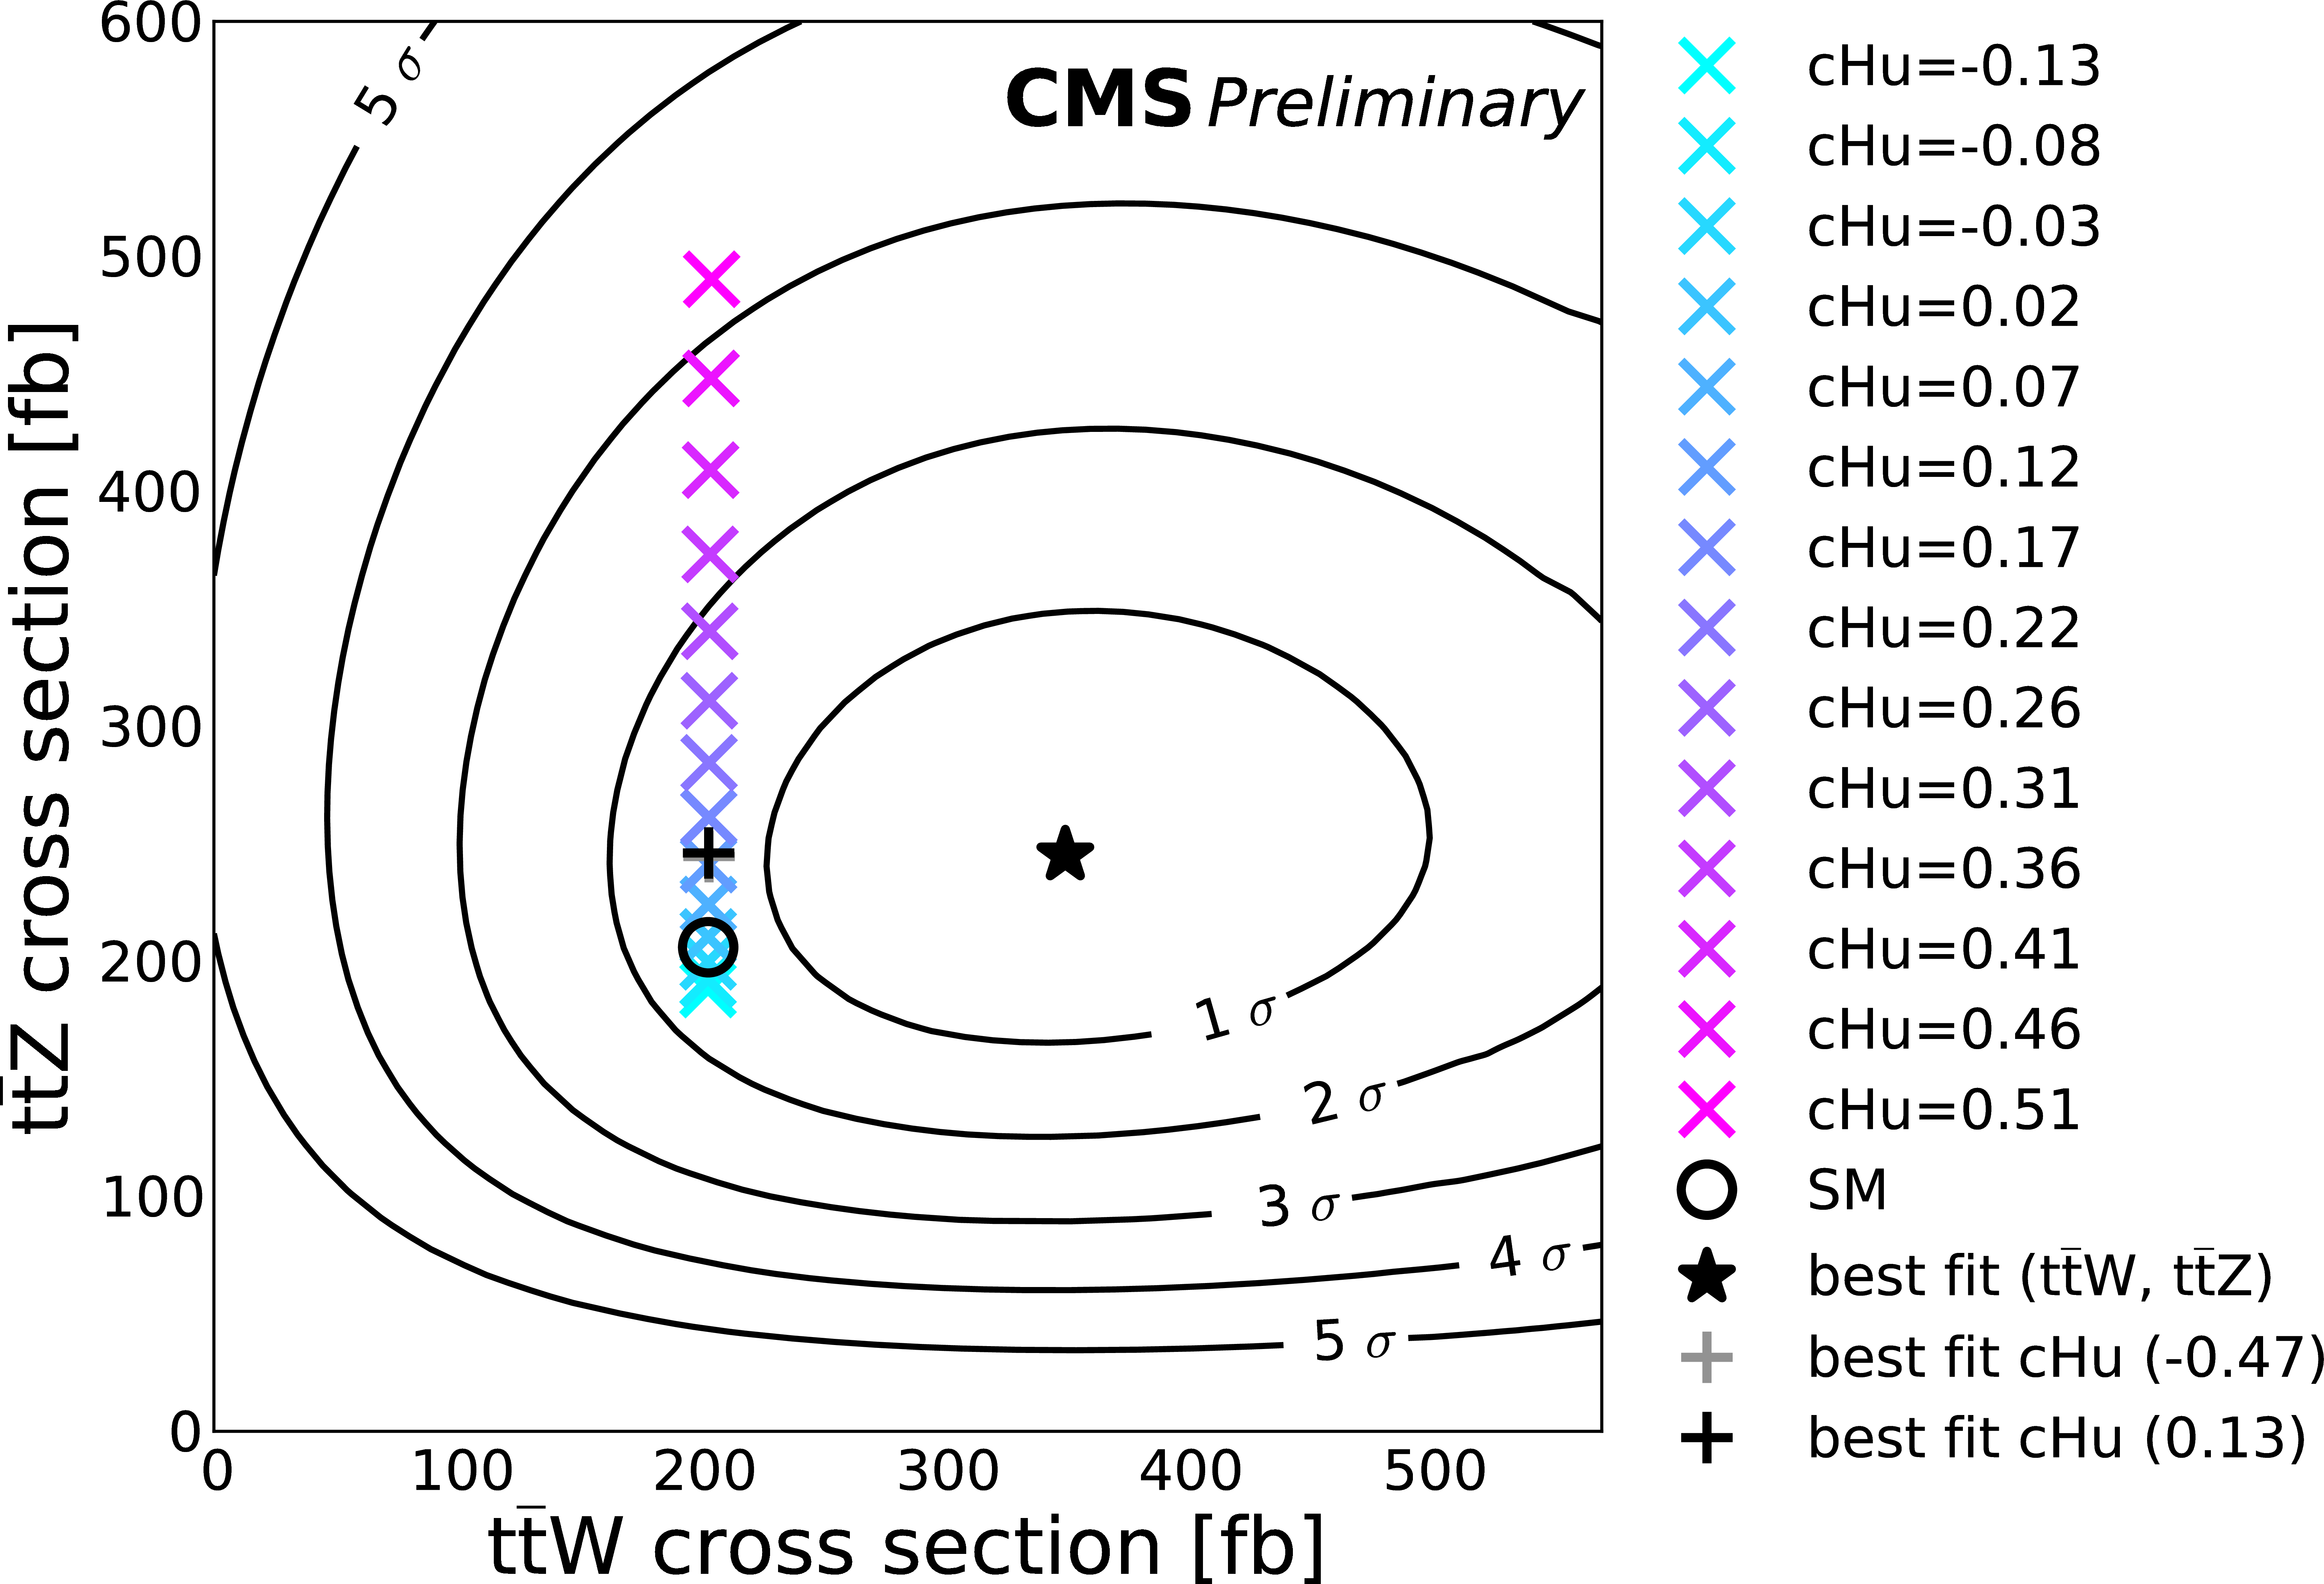
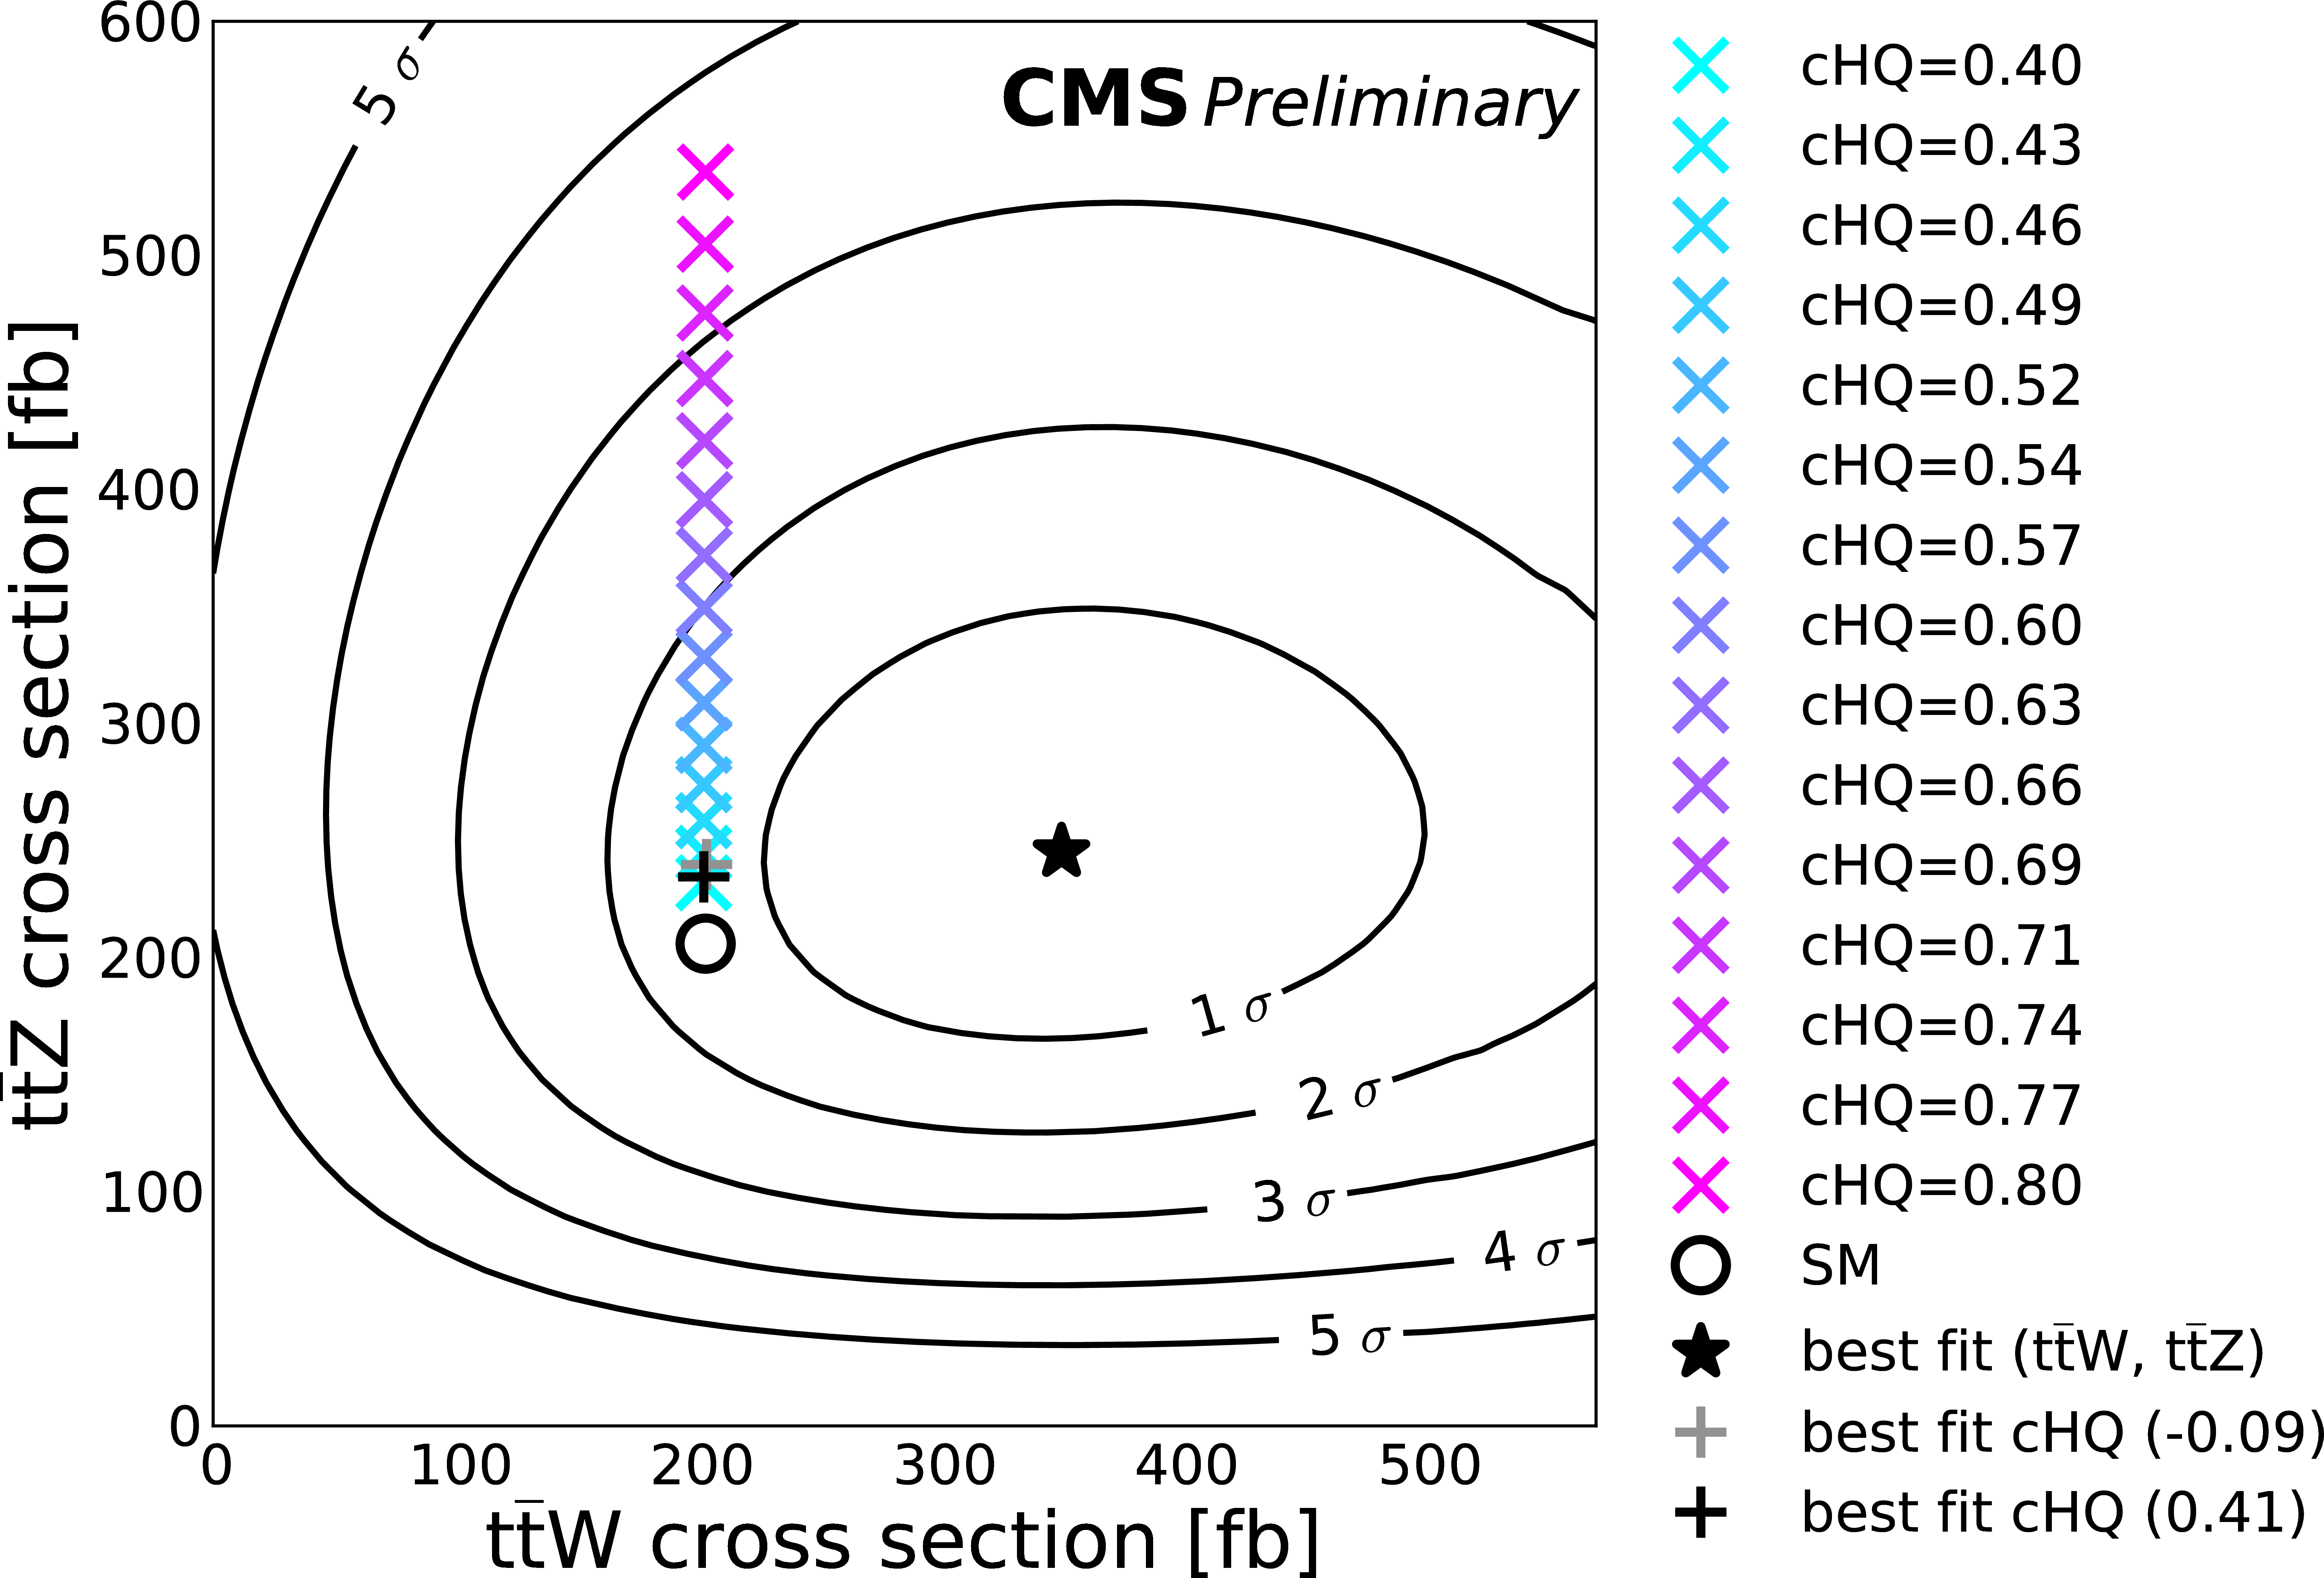
Figure 9-a:
Sampled coefficient values for $\bar{c}_{uB}$, $\bar{c}_{3W}$, $\bar{c}'_{HQ}$, $\bar{c}_{Hu}$, and $\bar{c}_{HQ}$, plotted in the $\sigma ( {\mathrm {t}\overline {\mathrm {t}}} {\mathrm {W}})$, $\sigma ( {\mathrm {t}\overline {\mathrm {t}}} {\mathrm {Z}} )$ plane. There are typically two best fit values, one greater and one less than zero, which lie on top of one another in the plane. |
png ; pdf |
Figure 9-b:
Sampled coefficient values for $\bar{c}_{uB}$, $\bar{c}_{3W}$, $\bar{c}'_{HQ}$, $\bar{c}_{Hu}$, and $\bar{c}_{HQ}$, plotted in the $\sigma ( {\mathrm {t}\overline {\mathrm {t}}} {\mathrm {W}})$, $\sigma ( {\mathrm {t}\overline {\mathrm {t}}} {\mathrm {Z}} )$ plane. There are typically two best fit values, one greater and one less than zero, which lie on top of one another in the plane. |
png ; pdf |
Figure 9-c:
Sampled coefficient values for $\bar{c}_{uB}$, $\bar{c}_{3W}$, $\bar{c}'_{HQ}$, $\bar{c}_{Hu}$, and $\bar{c}_{HQ}$, plotted in the $\sigma ( {\mathrm {t}\overline {\mathrm {t}}} {\mathrm {W}})$, $\sigma ( {\mathrm {t}\overline {\mathrm {t}}} {\mathrm {Z}} )$ plane. There are typically two best fit values, one greater and one less than zero, which lie on top of one another in the plane. |
png ; pdf |
Figure 9-d:
Sampled coefficient values for $\bar{c}_{uB}$, $\bar{c}_{3W}$, $\bar{c}'_{HQ}$, $\bar{c}_{Hu}$, and $\bar{c}_{HQ}$, plotted in the $\sigma ( {\mathrm {t}\overline {\mathrm {t}}} {\mathrm {W}})$, $\sigma ( {\mathrm {t}\overline {\mathrm {t}}} {\mathrm {Z}} )$ plane. There are typically two best fit values, one greater and one less than zero, which lie on top of one another in the plane. |
png ; pdf |
Figure 9-e:
Sampled coefficient values for $\bar{c}_{uB}$, $\bar{c}_{3W}$, $\bar{c}'_{HQ}$, $\bar{c}_{Hu}$, and $\bar{c}_{HQ}$, plotted in the $\sigma ( {\mathrm {t}\overline {\mathrm {t}}} {\mathrm {W}})$, $\sigma ( {\mathrm {t}\overline {\mathrm {t}}} {\mathrm {Z}} )$ plane. There are typically two best fit values, one greater and one less than zero, which lie on top of one another in the plane. |
|
|
Compact Muon Solenoid LHC, CERN |
|

|

|

|

|

|