

Compact Muon Solenoid
LHC, CERN
| CMS-PAS-TOP-13-004 | ||
| Measurement of the $\mathrm{ t \bar{t} } $ production cross section in the e$\mu$ channel in pp collisions at 7 and 8 TeV | ||
| CMS Collaboration | ||
| September 2015 | ||
|
Abstract:
The inclusive cross section for top quark pair production is measured in proton-proton collisions at $\sqrt{s} = $ 7 TeV and $\sqrt{s} =$ 8 TeV with the CMS experiment at the CERN LHC using the full data samples collected in 2011 and 2012. The measurement is performed with events containing an opposite charge electron-muon pair. The cross sections are extracted using a binned likelihood fit to multi-differential final state distributions related to identified b quark and other jets in the event. The measured cross sections are: in good agreement with recent QCD calculations at next-to-next-to-leading-order accuracy. The ratio of the cross sections for the two different values of $\sqrt{s}$ is determined as well as cross sections in fiducial regions, defined by the acceptance requirements on the two charged leptons in the final state. The inclusive cross section results are used to determine the top quark pole mass via the dependence of the theoretically predicted cross section on the mass, giving a result of 173.6 $^{+1.7}_{-1.8}$ GeV for the PDF set NNPDF3.0. The 8 TeV data are also used to set limits on the pair production of supersymmetric top squarks with masses close to the top quark mass, as a function of the neutralino mass. | ||
|
Links:
CDS record (PDF) ;
Public twiki page ;
CADI line (restricted) ; Figures are also available from the CDS record. These preliminary results are superseded in this paper, JHEP 08 (2016) 029. |
||
| Figures | |
png ; pdf |
Figure 1-a:
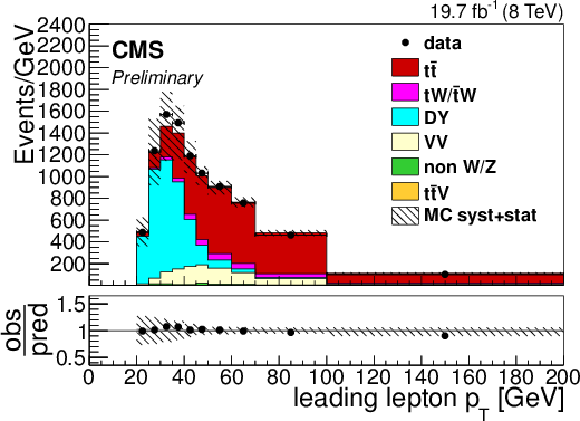
Distributions of $ {p_{\mathrm {T}}} $ (a,c) and $\eta $ (b,d) of the leading (a,b) and second-leading (c,d) lepton, after the e$\mu $ selection, for the 8 TeV data. The hatched bands correspond to the total uncertainty on the sum of the predicted yields. The ratios of data to the sum of the predicted yields are shown at the bottom of each plot. Here, the shaded band represents the contribution of the statistical uncertainty. |
png ; pdf |
Figure 1-b:
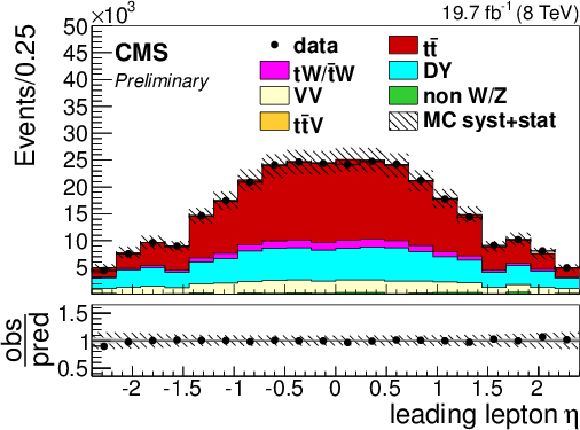
Distributions of $ {p_{\mathrm {T}}} $ (a,c) and $\eta $ (b,d) of the leading (a,b) and second-leading (c,d) lepton, after the e$\mu $ selection, for the 8 TeV data. The hatched bands correspond to the total uncertainty on the sum of the predicted yields. The ratios of data to the sum of the predicted yields are shown at the bottom of each plot. Here, the shaded band represents the contribution of the statistical uncertainty. |
png ; pdf |
Figure 1-c:
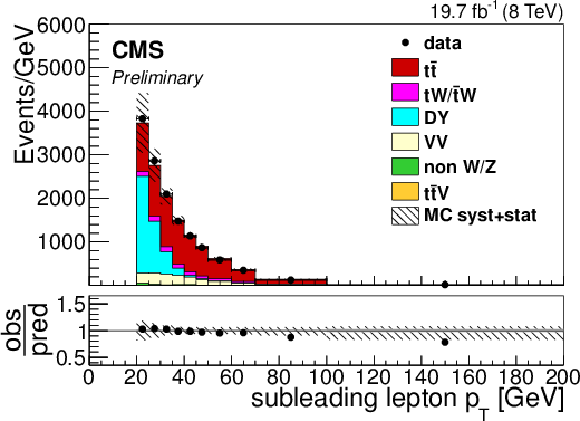
Distributions of $ {p_{\mathrm {T}}} $ (a,c) and $\eta $ (b,d) of the leading (a,b) and second-leading (c,d) lepton, after the e$\mu $ selection, for the 8 TeV data. The hatched bands correspond to the total uncertainty on the sum of the predicted yields. The ratios of data to the sum of the predicted yields are shown at the bottom of each plot. Here, the shaded band represents the contribution of the statistical uncertainty. |
png ; pdf |
Figure 1-d:
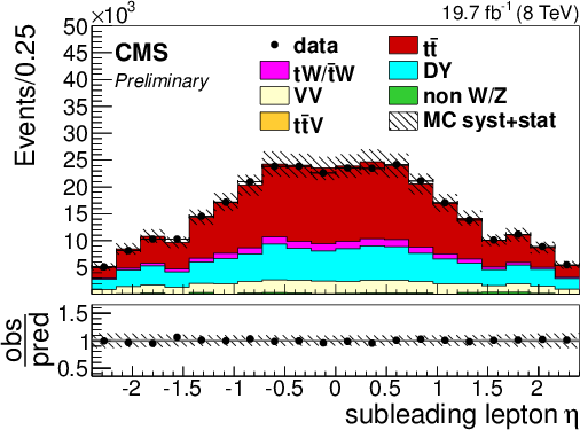
Distributions of $ {p_{\mathrm {T}}} $ (a,c) and $\eta $ (b,d) of the leading (a,b) and second-leading (c,d) lepton, after the e$\mu $ selection, for the 8 TeV data. The hatched bands correspond to the total uncertainty on the sum of the predicted yields. The ratios of data to the sum of the predicted yields are shown at the bottom of each plot. Here, the shaded band represents the contribution of the statistical uncertainty. |
png ; pdf |
Figure 2-a:
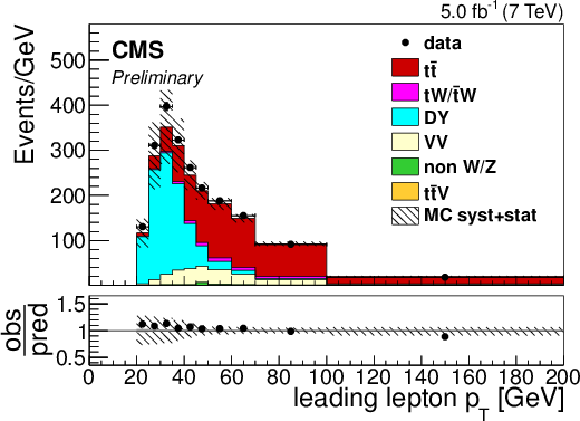
Distributions of $ {p_{\mathrm {T}}} $ (a,c) and $\eta $ (b,d) of the leading (a,b) and second-leading (c,d) lepton, after the e$\mu $ selection, for the 7 TeV data. The hatched bands correspond to the total uncertainty on the sum of the predicted yields. The ratios of data to the sum of the predicted yields are shown at the bottom of each plot. Here, the shaded band represents the contribution of the statistical uncertainty. |
png ; pdf |
Figure 2-b:
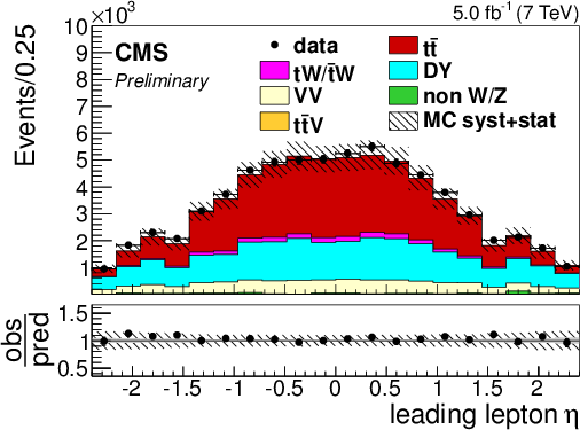
Distributions of $ {p_{\mathrm {T}}} $ (a,c) and $\eta $ (b,d) of the leading (a,b) and second-leading (c,d) lepton, after the e$\mu $ selection, for the 7 TeV data. The hatched bands correspond to the total uncertainty on the sum of the predicted yields. The ratios of data to the sum of the predicted yields are shown at the bottom of each plot. Here, the shaded band represents the contribution of the statistical uncertainty. |
png ; pdf |
Figure 2-c:
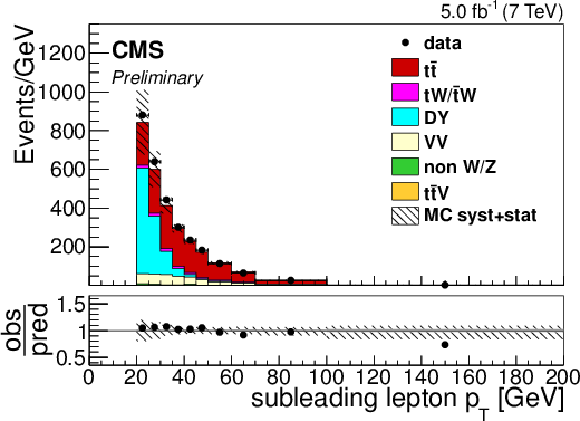
Distributions of $ {p_{\mathrm {T}}} $ (a,c) and $\eta $ (b,d) of the leading (a,b) and second-leading (c,d) lepton, after the e$\mu $ selection, for the 7 TeV data. The hatched bands correspond to the total uncertainty on the sum of the predicted yields. The ratios of data to the sum of the predicted yields are shown at the bottom of each plot. Here, the shaded band represents the contribution of the statistical uncertainty. |
png ; pdf |
Figure 2-d:
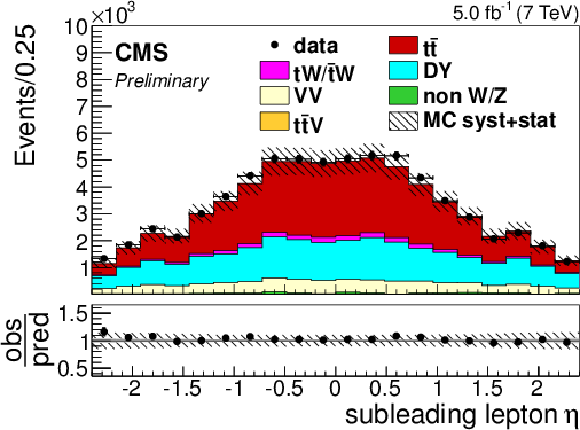
Distributions of $ {p_{\mathrm {T}}} $ (a,c) and $\eta $ (b,d) of the leading (a,b) and second-leading (c,d) lepton, after the e$\mu $ selection, for the 7 TeV data. The hatched bands correspond to the total uncertainty on the sum of the predicted yields. The ratios of data to the sum of the predicted yields are shown at the bottom of each plot. Here, the shaded band represents the contribution of the statistical uncertainty. |
png ; pdf |
Figure 3-a:
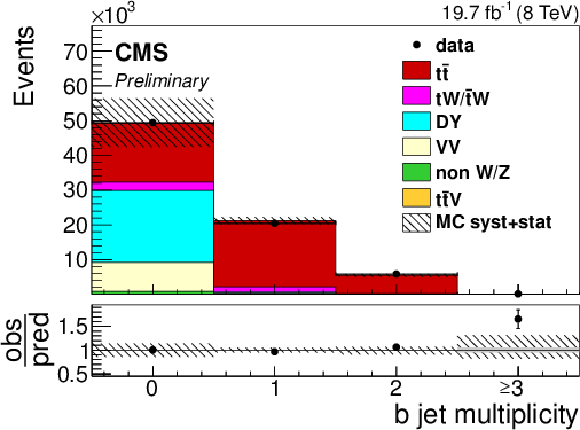
Distribution of the b jet multiplicity after the e$\mu$ selection for 8 TeV (a) and 7 TeV (b). Other details as for Figure 1. |
png ; pdf |
Figure 3-b:
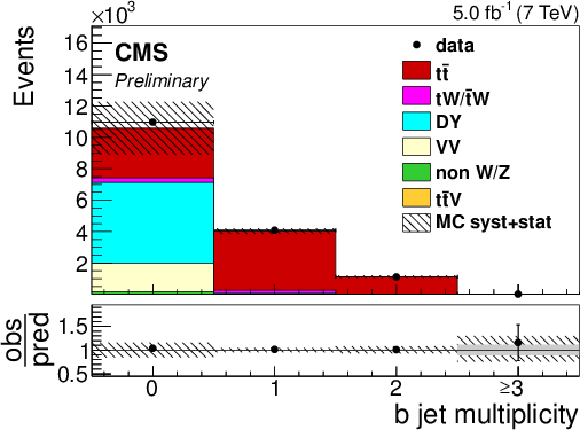
Distribution of the b jet multiplicity after the e$\mu$ selection for 8 TeV (a) and 7 TeV (b). Other details as for Figure 1. |

png ; pdf |
Figure 4-a:
Total event yields for zero additional non-b-tagged jets (left) and $ {p_{\mathrm {T}}} $ of the least energetic additional non b-tagged jet in the event (right) for events with one, two, and at least three additional non b-tagged jets, and with zero or more than two (a), one (b), and two (c) b-tagged jets at $\sqrt {s} =$ 8 TeV. The hatched bands correspond to the total uncertainty on the sum of the predicted yields. The ratios of data to the sum of the predicted yields are shown at the bottom of each subfigure. Here, the shaded band represents the statistical uncertainty. |

png ; pdf |
Figure 4-b:
Total event yields for zero additional non-b-tagged jets (left) and $ {p_{\mathrm {T}}} $ of the least energetic additional non b-tagged jet in the event (right) for events with one, two, and at least three additional non b-tagged jets, and with zero or more than two (a), one (b), and two (c) b-tagged jets at $\sqrt {s} =$ 8 TeV. The hatched bands correspond to the total uncertainty on the sum of the predicted yields. The ratios of data to the sum of the predicted yields are shown at the bottom of each subfigure. Here, the shaded band represents the statistical uncertainty. |

png ; pdf |
Figure 4-c:
Total event yields for zero additional non-b-tagged jets (left) and $ {p_{\mathrm {T}}} $ of the least energetic additional non b-tagged jet in the event (right) for events with one, two, and at least three additional non b-tagged jets, and with zero or more than two (a), one (b), and two (c) b-tagged jets at $\sqrt {s} =$ 8 TeV. The hatched bands correspond to the total uncertainty on the sum of the predicted yields. The ratios of data to the sum of the predicted yields are shown at the bottom of each subfigure. Here, the shaded band represents the statistical uncertainty. |

png ; pdf |
Figure 5-a:
Total event yields for zero additional non-b-tagged jets (left) and $ {p_{\mathrm {T}}} $ of the least energetic additional non b-tagged jet in the event (right) for events with one, two, and at least three additional non b-tagged jets, and with zero or more than two (a), one (b), and two (c) b-tagged jets at $\sqrt {s} =$ 7 TeV. The hatched bands correspond to the total uncertainty on the sum of the predicted yields. The ratios of data to the sum of the predicted yields are shown at the bottom of each subfigure. Here, the shaded band represents the statistical uncertainty. |

png ; pdf |
Figure 5-b:
Total event yields for zero additional non-b-tagged jets (left) and $ {p_{\mathrm {T}}} $ of the least energetic additional non b-tagged jet in the event (right) for events with one, two, and at least three additional non b-tagged jets, and with zero or more than two (a), one (b), and two (c) b-tagged jets at $\sqrt {s} =$ 7 TeV. The hatched bands correspond to the total uncertainty on the sum of the predicted yields. The ratios of data to the sum of the predicted yields are shown at the bottom of each subfigure. Here, the shaded band represents the statistical uncertainty. |

png ; pdf |
Figure 5-c:
Total event yields for zero additional non-b-tagged jets (left) and $ {p_{\mathrm {T}}} $ of the least energetic additional non b-tagged jet in the event (right) for events with one, two, and at least three additional non b-tagged jets, and with zero or more than two (a), one (b), and two (c) b-tagged jets at $\sqrt {s} =$ 7 TeV. The hatched bands correspond to the total uncertainty on the sum of the predicted yields. The ratios of data to the sum of the predicted yields are shown at the bottom of each subfigure. Here, the shaded band represents the statistical uncertainty. |

png ; pdf |
Figure 6-a:
Fitted total event yields for zero additional non-b-tagged jets (left) and $ {p_{\mathrm {T}}} $ of the least energetic additional non b-tagged jet in the event (right) for events with one, two, and at least three additional non b-tagged jets, and with zero or more than two (a), one (b), and two (c) b-tagged jets at $\sqrt {s} =$ 8 TeV. The hatched bands correspond to the total uncertainty on the sum of the predicted yields after the fit, and include all correlations. The ratios of data to the sum of the predicted yields are shown at the bottom of each plot. Here, the shaded band represents the statistical uncertainty. |

png ; pdf |
Figure 6-b:
Fitted total event yields for zero additional non-b-tagged jets (left) and $ {p_{\mathrm {T}}} $ of the least energetic additional non b-tagged jet in the event (right) for events with one, two, and at least three additional non b-tagged jets, and with zero or more than two (a), one (b), and two (c) b-tagged jets at $\sqrt {s} =$ 8 TeV. The hatched bands correspond to the total uncertainty on the sum of the predicted yields after the fit, and include all correlations. The ratios of data to the sum of the predicted yields are shown at the bottom of each plot. Here, the shaded band represents the statistical uncertainty. |

png ; pdf |
Figure 6-c:
Fitted total event yields for zero additional non-b-tagged jets (left) and $ {p_{\mathrm {T}}} $ of the least energetic additional non b-tagged jet in the event (right) for events with one, two, and at least three additional non b-tagged jets, and with zero or more than two (a), one (b), and two (c) b-tagged jets at $\sqrt {s} =$ 8 TeV. The hatched bands correspond to the total uncertainty on the sum of the predicted yields after the fit, and include all correlations. The ratios of data to the sum of the predicted yields are shown at the bottom of each plot. Here, the shaded band represents the statistical uncertainty. |

png ; pdf |
Figure 7-a:
Fitted total event yields for zero additional non-b-tagged jets (left) and $ {p_{\mathrm {T}}} $ of the least energetic additional non b-tagged jet in the event (right) for events with one, two, and at least three additional non b-tagged jets, and with zero or more than two (a), one (b), and two (c) b-tagged jets at $\sqrt {s} =$ 7 TeV. The hatched bands correspond to the total uncertainty on the sum of the predicted yields after the fit, and include all correlations. The ratios of data to the sum of the predicted yields are shown at the bottom of each plot. Here, the shaded band represents the statistical uncertainty. |

png ; pdf |
Figure 7-b:
Fitted total event yields for zero additional non-b-tagged jets (left) and $ {p_{\mathrm {T}}} $ of the least energetic additional non b-tagged jet in the event (right) for events with one, two, and at least three additional non b-tagged jets, and with zero or more than two (a), one (b), and two (c) b-tagged jets at $\sqrt {s} =$ 7 TeV. The hatched bands correspond to the total uncertainty on the sum of the predicted yields after the fit, and include all correlations. The ratios of data to the sum of the predicted yields are shown at the bottom of each plot. Here, the shaded band represents the statistical uncertainty. |

png ; pdf |
Figure 7-c:
Fitted total event yields for zero additional non-b-tagged jets (left) and $ {p_{\mathrm {T}}} $ of the least energetic additional non b-tagged jet in the event (right) for events with one, two, and at least three additional non b-tagged jets, and with zero or more than two (a), one (b), and two (c) b-tagged jets at $\sqrt {s} =$ 7 TeV. The hatched bands correspond to the total uncertainty on the sum of the predicted yields after the fit, and include all correlations. The ratios of data to the sum of the predicted yields are shown at the bottom of each plot. Here, the shaded band represents the statistical uncertainty. |
png ; pdf |
Figure 8-a:
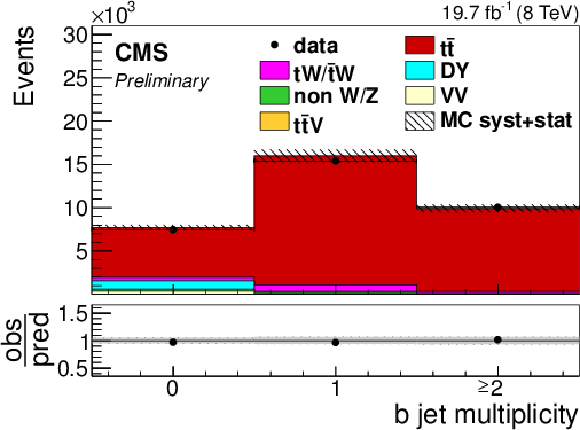
Data-MC comparisons of the b jet multiplicity distributions in the e$\mu $ channel for 8 (a) and 7 (b) TeV data. The error band represents the global uncertainty in the measurement. |
png ; pdf |
Figure 8-b:
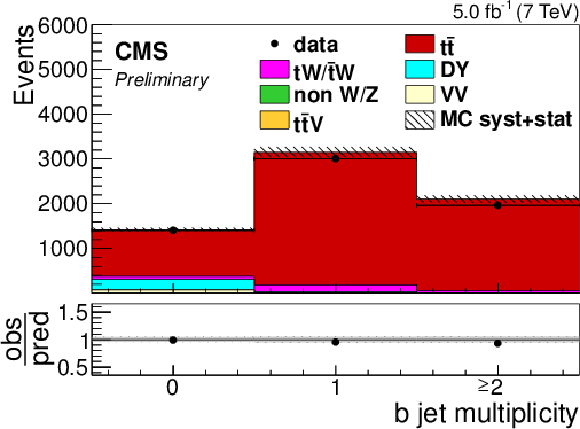
Data-MC comparisons of the b jet multiplicity distributions in the e$\mu $ channel for 8 (a) and 7 (b) TeV data. The error band represents the global uncertainty in the measurement. |
png ; pdf |
Figure 9-a:
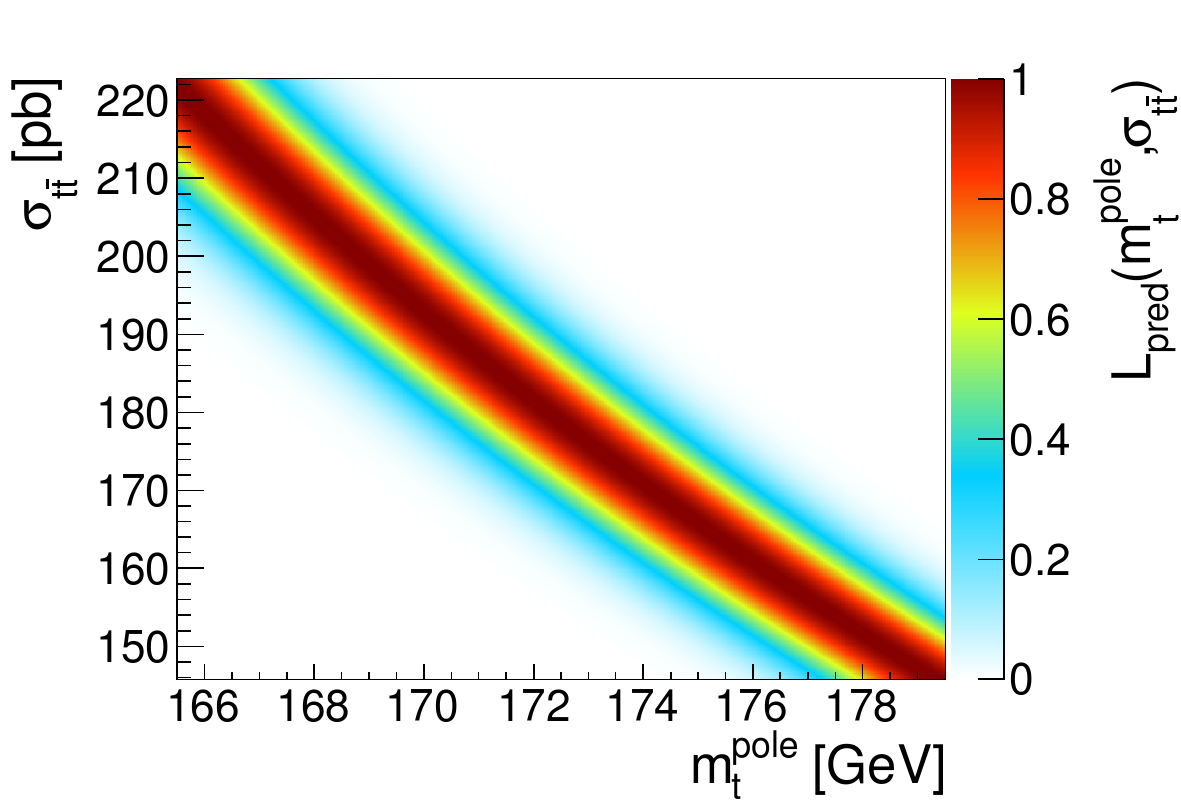
Dependence of the $ \mathrm { t \bar{t} } $ production cross section on the top quark mass for 7 (a,b) and 8 TeV (c,d). a,c: predicted dependence determined with TOP++ using the NNPDF3.0 PDF set, b,d: measured. For the measured dependence, the black symbols represent the measured values and the vertical bars indicate the total 1$\sigma $-uncertainty. |
png ; pdf |
Figure 9-b:
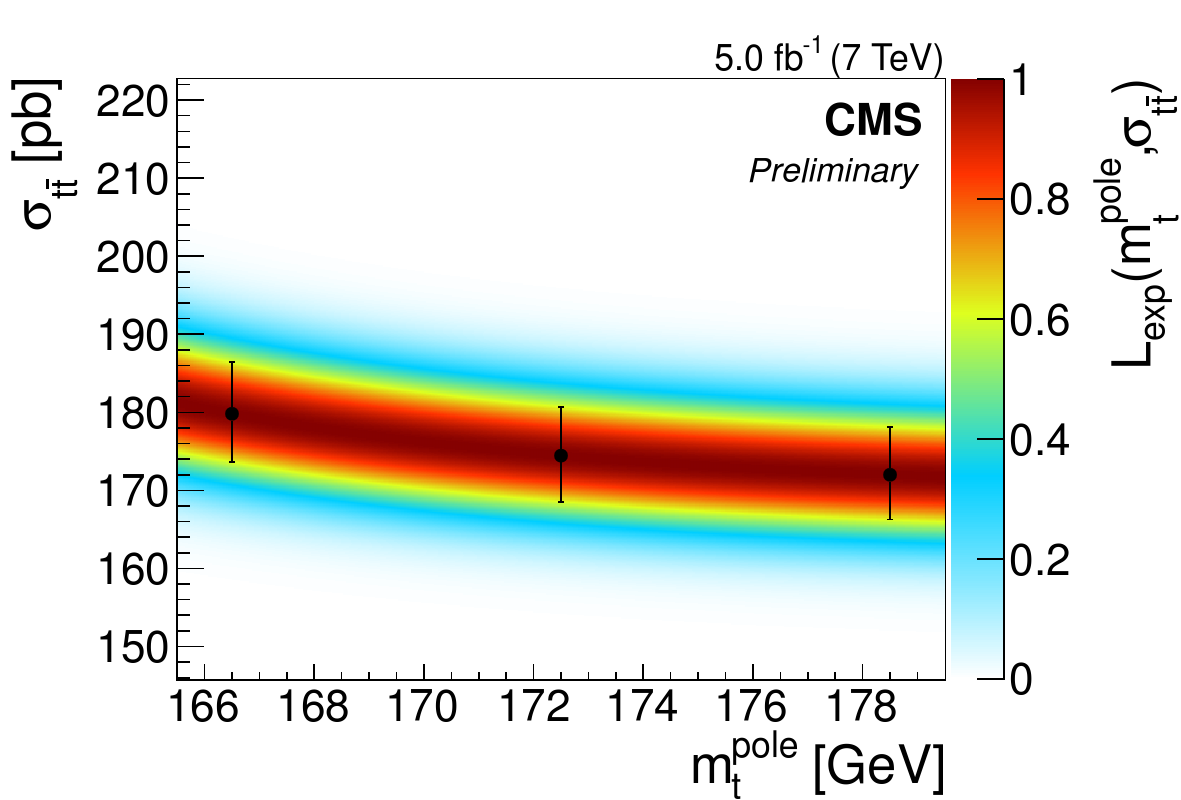
Dependence of the $ \mathrm { t \bar{t} } $ production cross section on the top quark mass for 7 (a,b) and 8 TeV (c,d). a,c: predicted dependence determined with TOP++ using the NNPDF3.0 PDF set, b,d: measured. For the measured dependence, the black symbols represent the measured values and the vertical bars indicate the total 1$\sigma $-uncertainty. |
png ; pdf |
Figure 9-c:
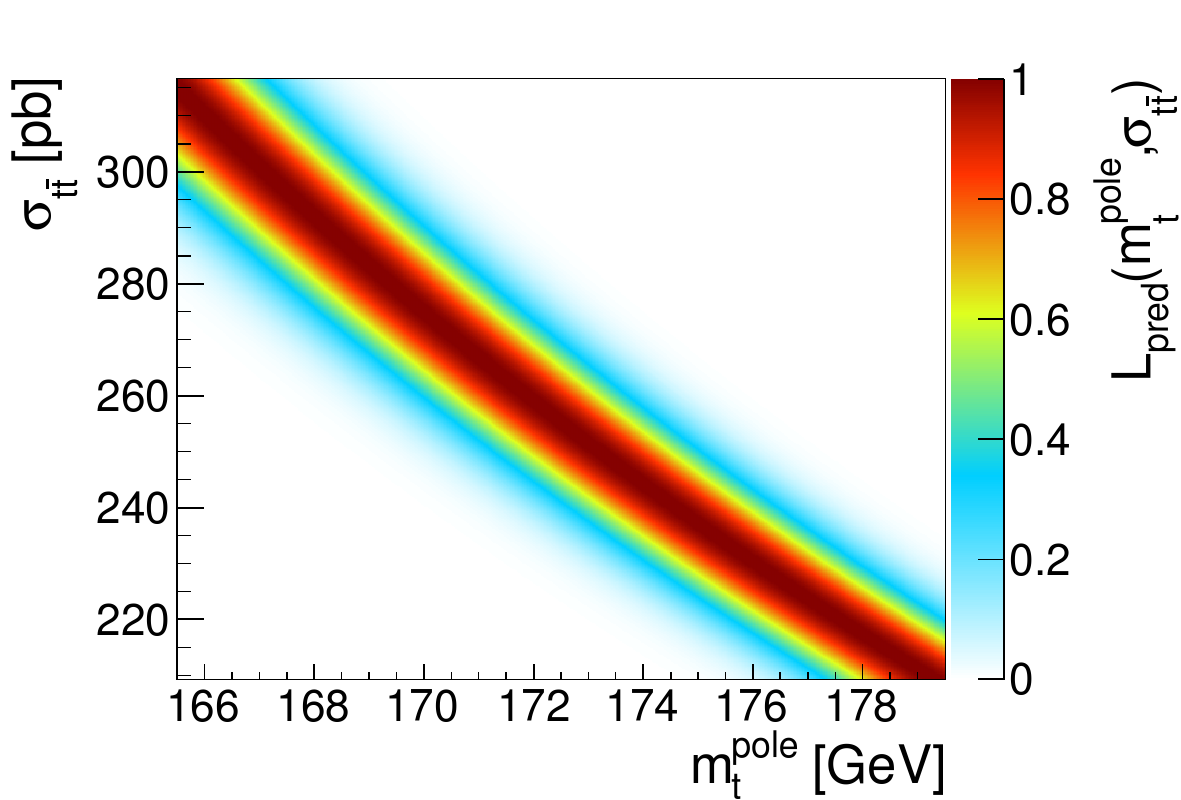
Dependence of the $ \mathrm { t \bar{t} } $ production cross section on the top quark mass for 7 (a,b) and 8 TeV (c,d). a,c: predicted dependence determined with TOP++ using the NNPDF3.0 PDF set, b,d: measured. For the measured dependence, the black symbols represent the measured values and the vertical bars indicate the total 1$\sigma $-uncertainty. |
png ; pdf |
Figure 9-d:
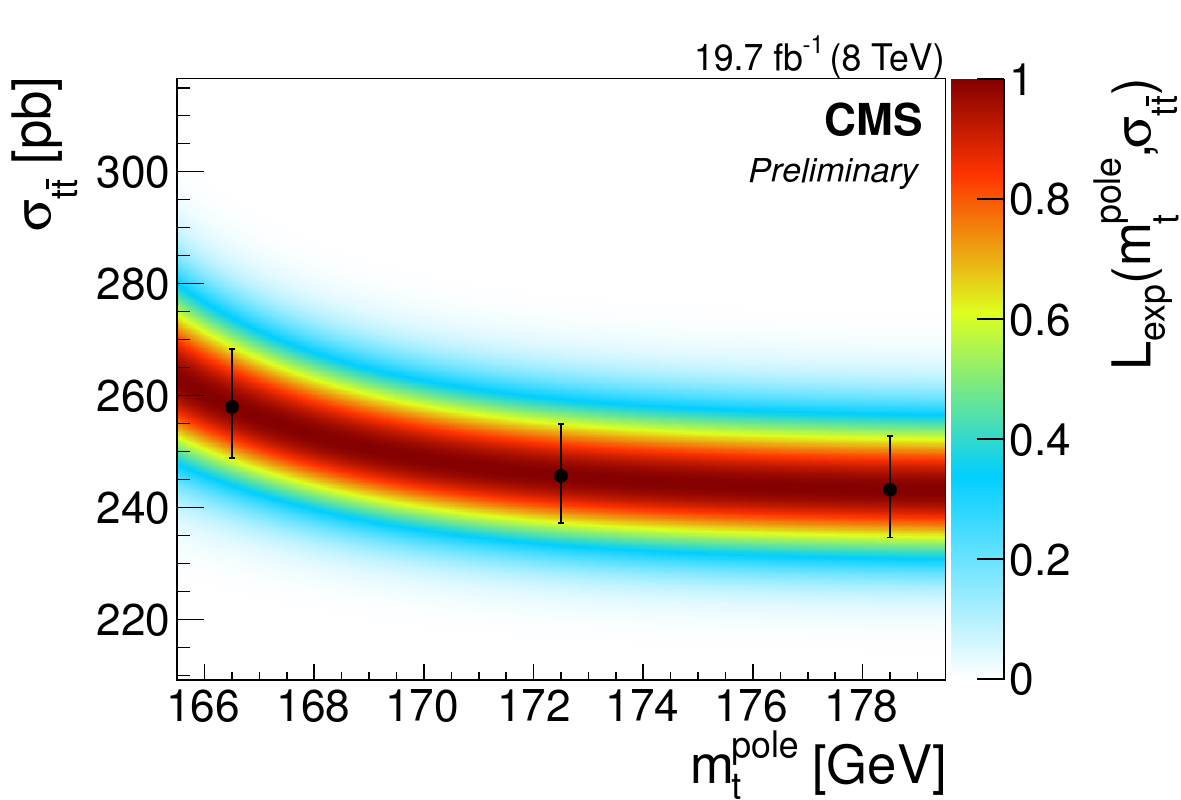
Dependence of the $ \mathrm { t \bar{t} } $ production cross section on the top quark mass for 7 (a,b) and 8 TeV (c,d). a,c: predicted dependence determined with TOP++ using the NNPDF3.0 PDF set, b,d: measured. For the measured dependence, the black symbols represent the measured values and the vertical bars indicate the total 1$\sigma $-uncertainty. |
png ; pdf |
Figure 10-a:
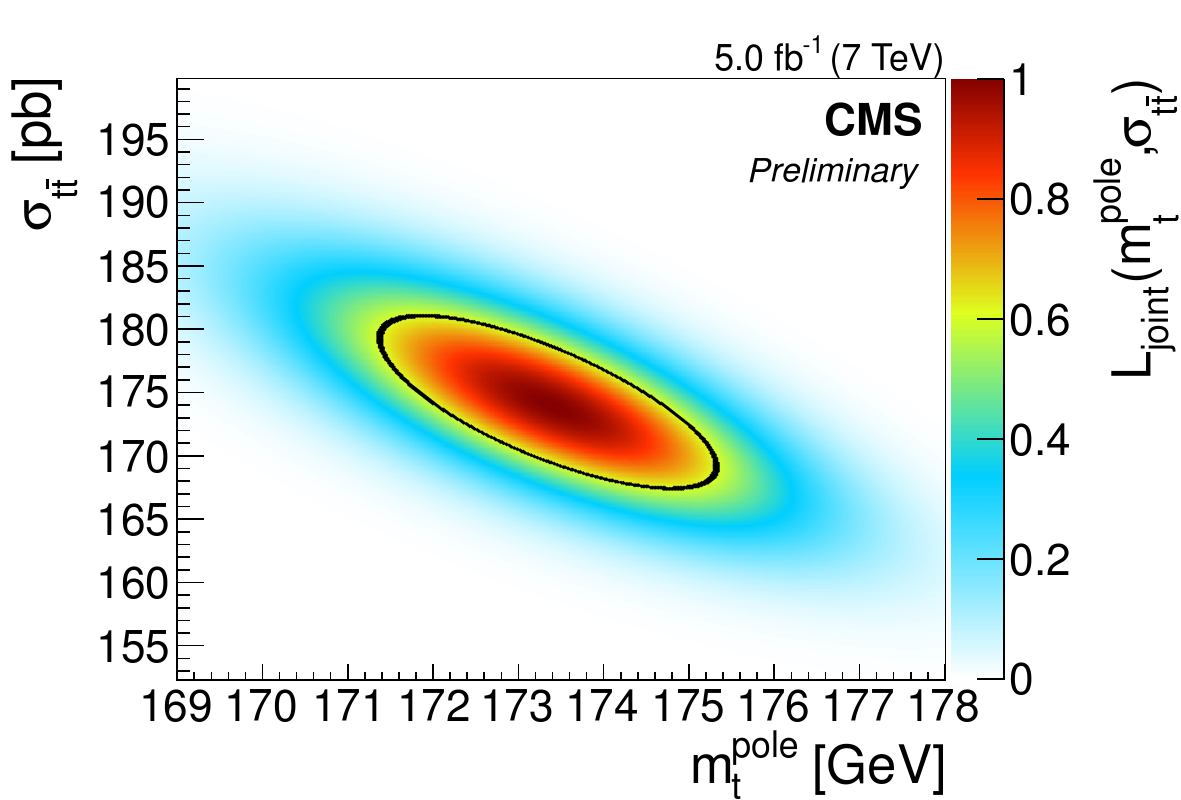
Combined likelihood of the measured and predicted dependence of the $ \mathrm { t \bar{t} } $ production cross section on the top quark mass for 7 (a) and 8 TeV (b). The total 1$\sigma $-uncertainty is indicated by a black contour. The prediction is determined with TOP++ employing the NNPDF3.0 PDF set. |
png ; pdf |
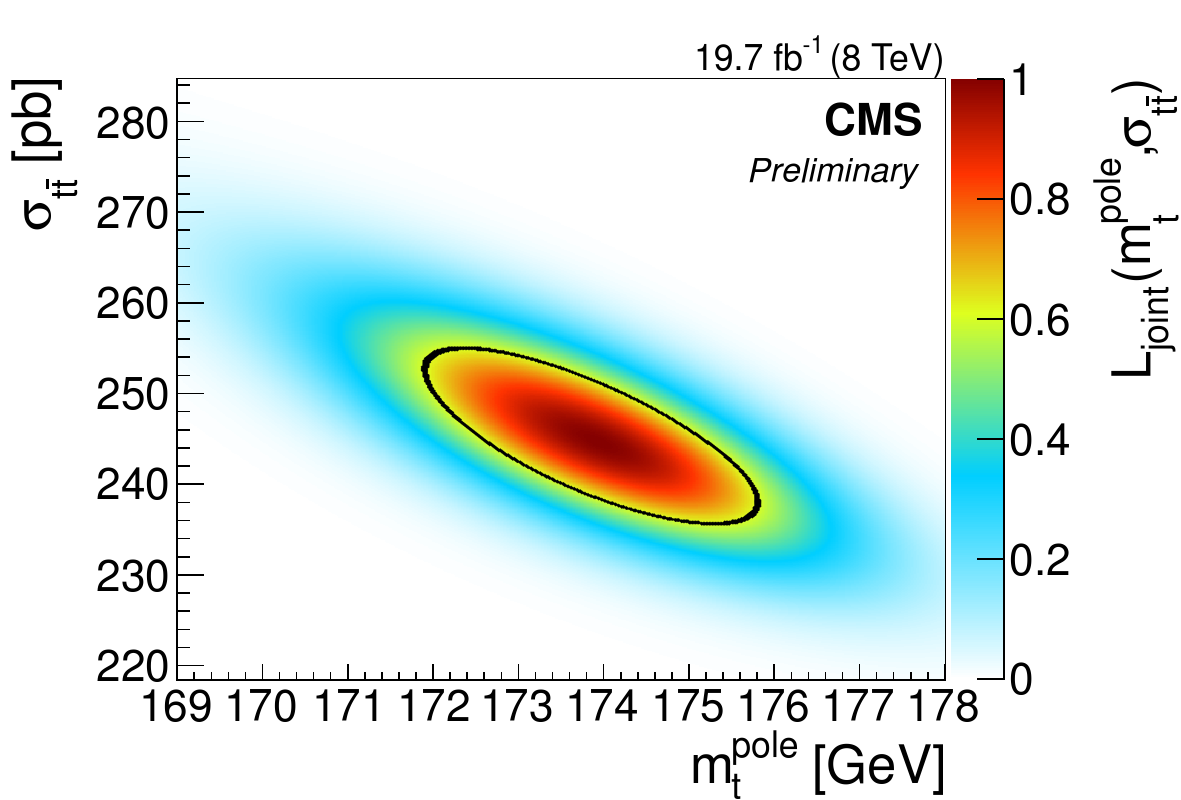
Figure 10-b:
Combined likelihood of the measured and predicted dependence of the $ \mathrm { t \bar{t} } $ production cross section on the top quark mass for 7 (a) and 8 TeV (b). The total 1$\sigma $-uncertainty is indicated by a black contour. The prediction is determined with TOP++ employing the NNPDF3.0 PDF set. |
png ; pdf |
Figure 11:
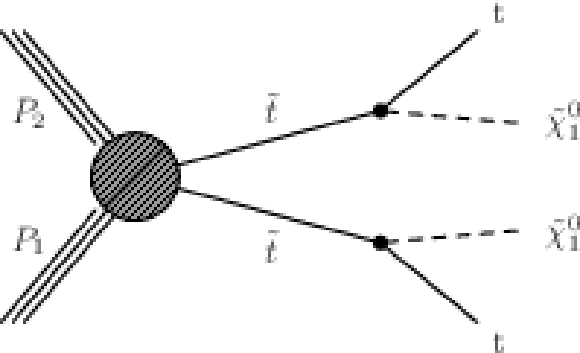
Diagram displaying the top squark pair production at the LHC in the decay mode where each top squark decays with a 100% branching fraction to a top quark and the LSP. The lightest neutralino $\tilde{\chi }_{1}^{0}$ is considered as the LSP. |
png ; pdf |
Figure 12-a:
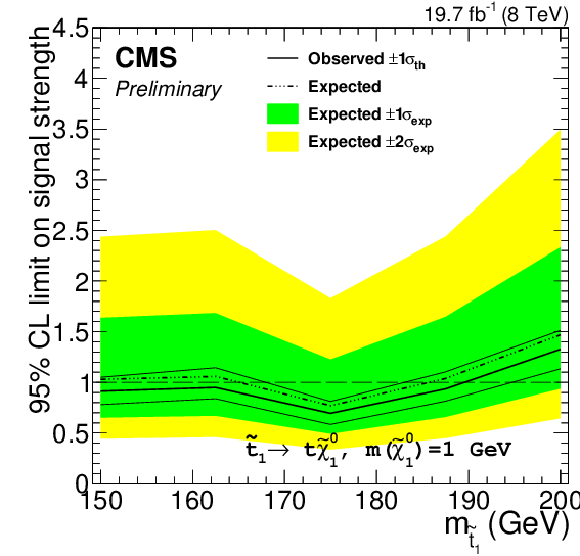
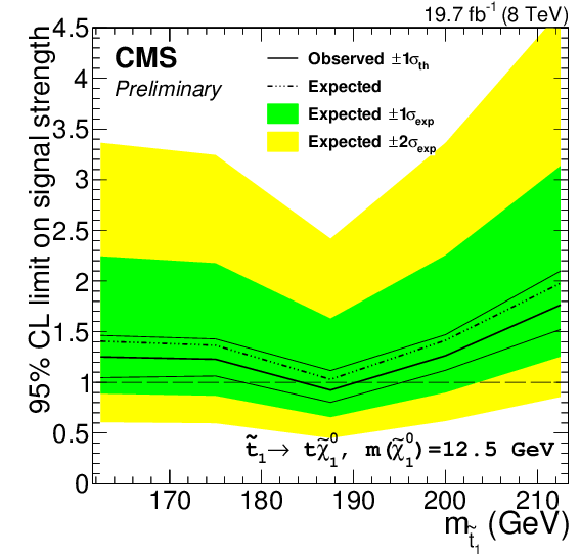
Expected and observed limits at 95% CL on the signal strength as a function of the stop quark mass for different neutralino masses. |
png ; pdf |
Figure 12-b:
Expected and observed limits at 95% CL on the signal strength as a function of the stop quark mass for different neutralino masses. |

|
Compact Muon Solenoid LHC, CERN |

|

|

|

|

|

|