

Compact Muon Solenoid
LHC, CERN
| CMS-PAS-SMP-14-019 | ||
| Measurement of the production cross section for $\mathrm{Z} \gamma \to \nu \bar{\nu} \gamma $ in pp collisions at $\sqrt{s} =$ 8 TeV and limits on $\mathrm{Z Z} \gamma$ and $\mathrm{Z} \gamma \gamma$ triple gauge boson couplings | ||
| CMS Collaboration | ||
| July 2015 | ||
| Abstract: A measurement of the $\mathrm{ Z } \gamma \rightarrow \nu \bar{\nu} \gamma$ cross section in pp collisions at $\sqrt{s} =$ 8 TeV is presented, using data corresponding to an integrated luminosity of 19.6 fb$^{-1}$ collected with the CMS detector at the LHC. This measurement is based on the observation of events with missing transverse momentum above 140 GeV and a single photon with transverse momentum above 145 GeV and absolute pseudorapidity range $|\eta| < 1.44$. The measured $\mathrm{ Z } \gamma \rightarrow \nu \bar{\nu} \gamma$ production cross section, 52.7 $\pm$ 2.1 (stat.) $\pm$ 6.4 (syst.) $\pm$ 1.4 (lumi.) fb, agrees well with the standard model prediction of 50.0$^{+2.4}_{-2.2}$ fb. The results yield the most stringent limits to date on the anomalous $\mathrm{ZZ} \gamma$ and $\mathrm{Z}\gamma\gamma$ trilinear gauge boson couplings. | ||
|
Links:
CDS record (PDF) ;
Public twiki page ;
CADI line (restricted) ; Figures are also available from the CDS record. These preliminary results are superseded in this paper, PLB 760 (2016) 448. |
||
| Figures | |
png ; pdf |
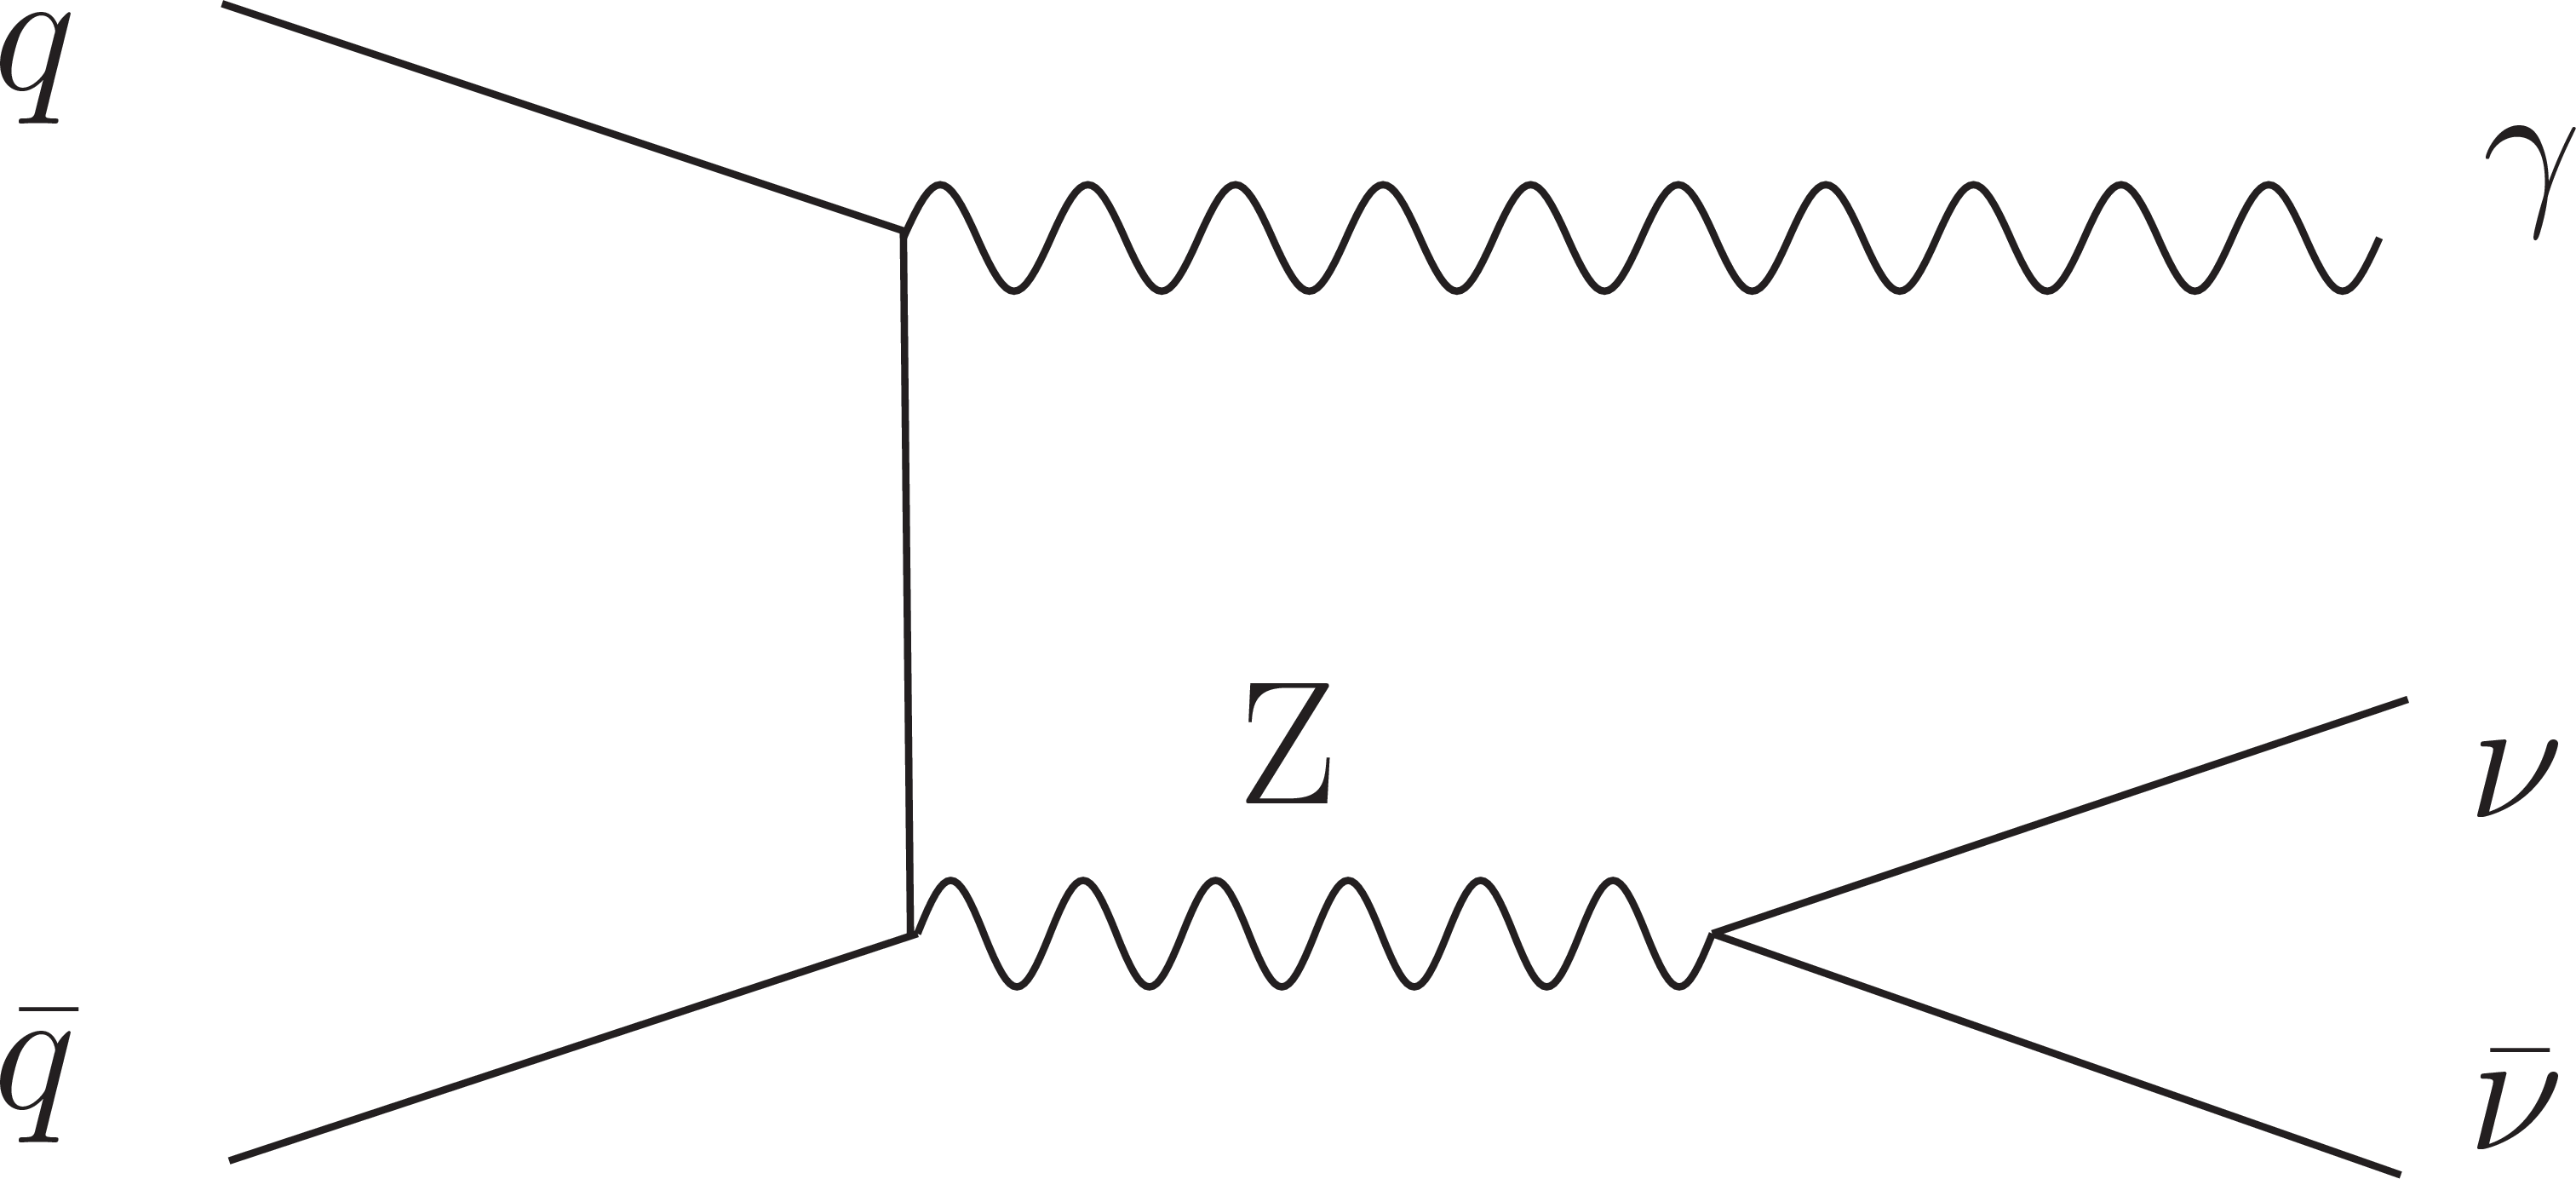
Figure 1-a:
Feynman diagrams of $ {\mathrm {Z}}\gamma $ production via initial state radiation in the SM at tree level (a) and via anomalous $ {\mathrm {Z}} {\mathrm {Z}}\gamma $ and $ {\mathrm {Z}}\gamma \gamma $ trilinear gauge couplings (b). |
png ; pdf |
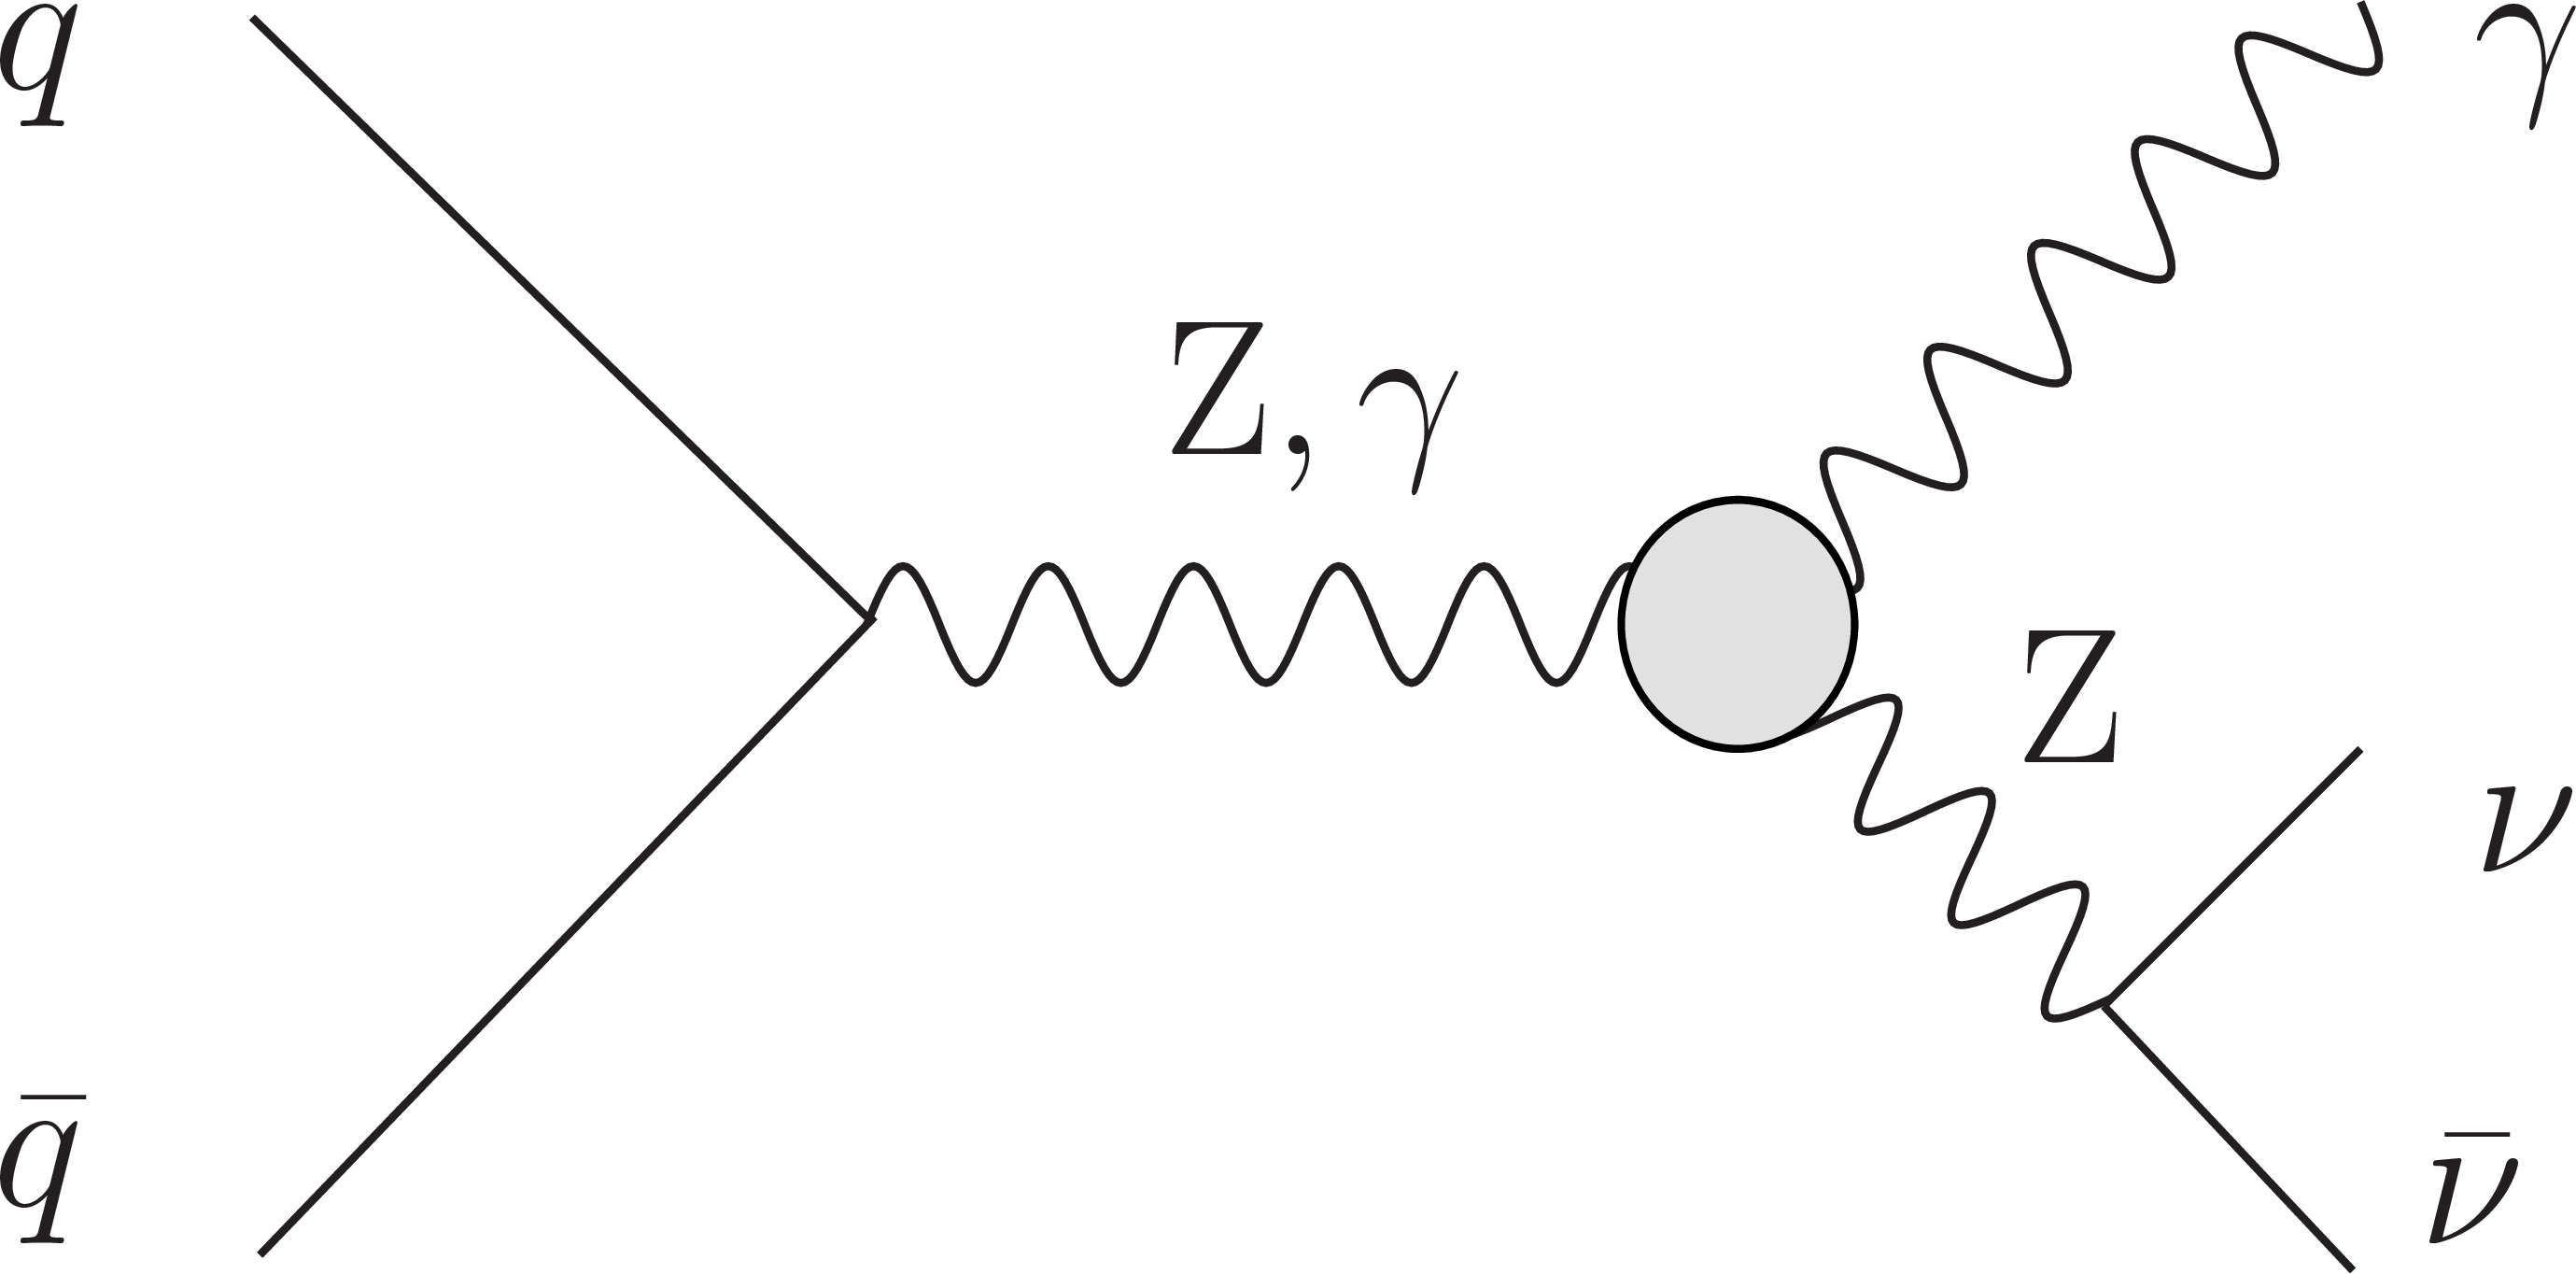
Figure 1-b:
Feynman diagrams of $ {\mathrm {Z}}\gamma $ production via initial state radiation in the SM at tree level (a) and via anomalous $ {\mathrm {Z}} {\mathrm {Z}}\gamma $ and $ {\mathrm {Z}}\gamma \gamma $ trilinear gauge couplings (b). |

png ; pdf |
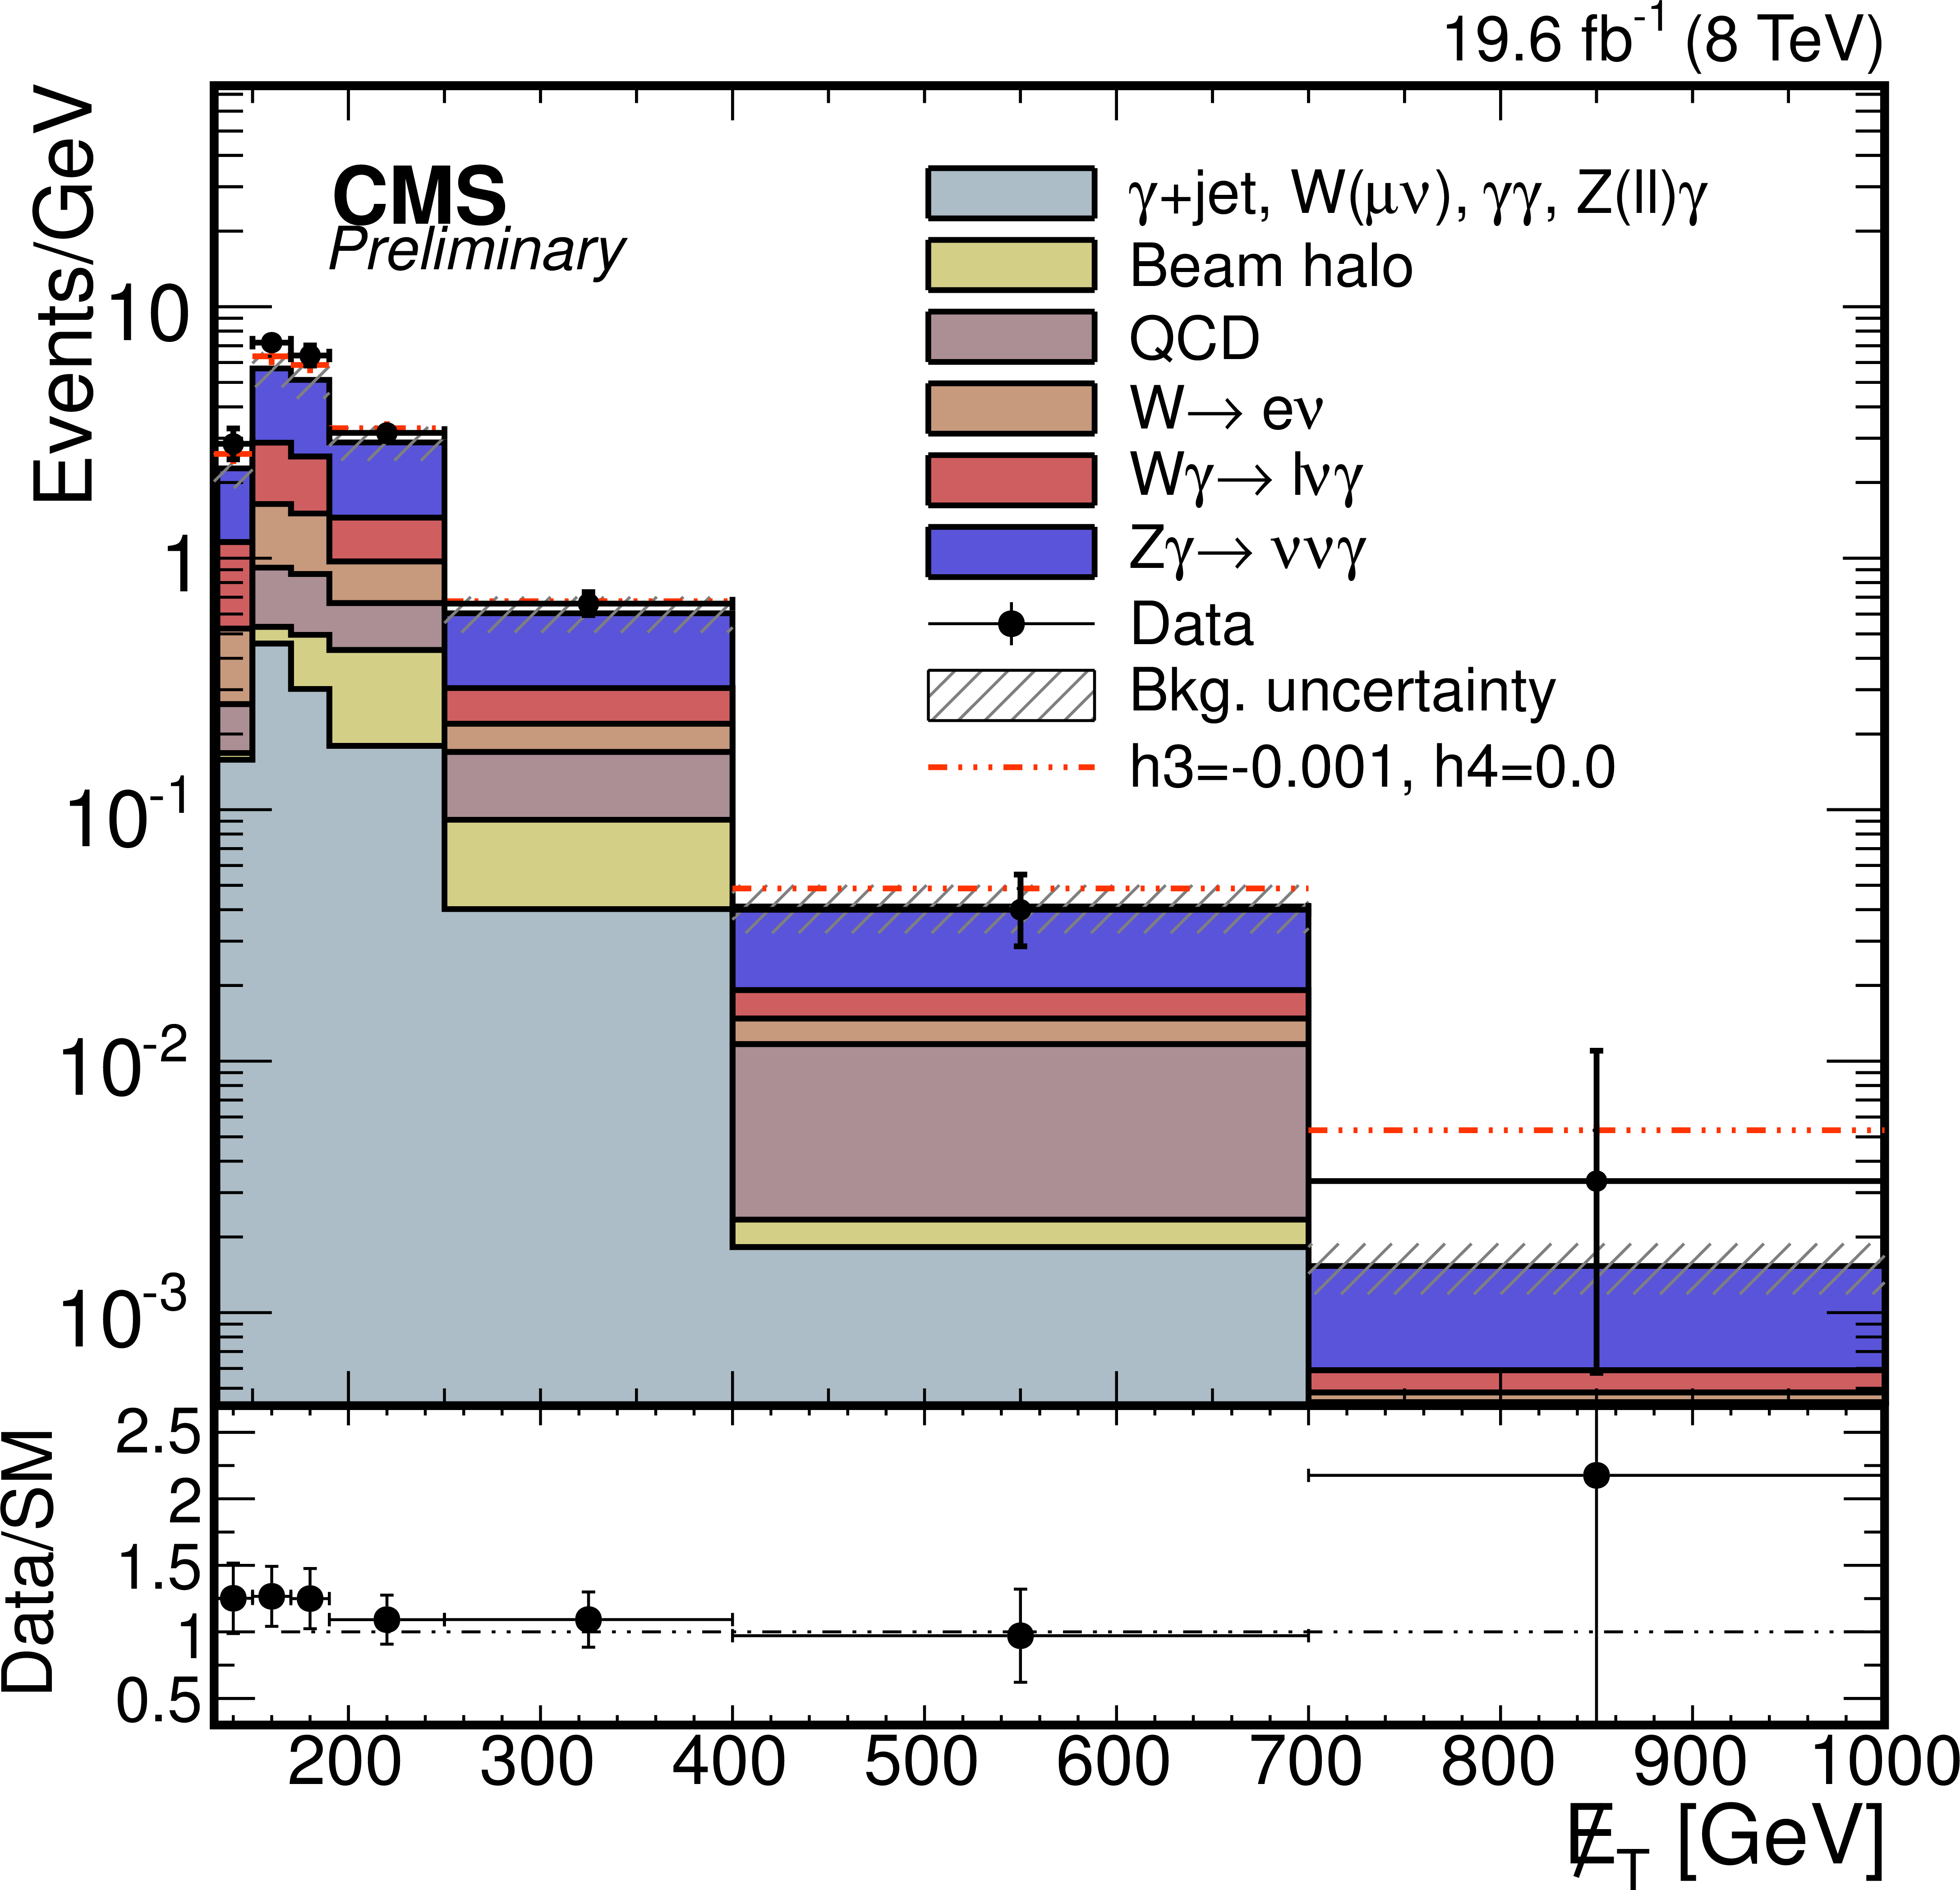
Figure 2-a:
The $E_\mathrm {T}^{\gamma }$ and $ {E_{\mathrm {T}}} $ distributions in data (points with error bars) compared with the SM $Z {\gamma }\rightarrow {\nu } {\overline {\nu }} {\gamma }$ signal and estimated contributions from backgrounds. A typical anomalous TGC signal would provide an excess, as shown in the dot-dashed histogram. The background uncertainty includes statistical and systematic components. |
png ; pdf |
Figure 2-b:
The $E_\mathrm {T}^{\gamma }$ and $ {E_{\mathrm {T}}} $ distributions in data (points with error bars) compared with the SM $Z {\gamma }\rightarrow {\nu } {\overline {\nu }} {\gamma }$ signal and estimated contributions from backgrounds. A typical anomalous TGC signal would provide an excess, as shown in the dot-dashed histogram. The background uncertainty includes statistical and systematic components. |

png ; pdf |
Figure 3:
Two-dimensional 95% CL limits on $ {\mathrm {Z}} {\mathrm {Z}}\gamma $ couplings. |

png ; pdf |
Figure 4:
Two-dimensional 95% CL limits on $ {\mathrm {Z}}\gamma \gamma $ couplings. |
|
|
Compact Muon Solenoid LHC, CERN |
|

|

|

|

|

|