

Compact Muon Solenoid
LHC, CERN
| CMS-PAS-HIN-15-003 | ||
| Measurement of the $\Upsilon$(nS) polarizations in pp collisions as a function of charged particle multiplicity | ||
| CMS Collaboration | ||
| June 2015 | ||
| Abstract: As a first step in a broad study of QCD medium effects on quarkonium polarization, the polarizations of the $\Upsilon$(1S), $\Upsilon$(2S), and $\Upsilon$(3S) mesons are measured in proton-proton collisions at $\sqrt{s} =$ 7 TeV as a function of the charged particle multiplicity, $N_{\mathrm {ch}}$. The measurements are performed using a dimuon data sample collected in 2011 by the CMS experiment, corresponding to an integrated luminosity of 4.9 fb$^{-1}$. The results are extracted from the analysis of the dimuon decay angular distributions, analyzed in three different polarization frames; they are presented as a function of $N_{\mathrm {ch}}$, for two ranges in $\Upsilon$ transverse momentum (10 $< p_{\mathrm {T} } <$ 15 and 15 $< p_{\mathrm {T}} <$ 35 GeV), integrated within the rapidity range $|y|<$ 1.2. The measurement of the polarization parameters $\lambda_\vartheta$, $\lambda_\varphi$ and $\lambda_{\vartheta\varphi}$ is complemented by the determination of the frame-invariant quantity $\tilde{\lambda}$, which provides a very useful intrinsic test of the reliability of the whole analysis chain. The polarizations do not show significant changes as a function of $N_{\mathrm{ ch} }$, excluding strong changes of the production processes between low- and high-multiplicity pp collisions. | ||
|
Links:
CDS record (PDF) ;
Public twiki page ;
CADI line (restricted) ; Figures are also available from the CDS record. These preliminary results are superseded in this paper, PLB 761 (2016) 31. |
||
| Figures | |
png ; pdf |
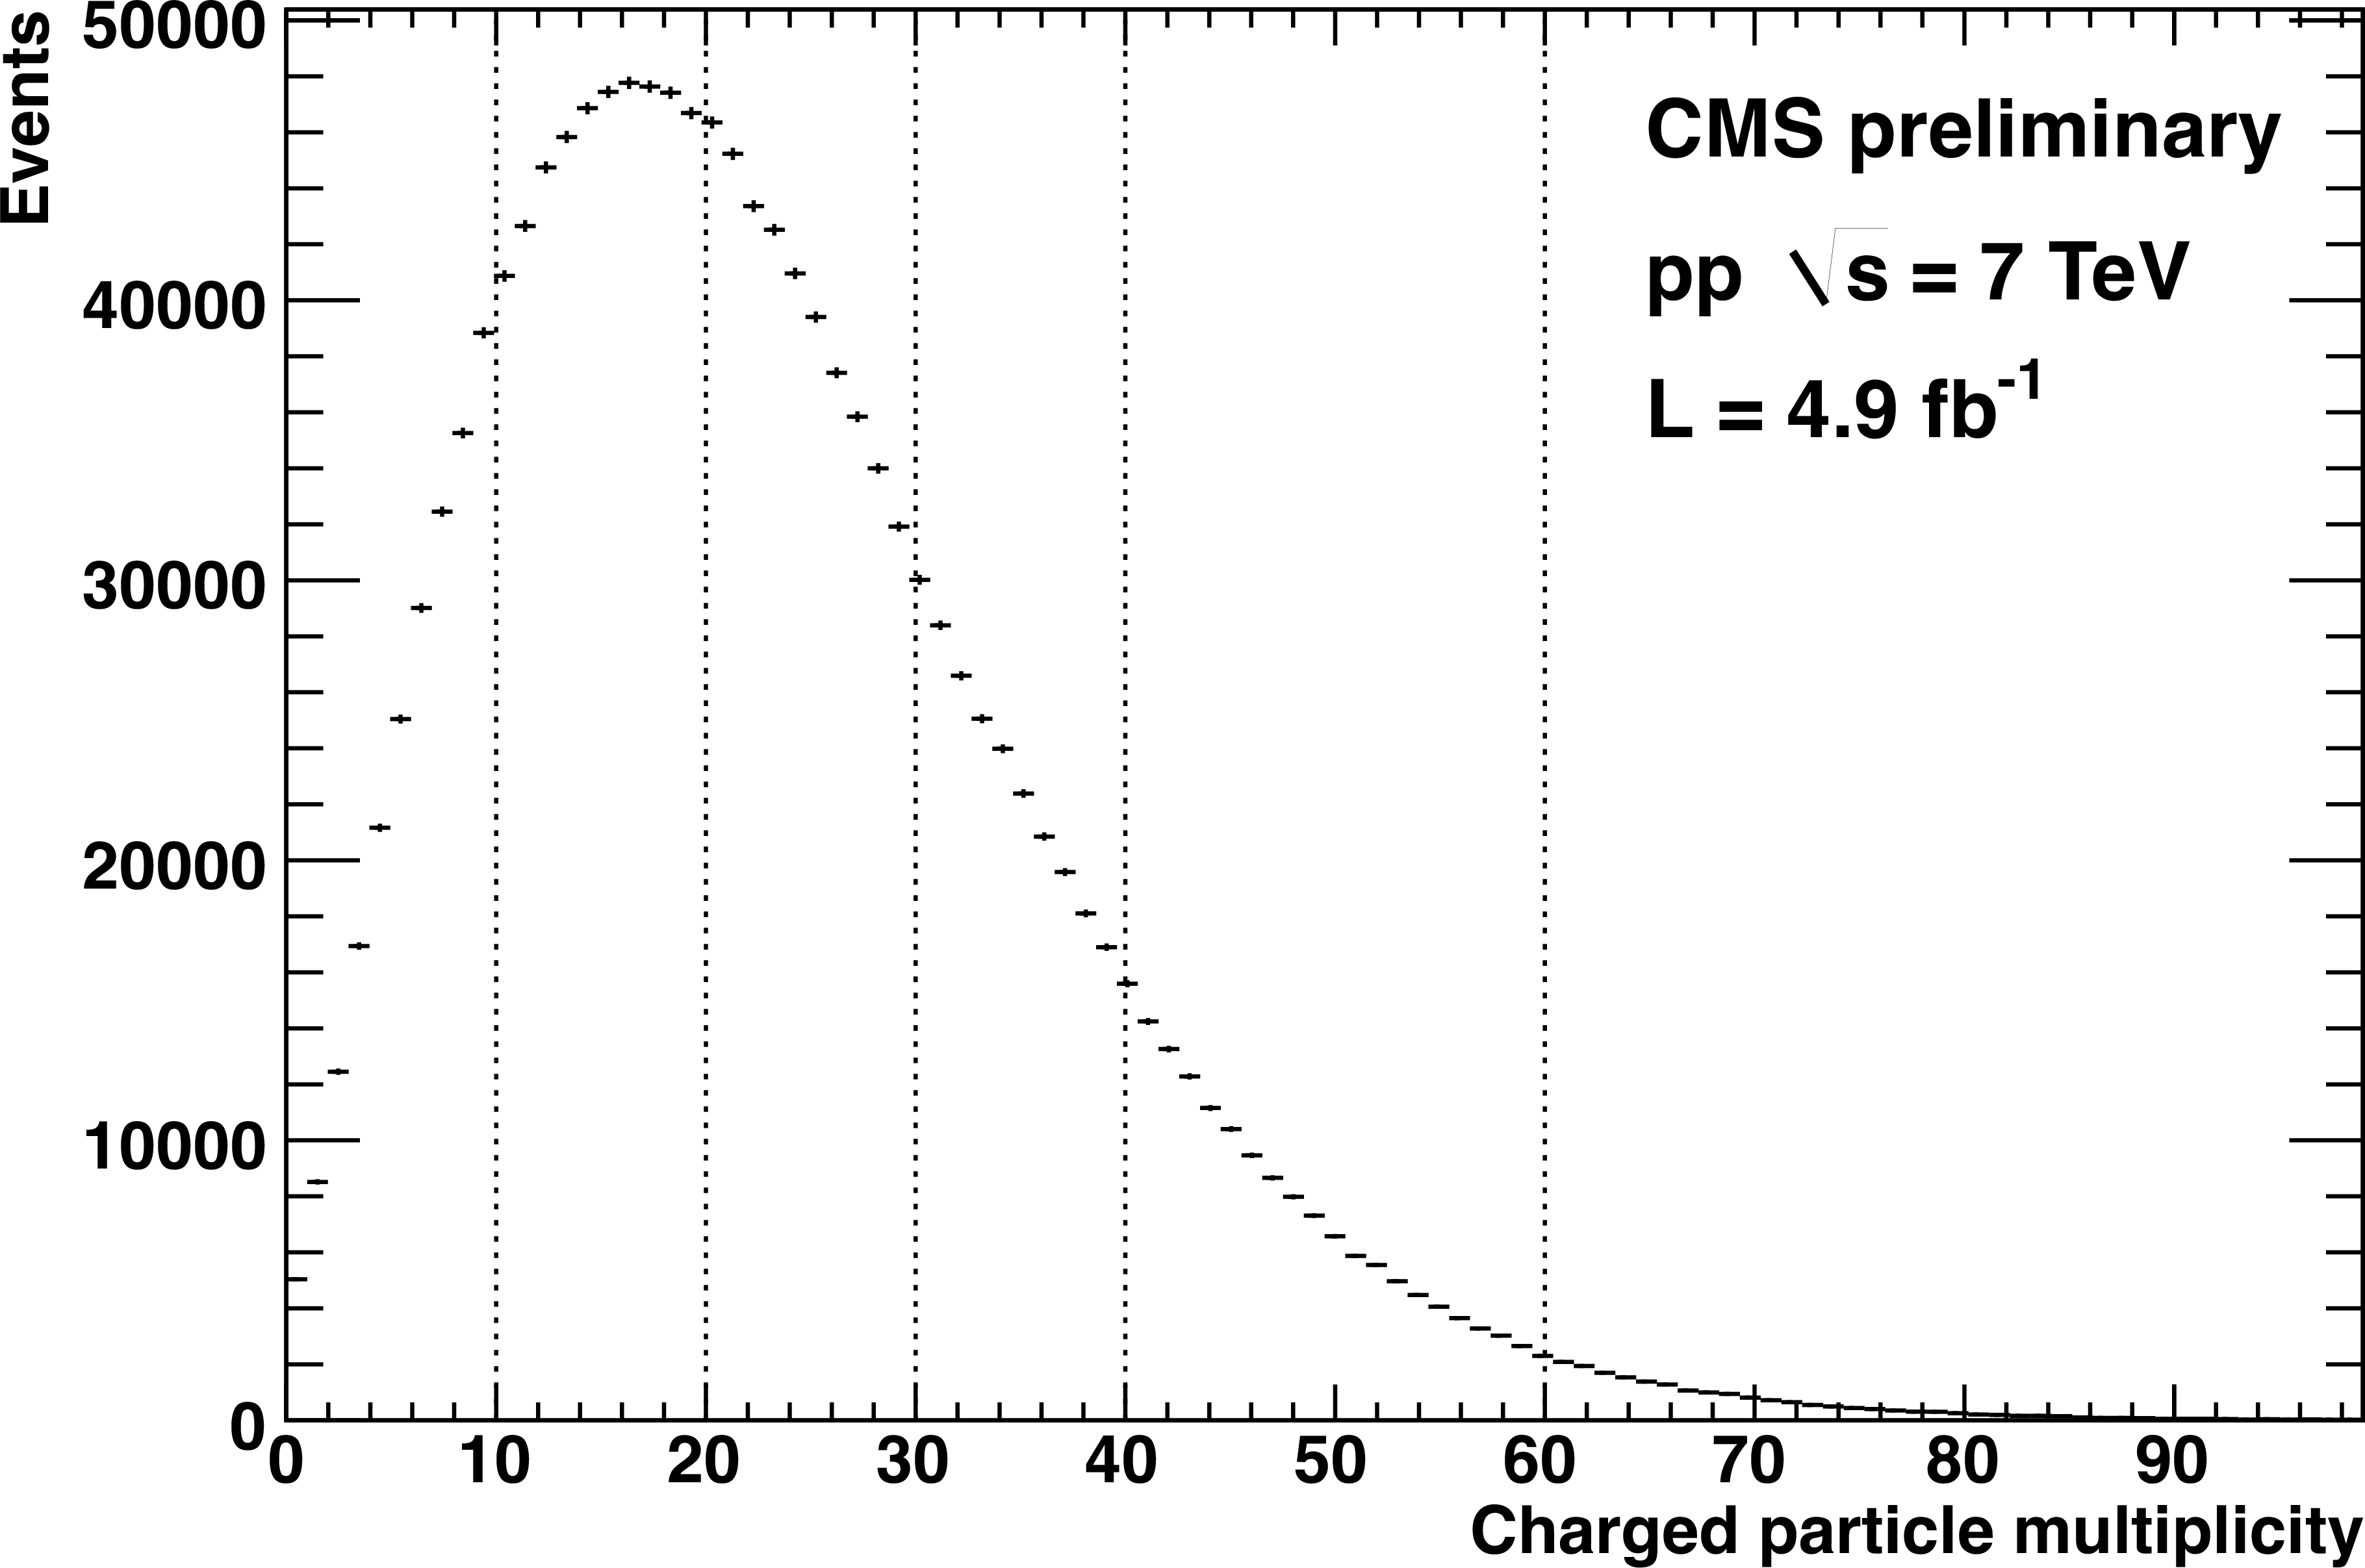
Figure 1:
Charged particle multiplicity distribution of the events selected for the analysis, the five bins being indicated by the vertical dotted lines. |
png ; pdf |
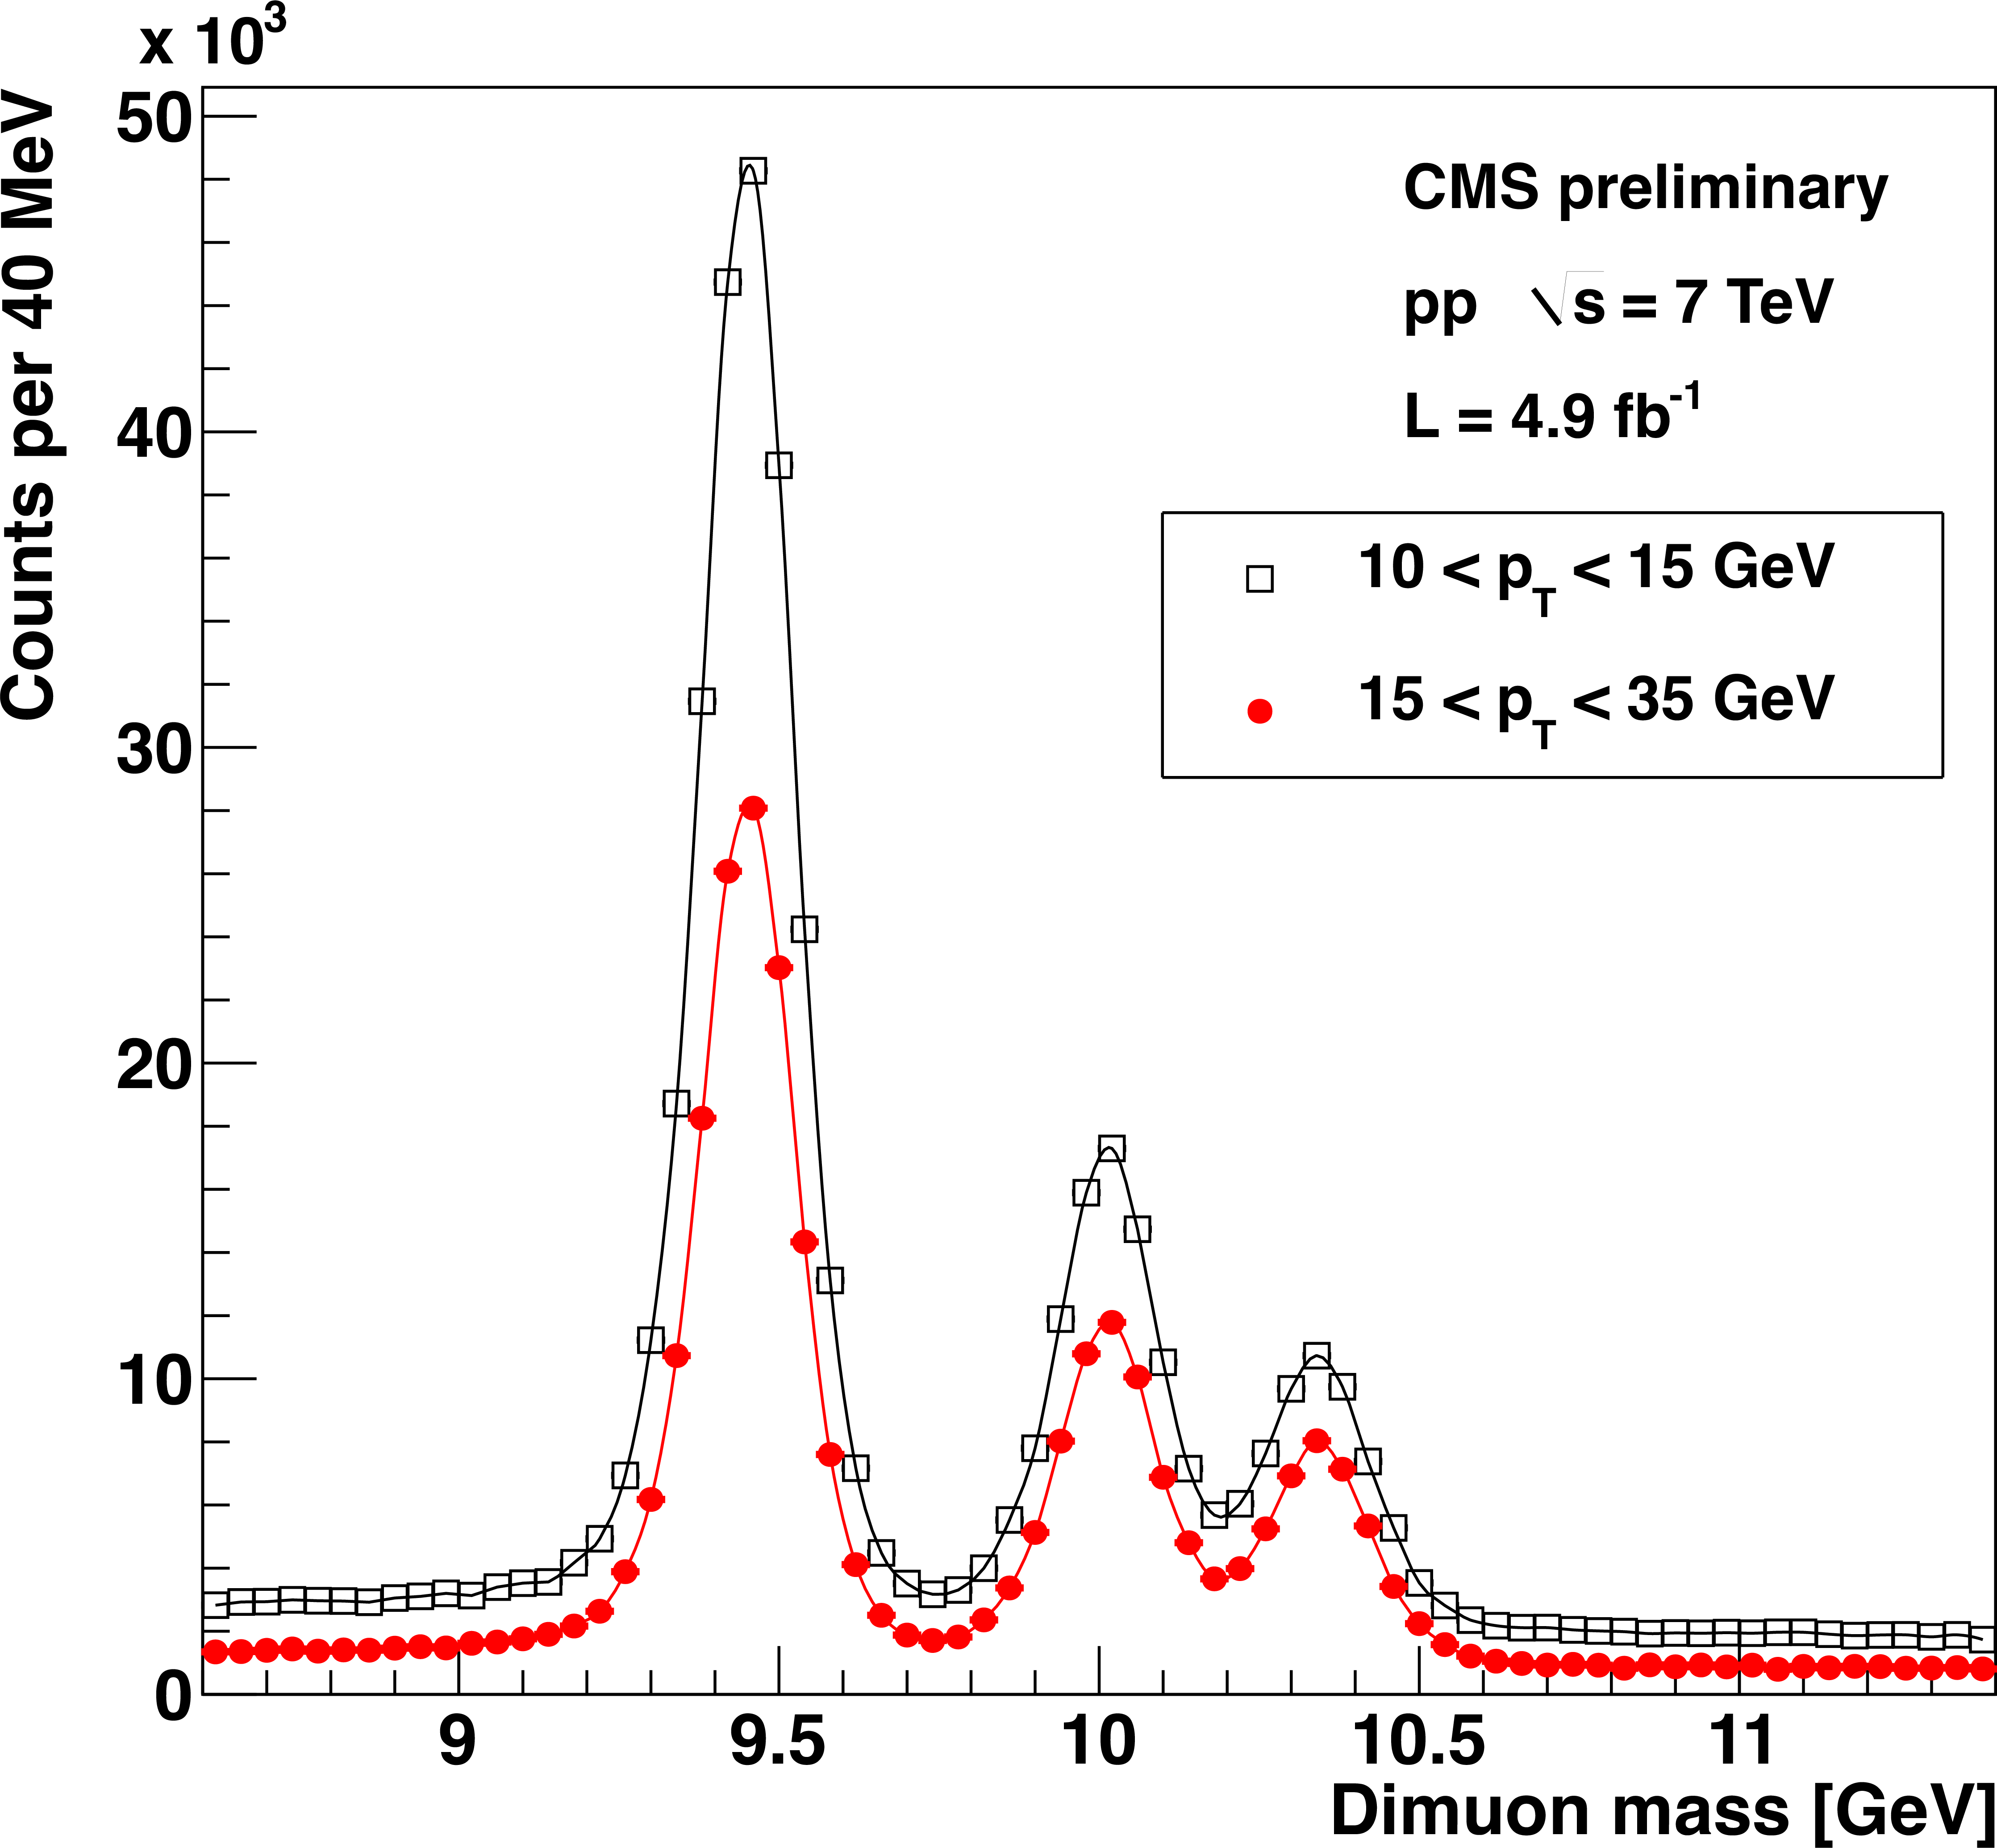
Figure 2:
Dimuon mass distributions in the $\Upsilon $ region for 10 $< {p_{\mathrm {T}}} <$ 15 GeV (open squares) and 15 $< {p_{\mathrm {T}}} <$ 35 GeV (closed circles). |

png ; pdf |
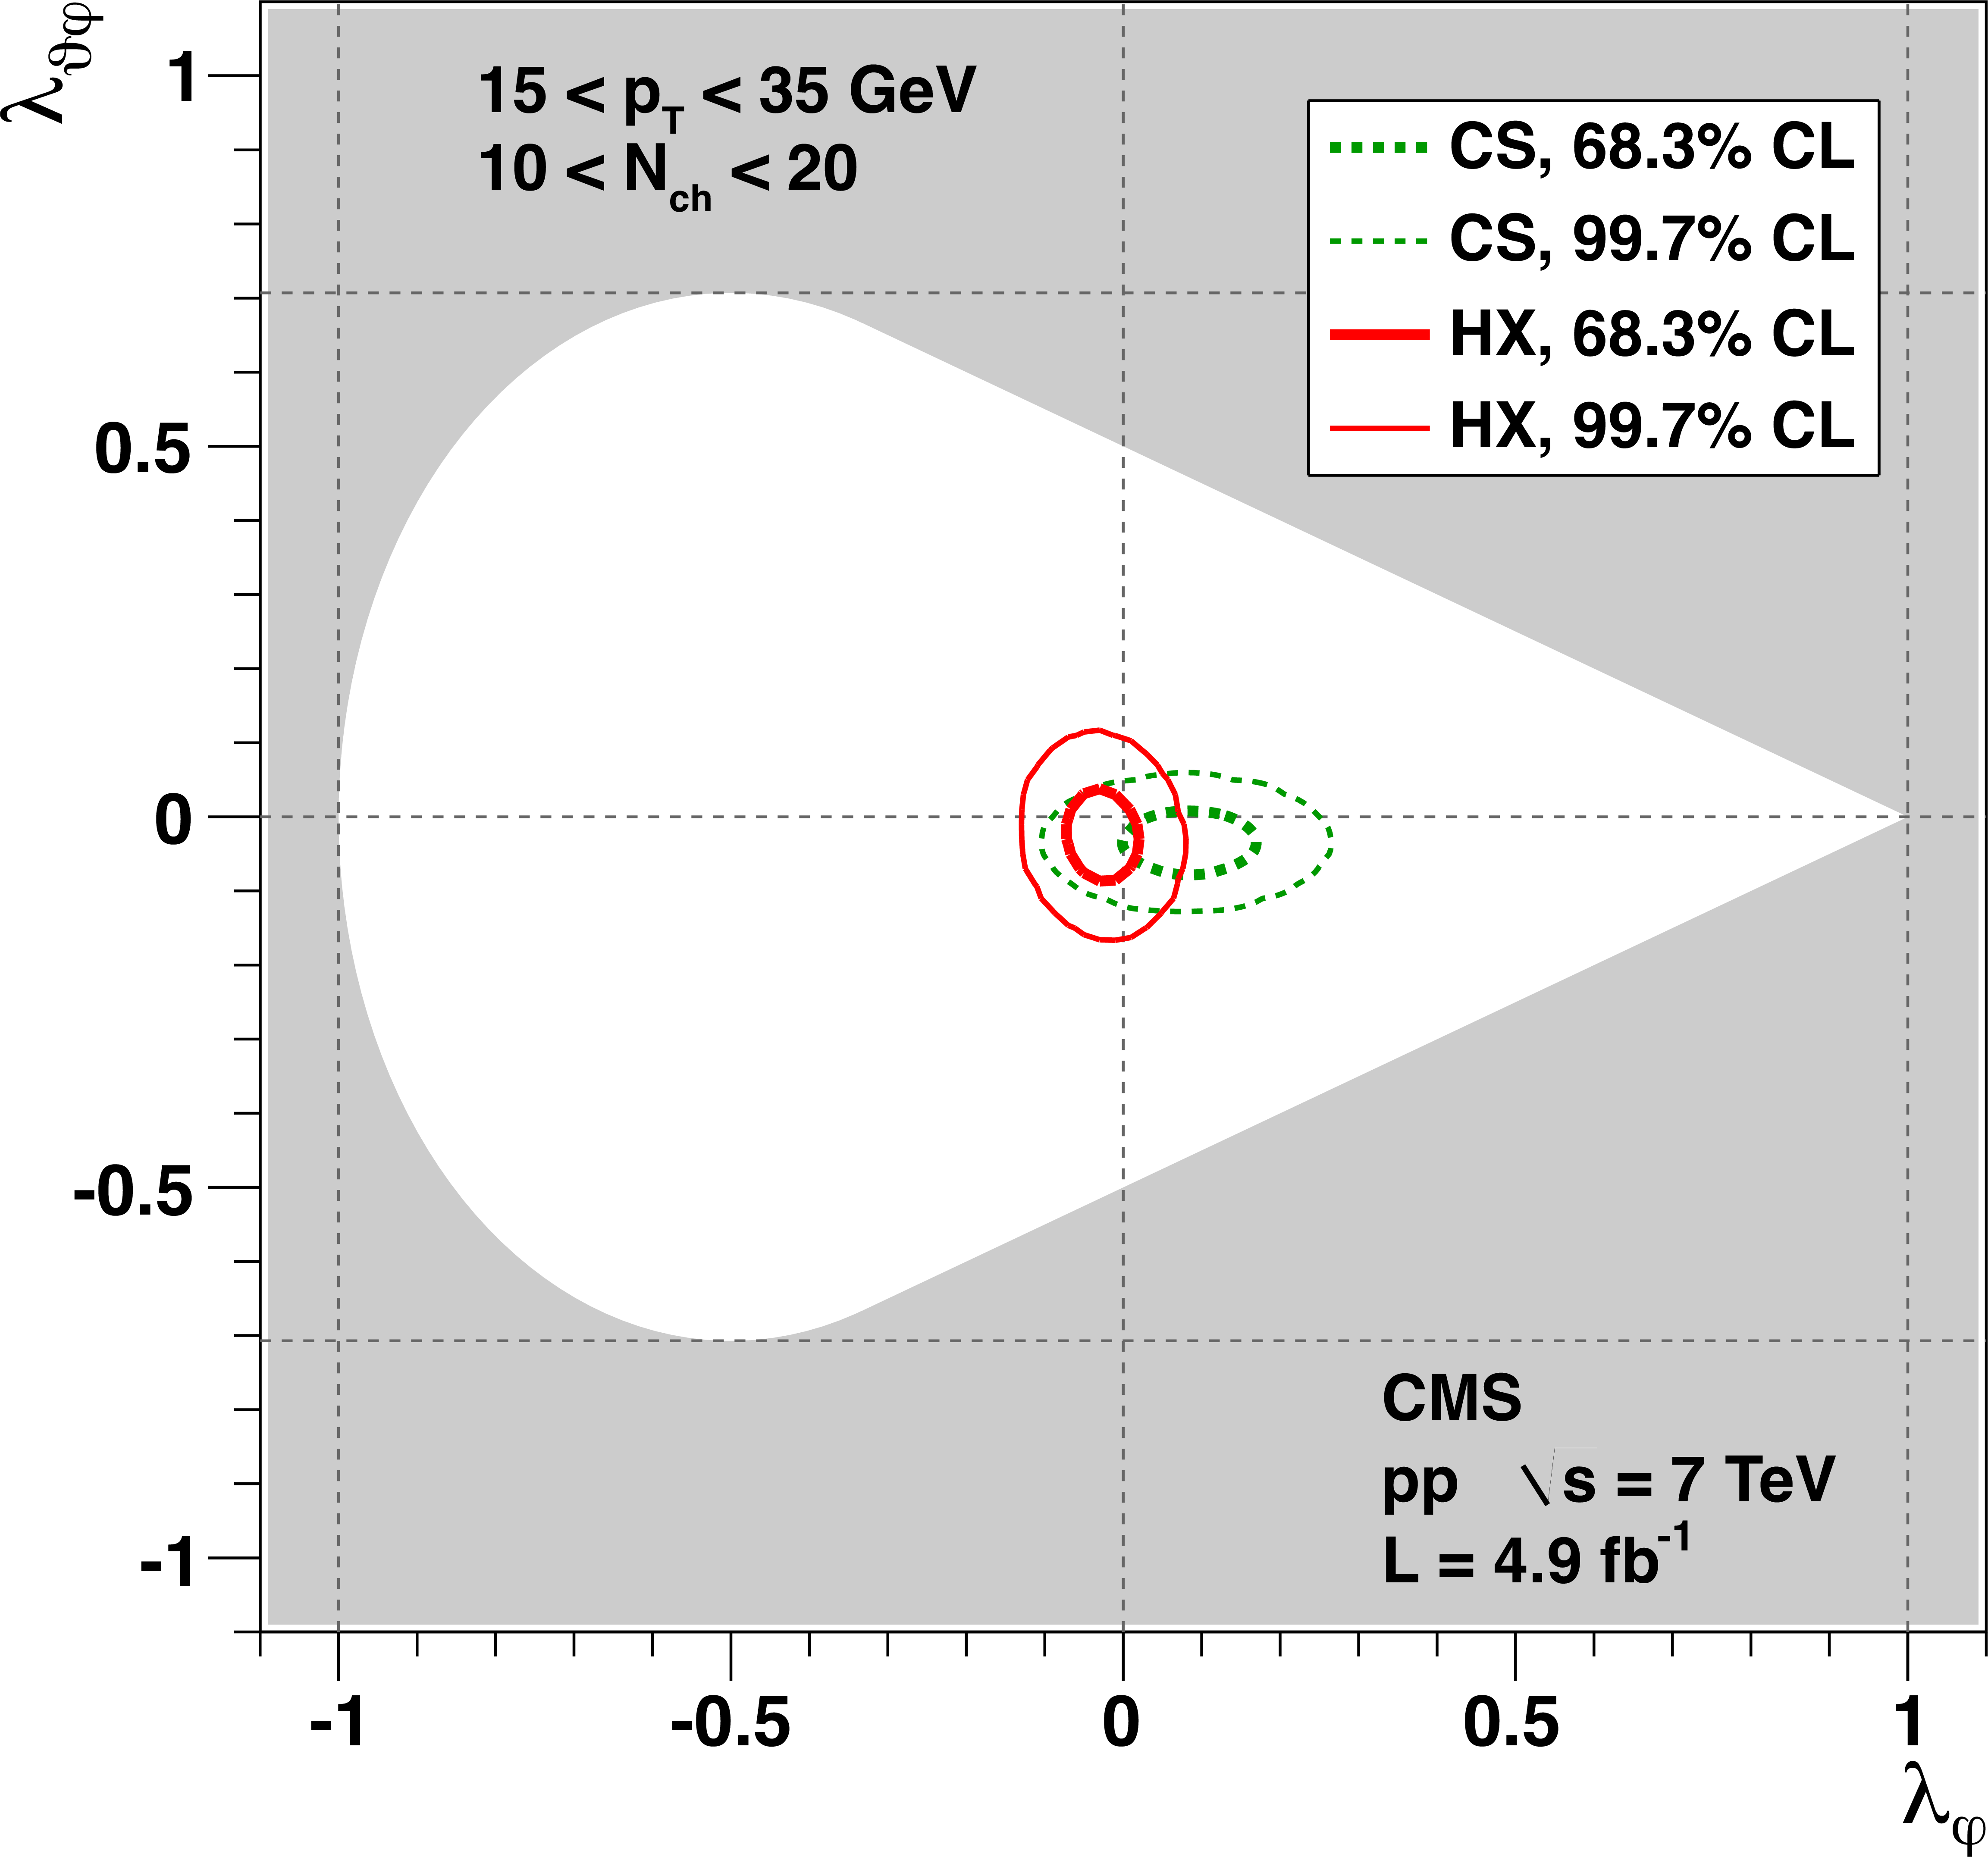
Figure 3-a:
Two-dimensional marginals of the PPD in the $ {\lambda _{\varphi }}$ vs. $ {\lambda _{\vartheta }}$ (a) and $ {\lambda _{\vartheta \varphi }}$ vs. $ {\lambda _{\varphi }}$ (b) planes, for $\Upsilon \mathrm{(2S)} $ with 15 $< {p_{\mathrm {T}}} <$ 35 GeV and 10 $ |
png ; pdf |
Figure 3-b:
Two-dimensional marginals of the PPD in the $ {\lambda _{\varphi }}$ vs. $ {\lambda _{\vartheta }}$ (a) and $ {\lambda _{\vartheta \varphi }}$ vs. $ {\lambda _{\varphi }}$ (b) planes, for $\Upsilon \mathrm{(2S)} $ with 15 $< {p_{\mathrm {T}}} <$ 35 GeV and 10 $ |

png ; pdf |
Figure 4:
Values of the $ {\lambda _{\vartheta }}$ (top), $ {\lambda _{\varphi }}$ (middle), and ${\lambda _{\vartheta \varphi }}$ (bottom) parameters for the $\Upsilon \mathrm{(1S)}$ (left), $\Upsilon \mathrm{(2S)}$ (middle), and $\Upsilon \mathrm{(3S)}$ (right), in the HX frame, as a function of $N_{\rm ch}$, for both $ {p_{\mathrm {T}}} $ ranges. The vertical bars represent the 68.3% CL intervals of the $N_{\rm ch}$-dependent total uncertainties, while the global uncertainties are represented by boxes at the zero horizontal line. The points are placed at the average $N_{\rm ch}$\ of each bin, with a small offset for easier viewing. |

png ; pdf |
Figure 5:
Values of $\tilde{\lambda }$ for the $\Upsilon \mathrm{(1S)}$, $\Upsilon \mathrm{(2S)}$, and $\Upsilon \mathrm{(3S)}$ states (left to right), in the HX, CS, and PX frames, for the 10 $< {p_{\mathrm {T}}} <$ 15 GeV (top) and 15 $< {p_{\mathrm {T}}} <$ 35 GeV (bottom) ranges. The vertical bars represent the 68.3% CL intervals of the $N_{\rm ch}$-dependent total uncertainties, while the global uncertainties are represented by boxes at the zero horizontal line. The points have been slightly offset for easier viewing. |
|
|
Compact Muon Solenoid LHC, CERN |
|

|

|

|

|

|