

Compact Muon Solenoid
LHC, CERN
| CMS-PAS-EXO-15-001 | ||
| Search for Narrow Resonances using the Dijet Mass Spectrum with 40 pb$^{-1}$ of pp Collisions at $\sqrt{s}=$ 13 TeV | ||
| CMS Collaboration | ||
| August 2015 | ||
| Abstract: A search for narrow dijet resonances in proton-proton (pp) collisions at $\sqrt{s}=$ 13 TeV is presented. The dijet mass distribution of the two leading jets is measured with the CMS detector. The data used correspond to an integrated luminosity of 42 pb$^{-1}$ from Run 2 of the LHC. The pseudorapidity separation of the two jets is required to satisfy $|\Delta\eta_{\text{jj}}|<$ 1.3 with each jet inside the region $|\eta| <$ 2.5. The highest observed dijet mass is 5.4 TeV. The spectrum is well described by a smooth parameterization and no significant evidence for new particle production is observed. Upper limits at the 95% confidence level are set on the resonance cross section. By comparing these generic limits with theoretical predictions for the cross section of several models of new particles, lower limits are set on the mass of string resonances, excited quarks, axigluons, colorons, scalar diquarks and color octet scalars. For resonance masses greater than 5 TeV this search is expected to be more sensitive than those in Run 1 of the LHC at $\sqrt{s}=$ 8 TeV. A lower mass limit of 5.1 TeV is set for string resonances which extends previous exclusions from Run 1. | ||
|
Links:
CDS record (PDF) ;
Public twiki page ;
CADI line (restricted) ; Figures are also available from the CDS record. These preliminary results are superseded in this paper, PRL 116 (2016) 071801. |
||
| Figures | |
png ; pdf |
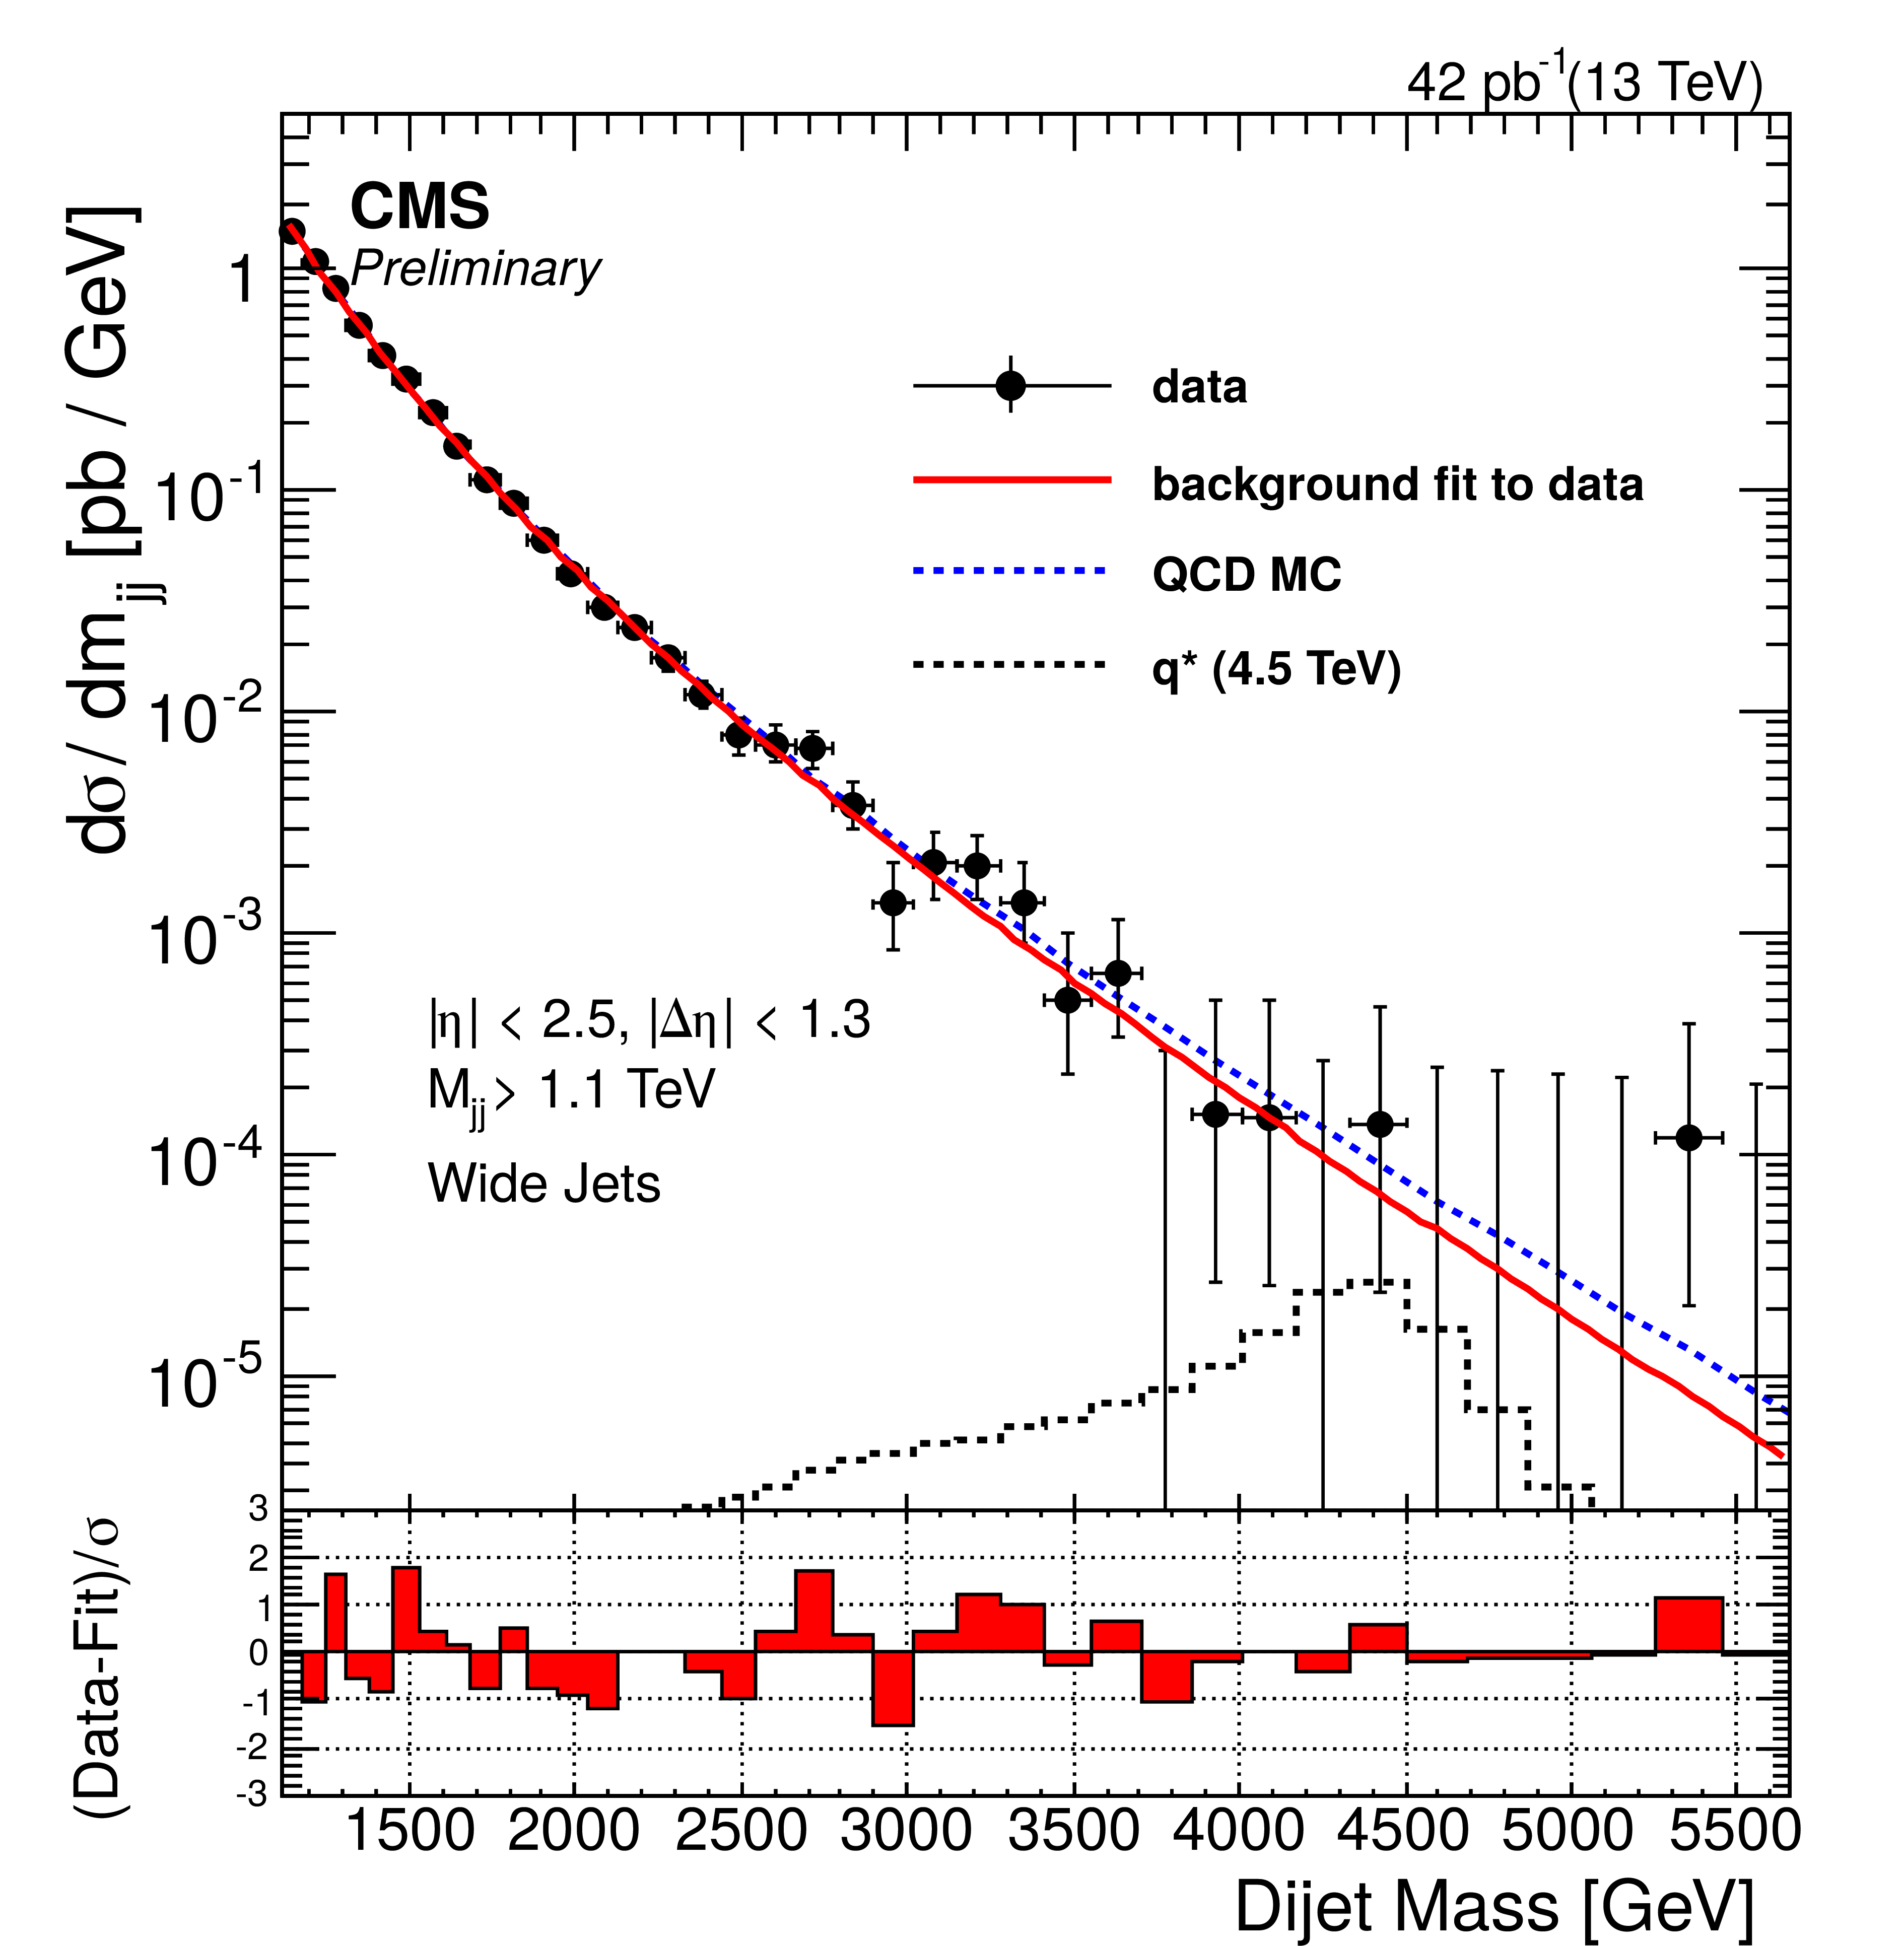
Figure 1:
Dijet mass spectrum from wide jets (points) compared to a smooth fit (solid) and to predictions including detector simulation of QCD (dashed) and an excited quark signal (histogram). The QCD prediction has been normalized to the data. The uncertainty bars are statistical only. The bin-by-bin fit residuals, $\rm{(data-fit)}/\sigma _{\rm {data}}$, are shown at the bottom. |

png ; pdf |
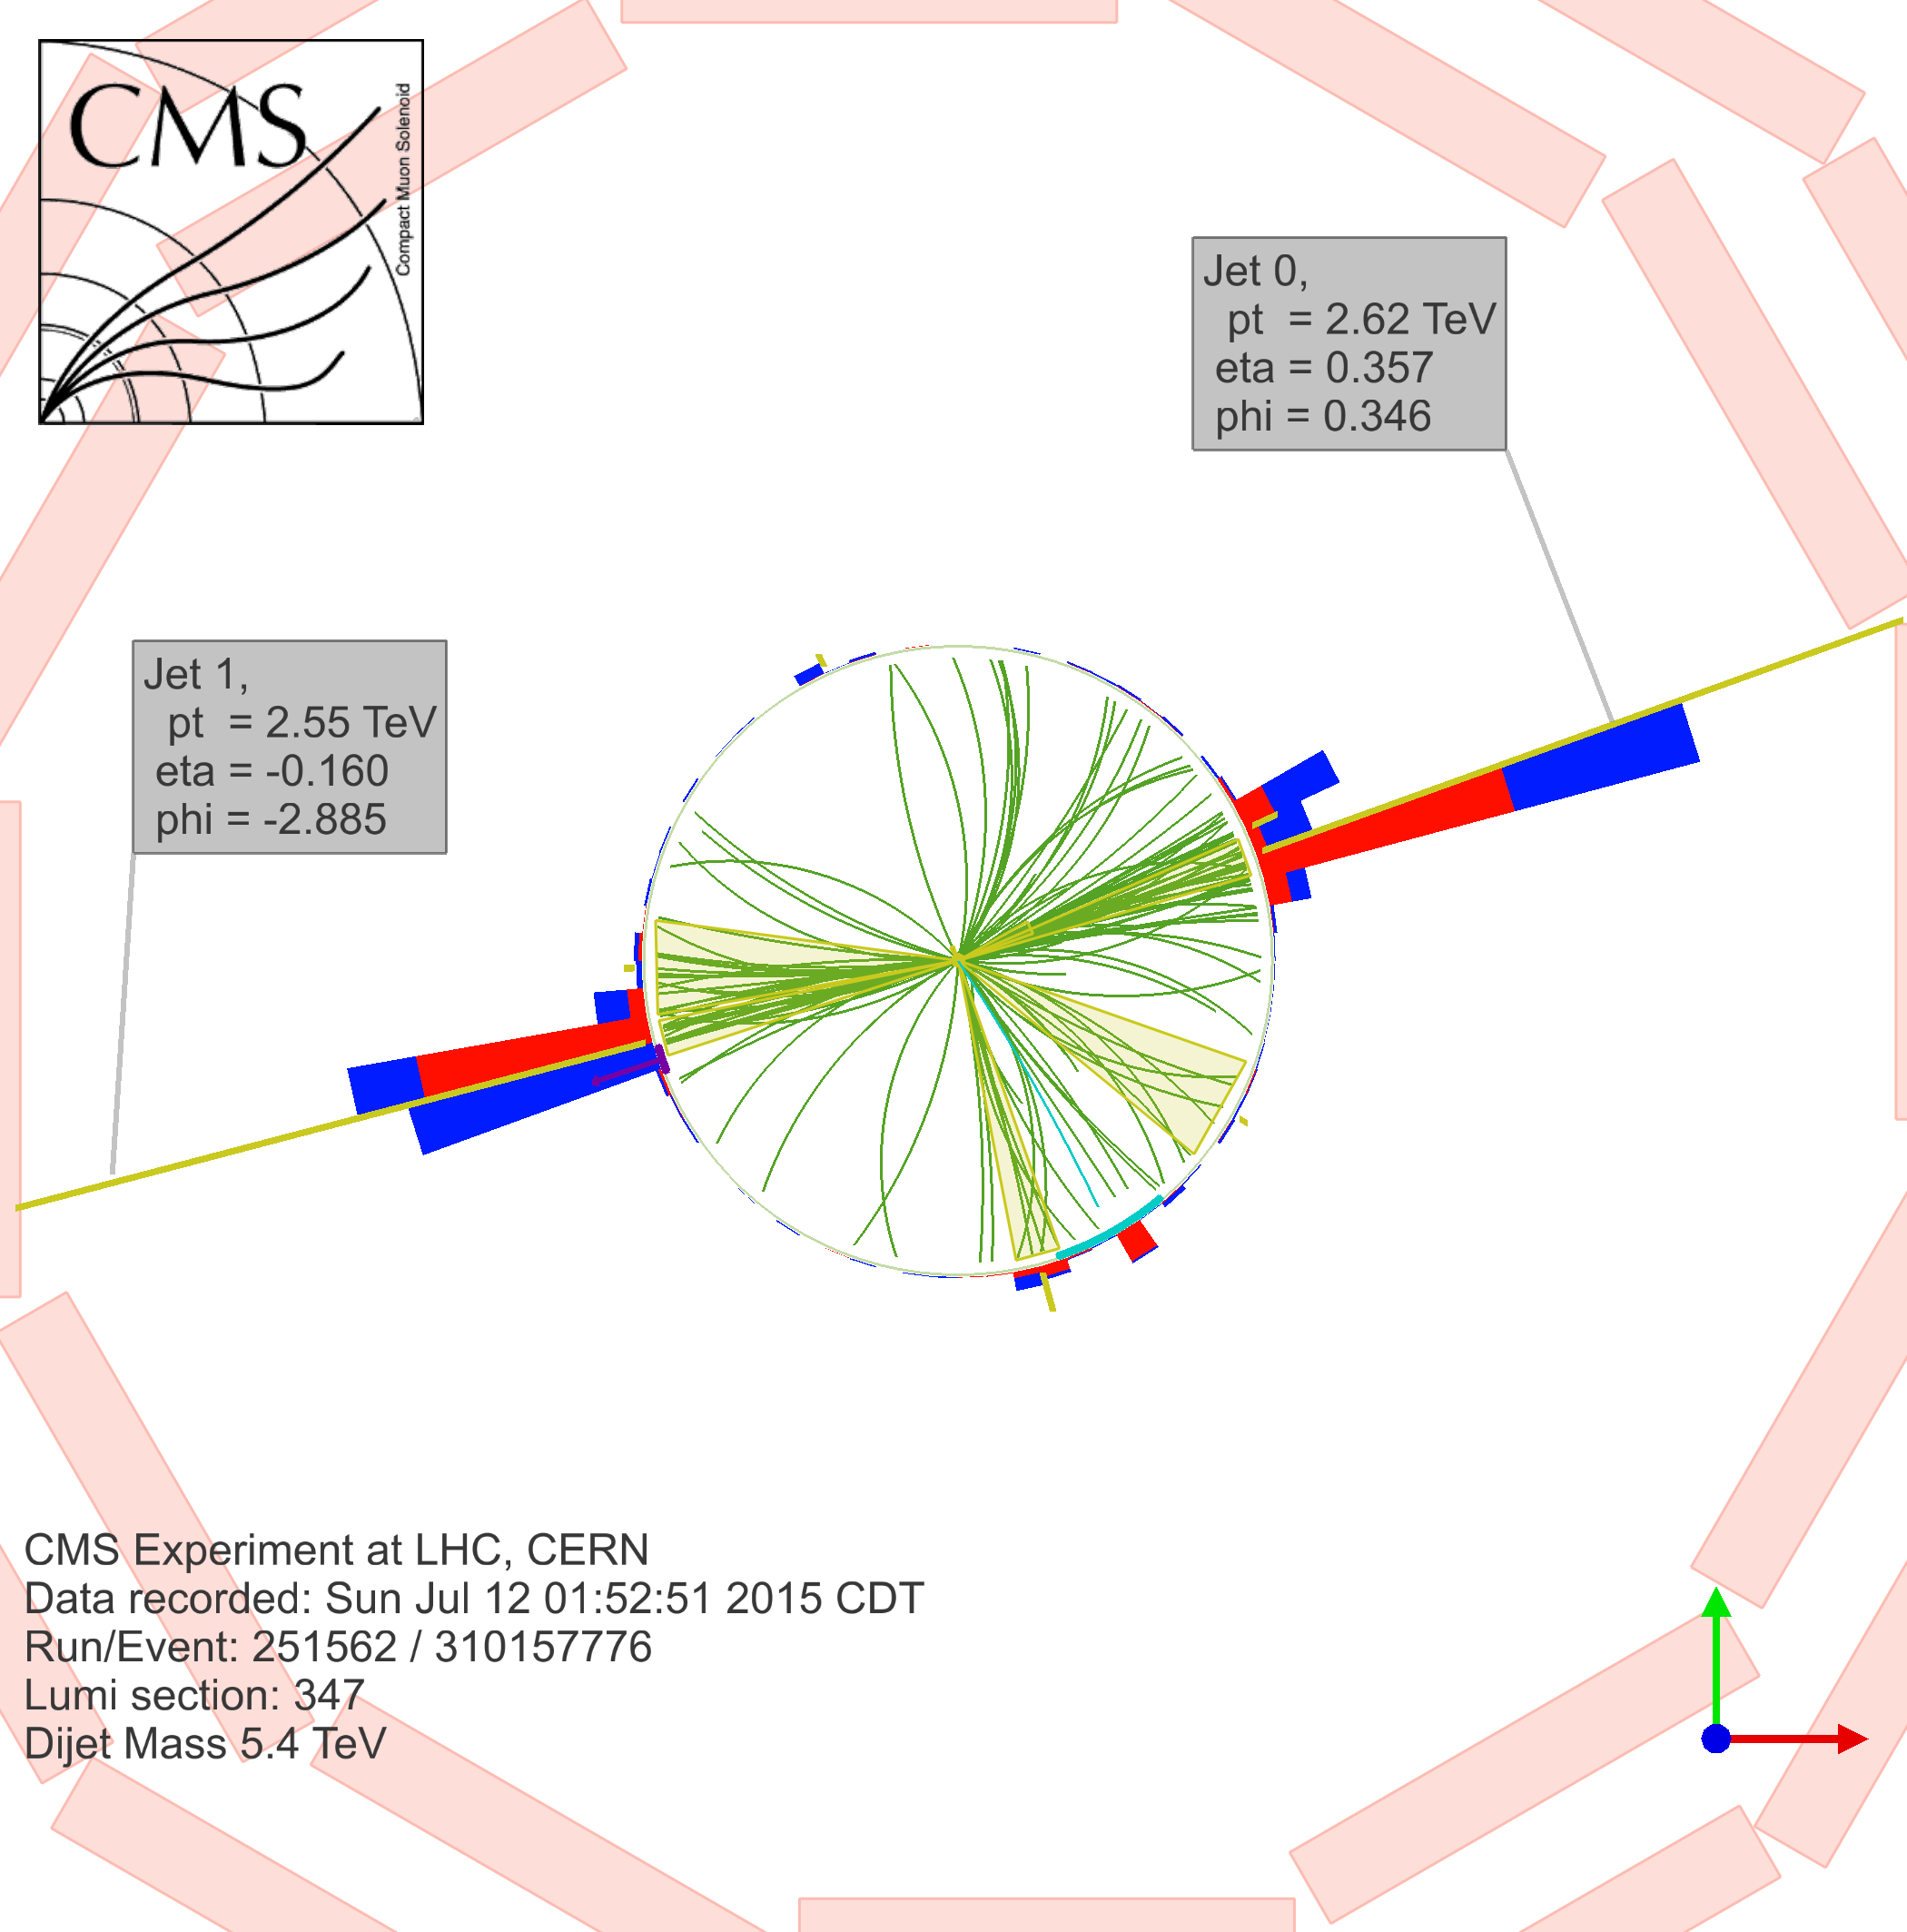
Figure 2-a:
The event with the highest dijet invariant mass: three dimensional view (a), 2D view in the $\rho $-$\phi $ plane (b), plot of transverse energy vs. $\eta $ and $\phi $ (c) and 2D view in the $\rho $-Z plane (d). The $ {p_{\mathrm {T}}} $, $\eta $, and $\phi $ values of the two wide jets are indicated. The invariant mass of the two wide jets is 5.4 TeV . |
png ; pdf |
Figure 2-b:
The event with the highest dijet invariant mass: three dimensional view (a), 2D view in the $\rho $-$\phi $ plane (b), plot of transverse energy vs. $\eta $ and $\phi $ (c) and 2D view in the $\rho $-Z plane (d). The $ {p_{\mathrm {T}}} $, $\eta $, and $\phi $ values of the two wide jets are indicated. The invariant mass of the two wide jets is 5.4 TeV . |
png ; pdf |
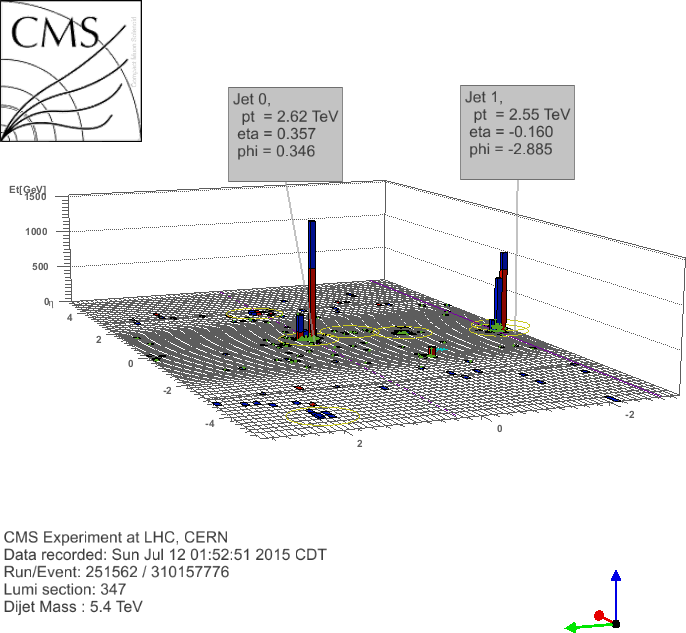
Figure 2-c:
The event with the highest dijet invariant mass: three dimensional view (a), 2D view in the $\rho $-$\phi $ plane (b), plot of transverse energy vs. $\eta $ and $\phi $ (c) and 2D view in the $\rho $-Z plane (d). The $ {p_{\mathrm {T}}} $, $\eta $, and $\phi $ values of the two wide jets are indicated. The invariant mass of the two wide jets is 5.4 TeV . |
png ; pdf |
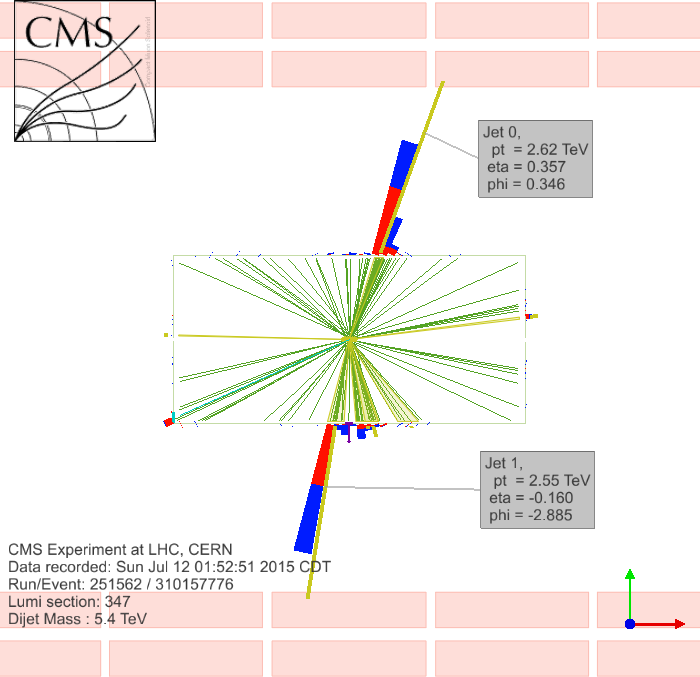
Figure 2-d:
The event with the highest dijet invariant mass: three dimensional view (a), 2D view in the $\rho $-$\phi $ plane (b), plot of transverse energy vs. $\eta $ and $\phi $ (c) and 2D view in the $\rho $-Z plane (d). The $ {p_{\mathrm {T}}} $, $\eta $, and $\phi $ values of the two wide jets are indicated. The invariant mass of the two wide jets is 5.4 TeV . |
png ; pdf |
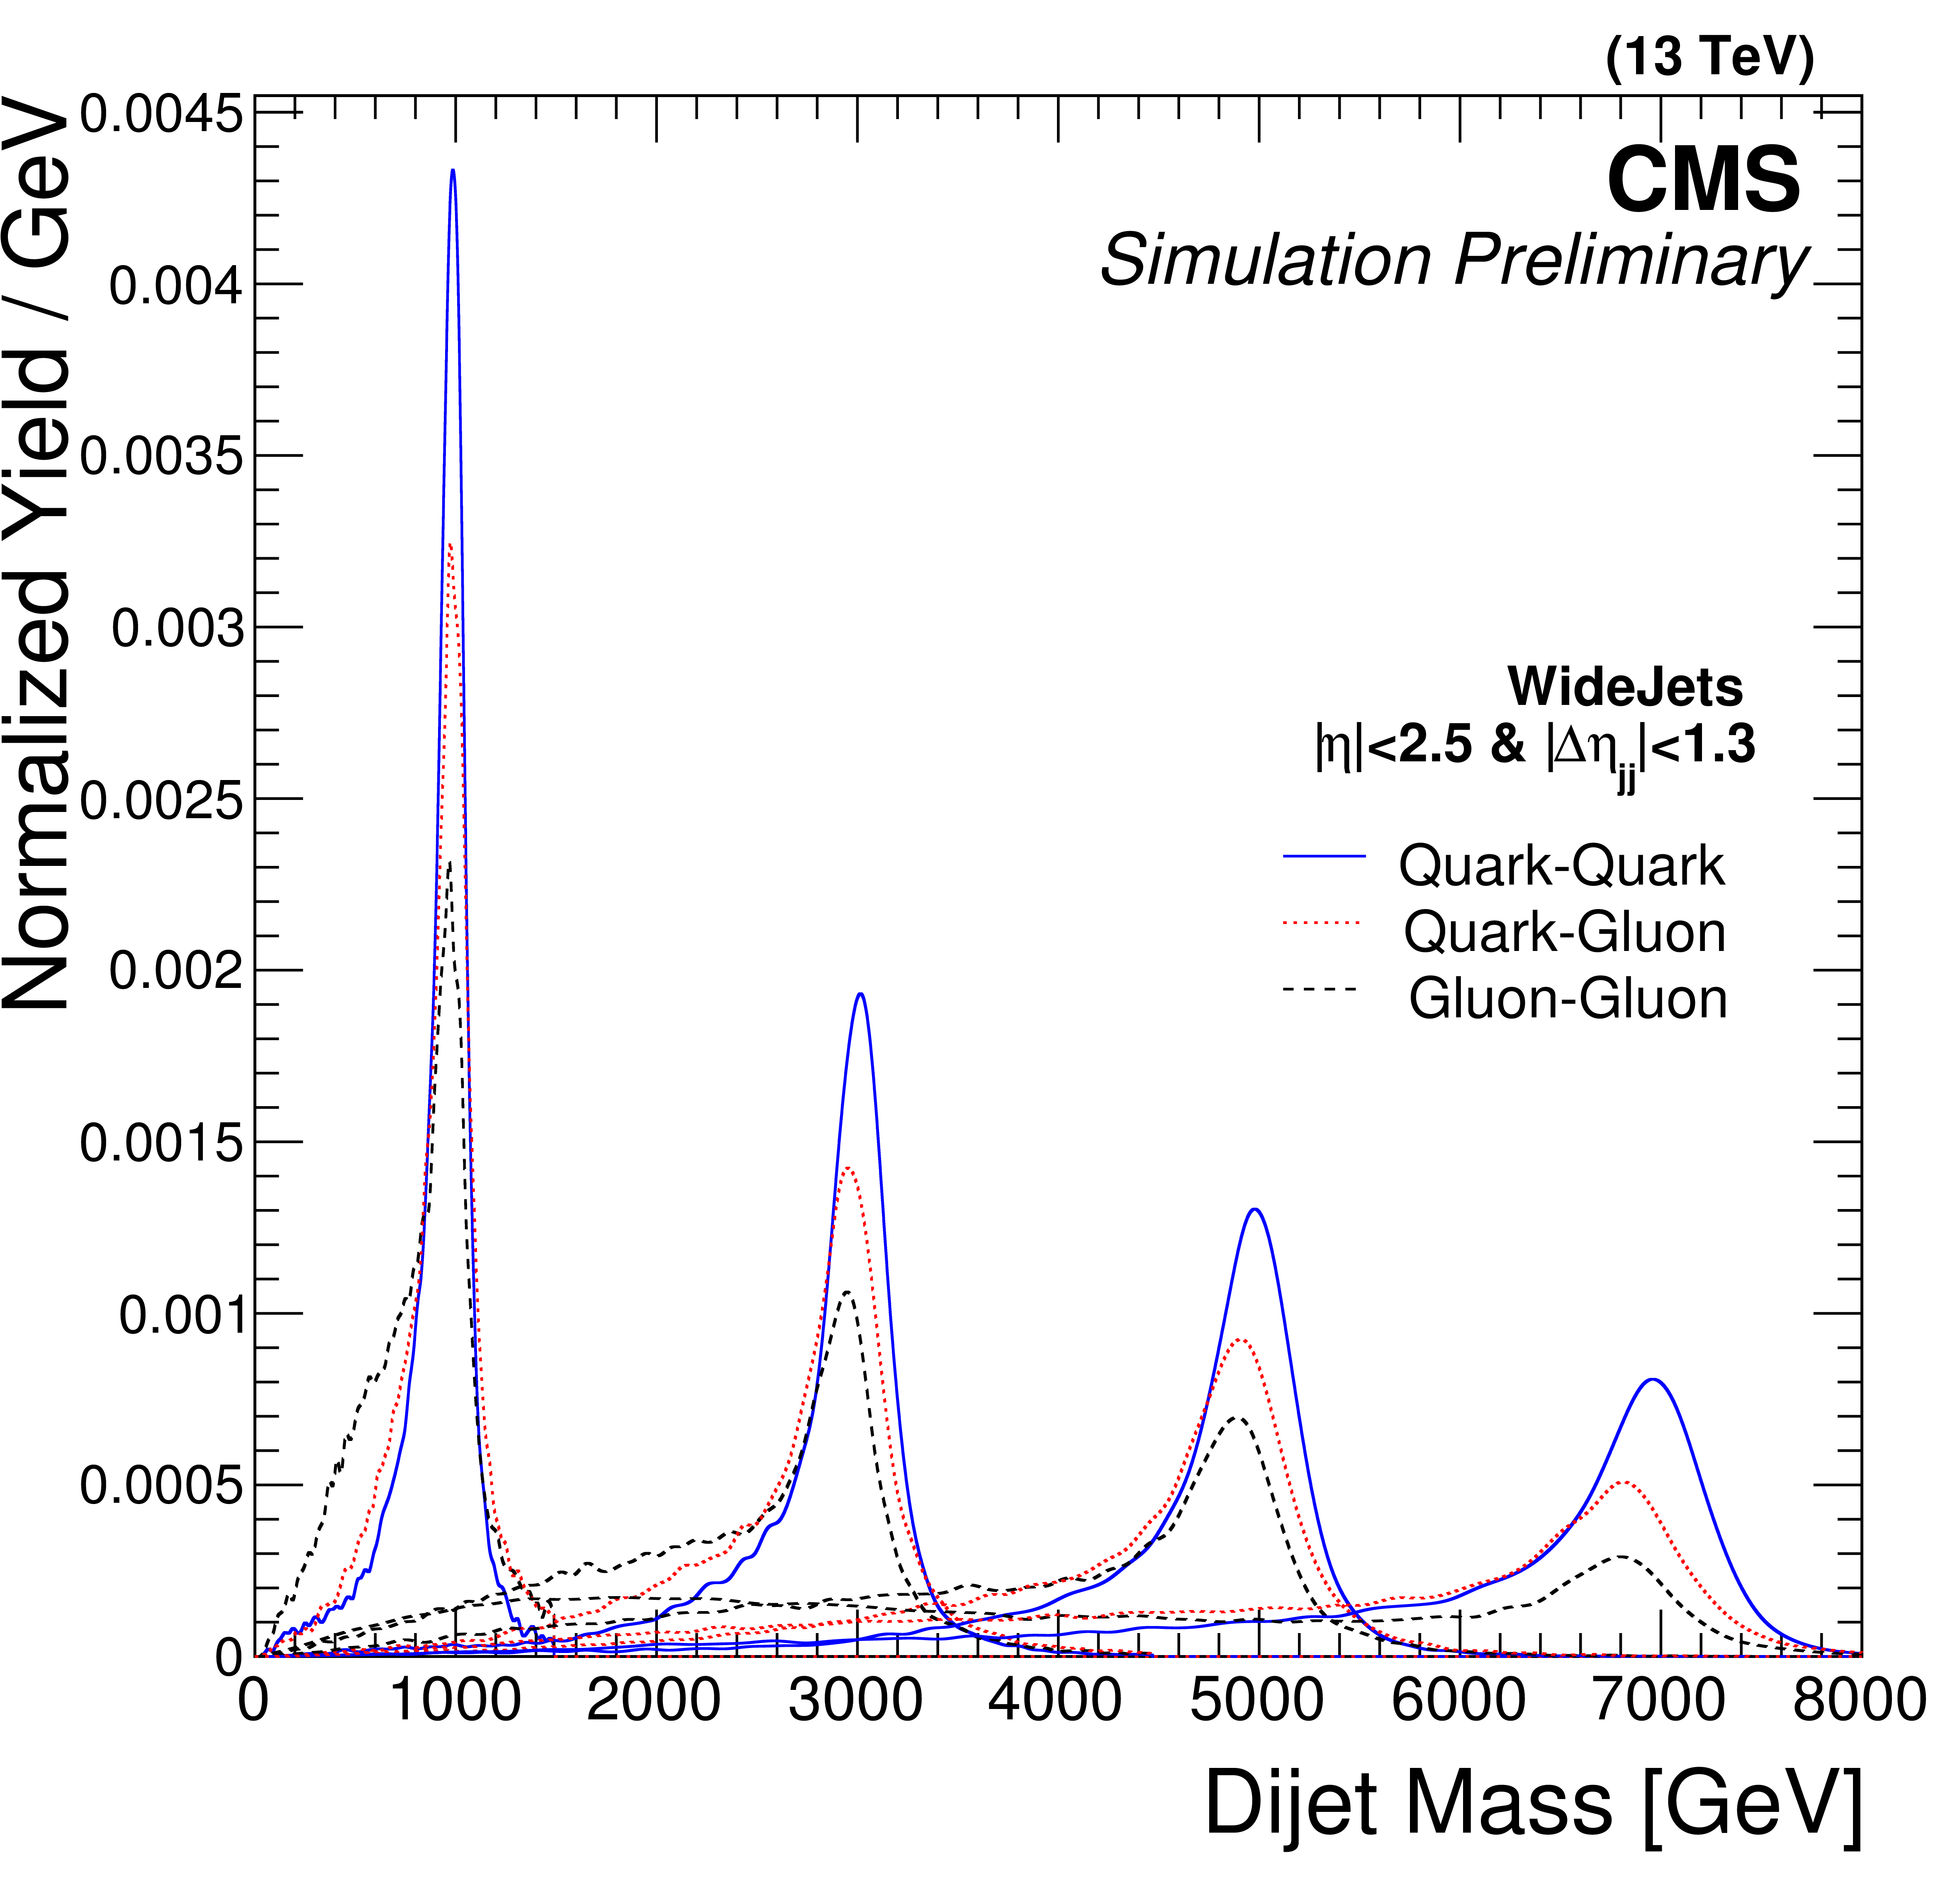
Figure 3:
The reconstructed resonance mass spectrum generated with the PYTHIA v8 MC simulation for quark-quark resonances modeled by the process $\mathrm {qq}\rightarrow \mathrm {G} \rightarrow \mathrm {qq}$ (blue solid), for quark-gluon resonances modeled by $\mathrm {qg} \rightarrow \mathrm{q}^* \rightarrow \mathrm{qg}$ (red dotted), and for gluon-gluon resonances modeled by $\mathrm {gg}\rightarrow \mathrm {G} \rightarrow \mathrm {gg}$ (green dashed) for resonance masses of 1.0, 3.0, 5.0 and 7.0 TeV . |
png ; pdf |
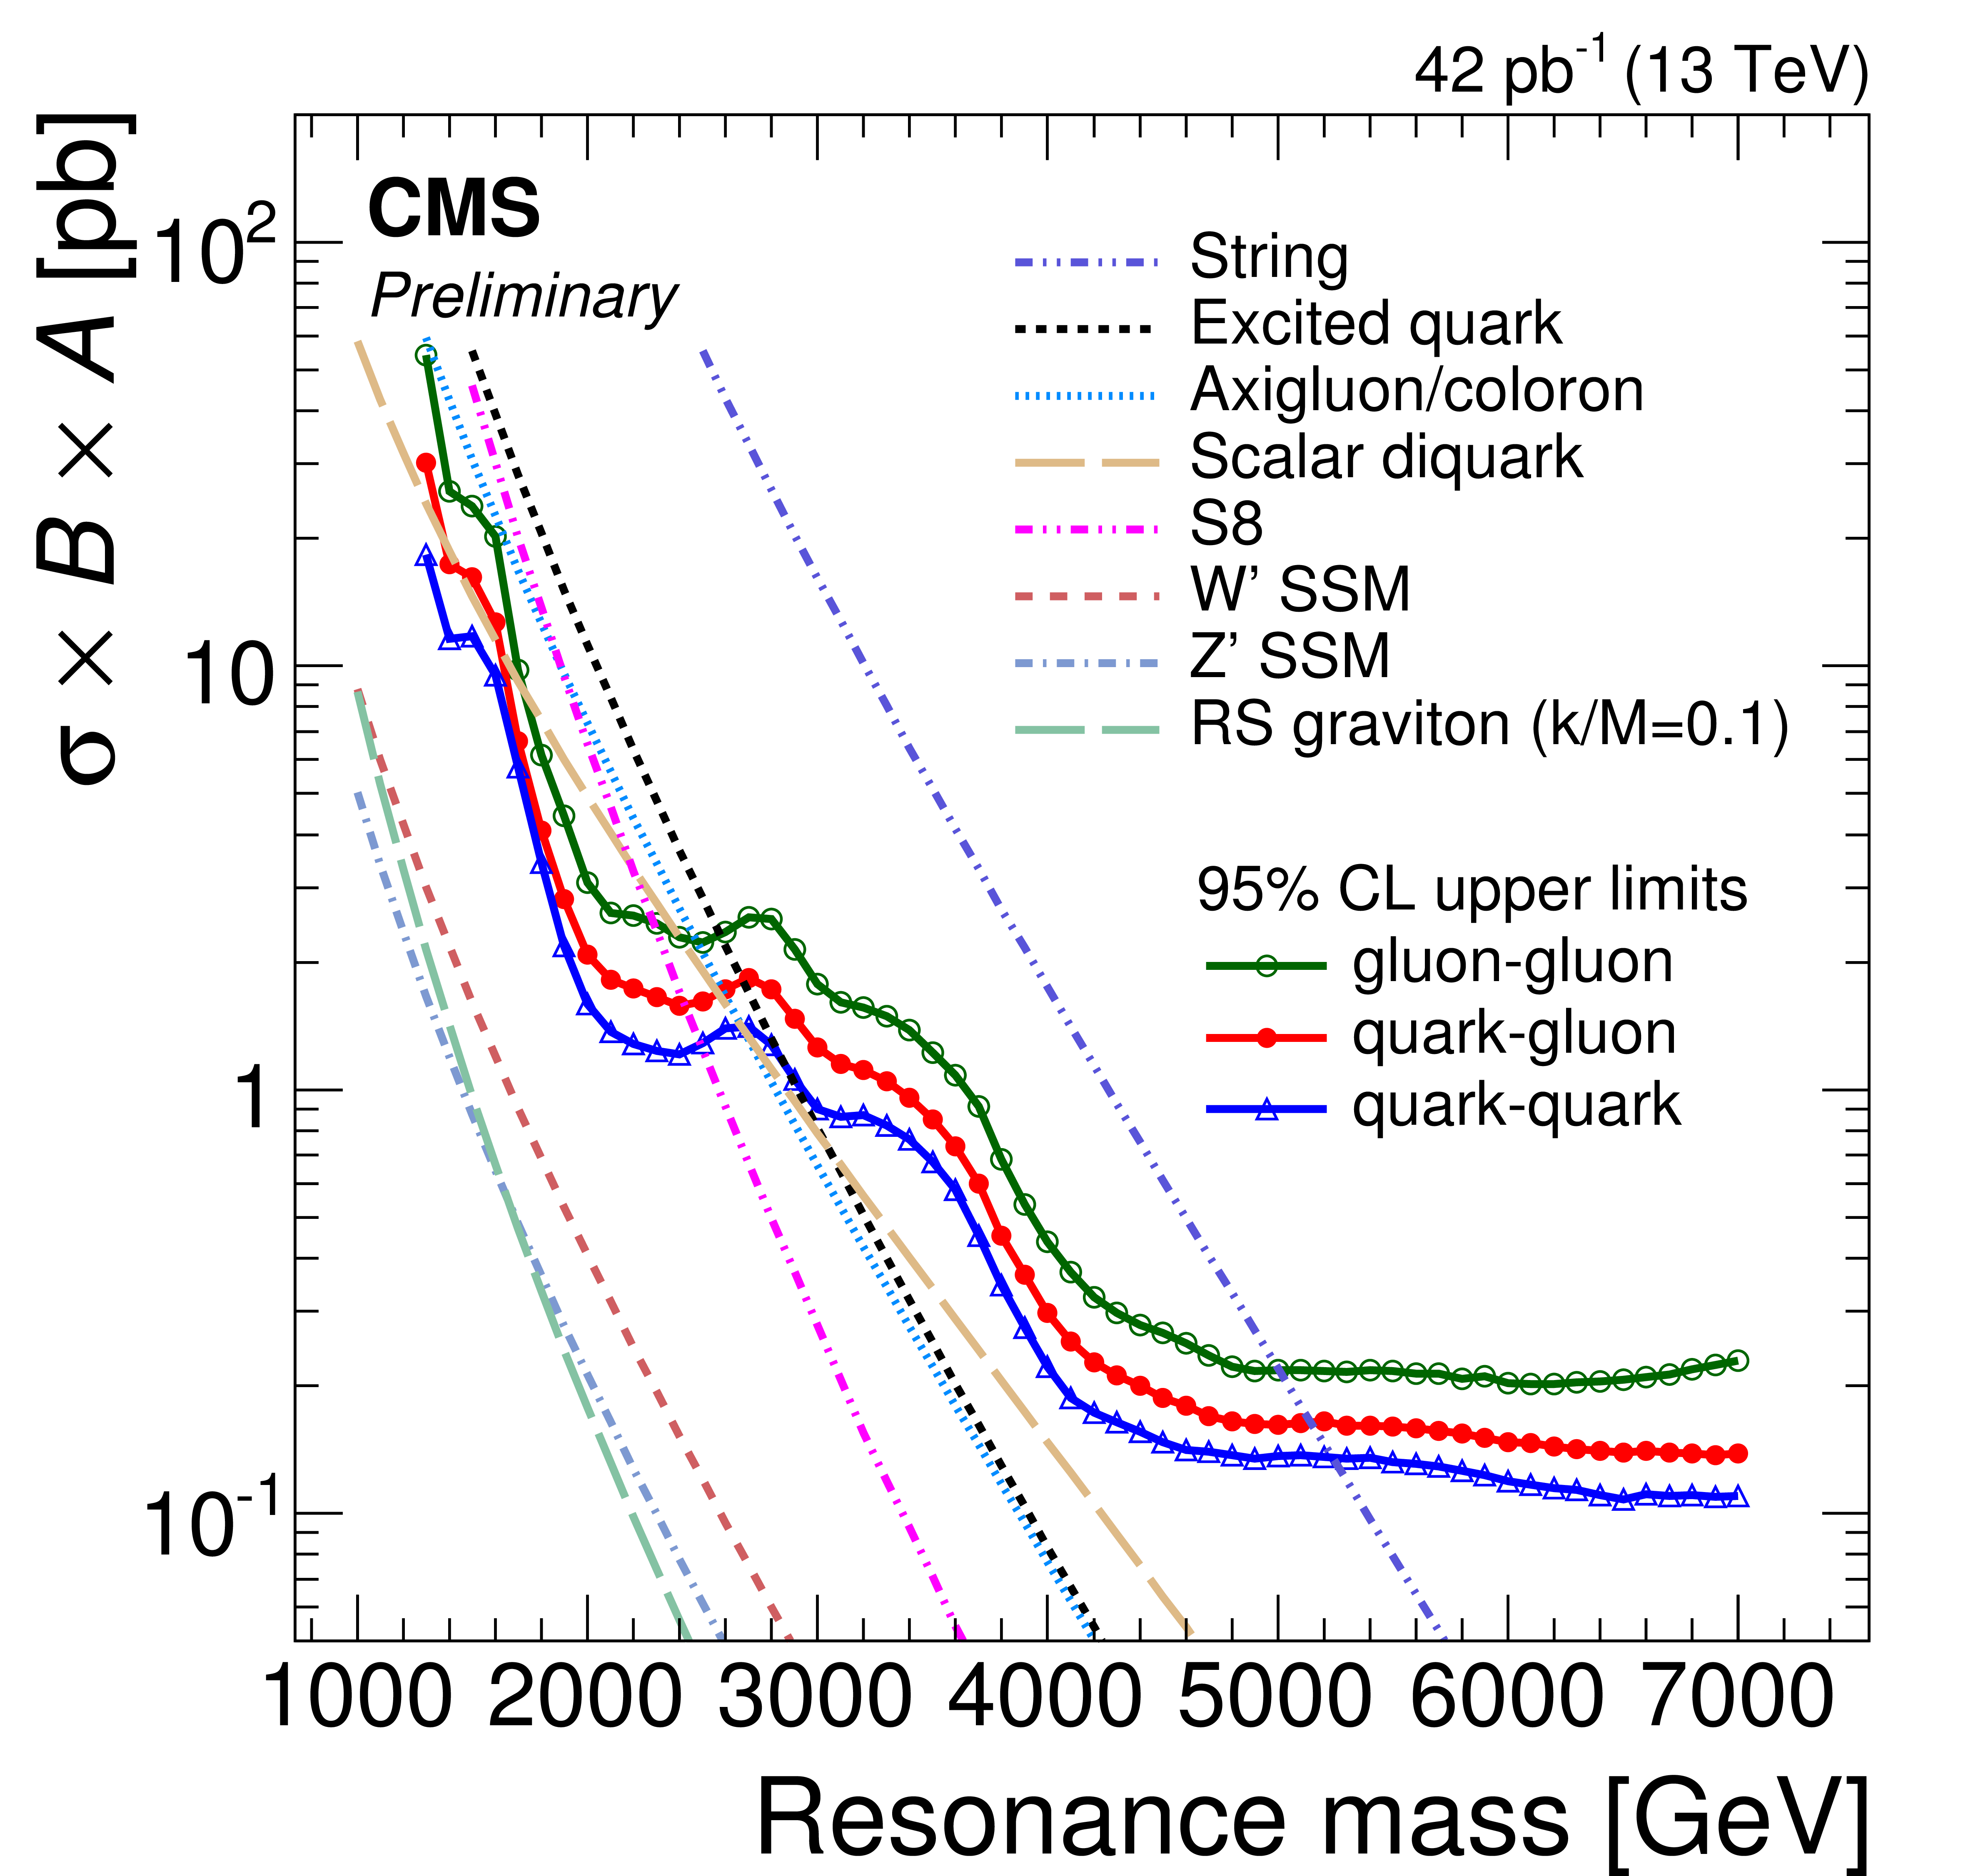
Figure 4:
The observed 95% CL upper limits on $\sigma \times B\times A$ for dijet resonances of the type gluon-gluon, quark-gluon, and quark-quark, compared to theoretical predictions for string resonances [12,13], scalar diquarks [14], excited quarks [15,16], axigluons [17,41], colorons [19,41], color octet scalars S8 [20], new gauge bosons W' and Z' [21], and RS gravitons [22]. |
png ; pdf |
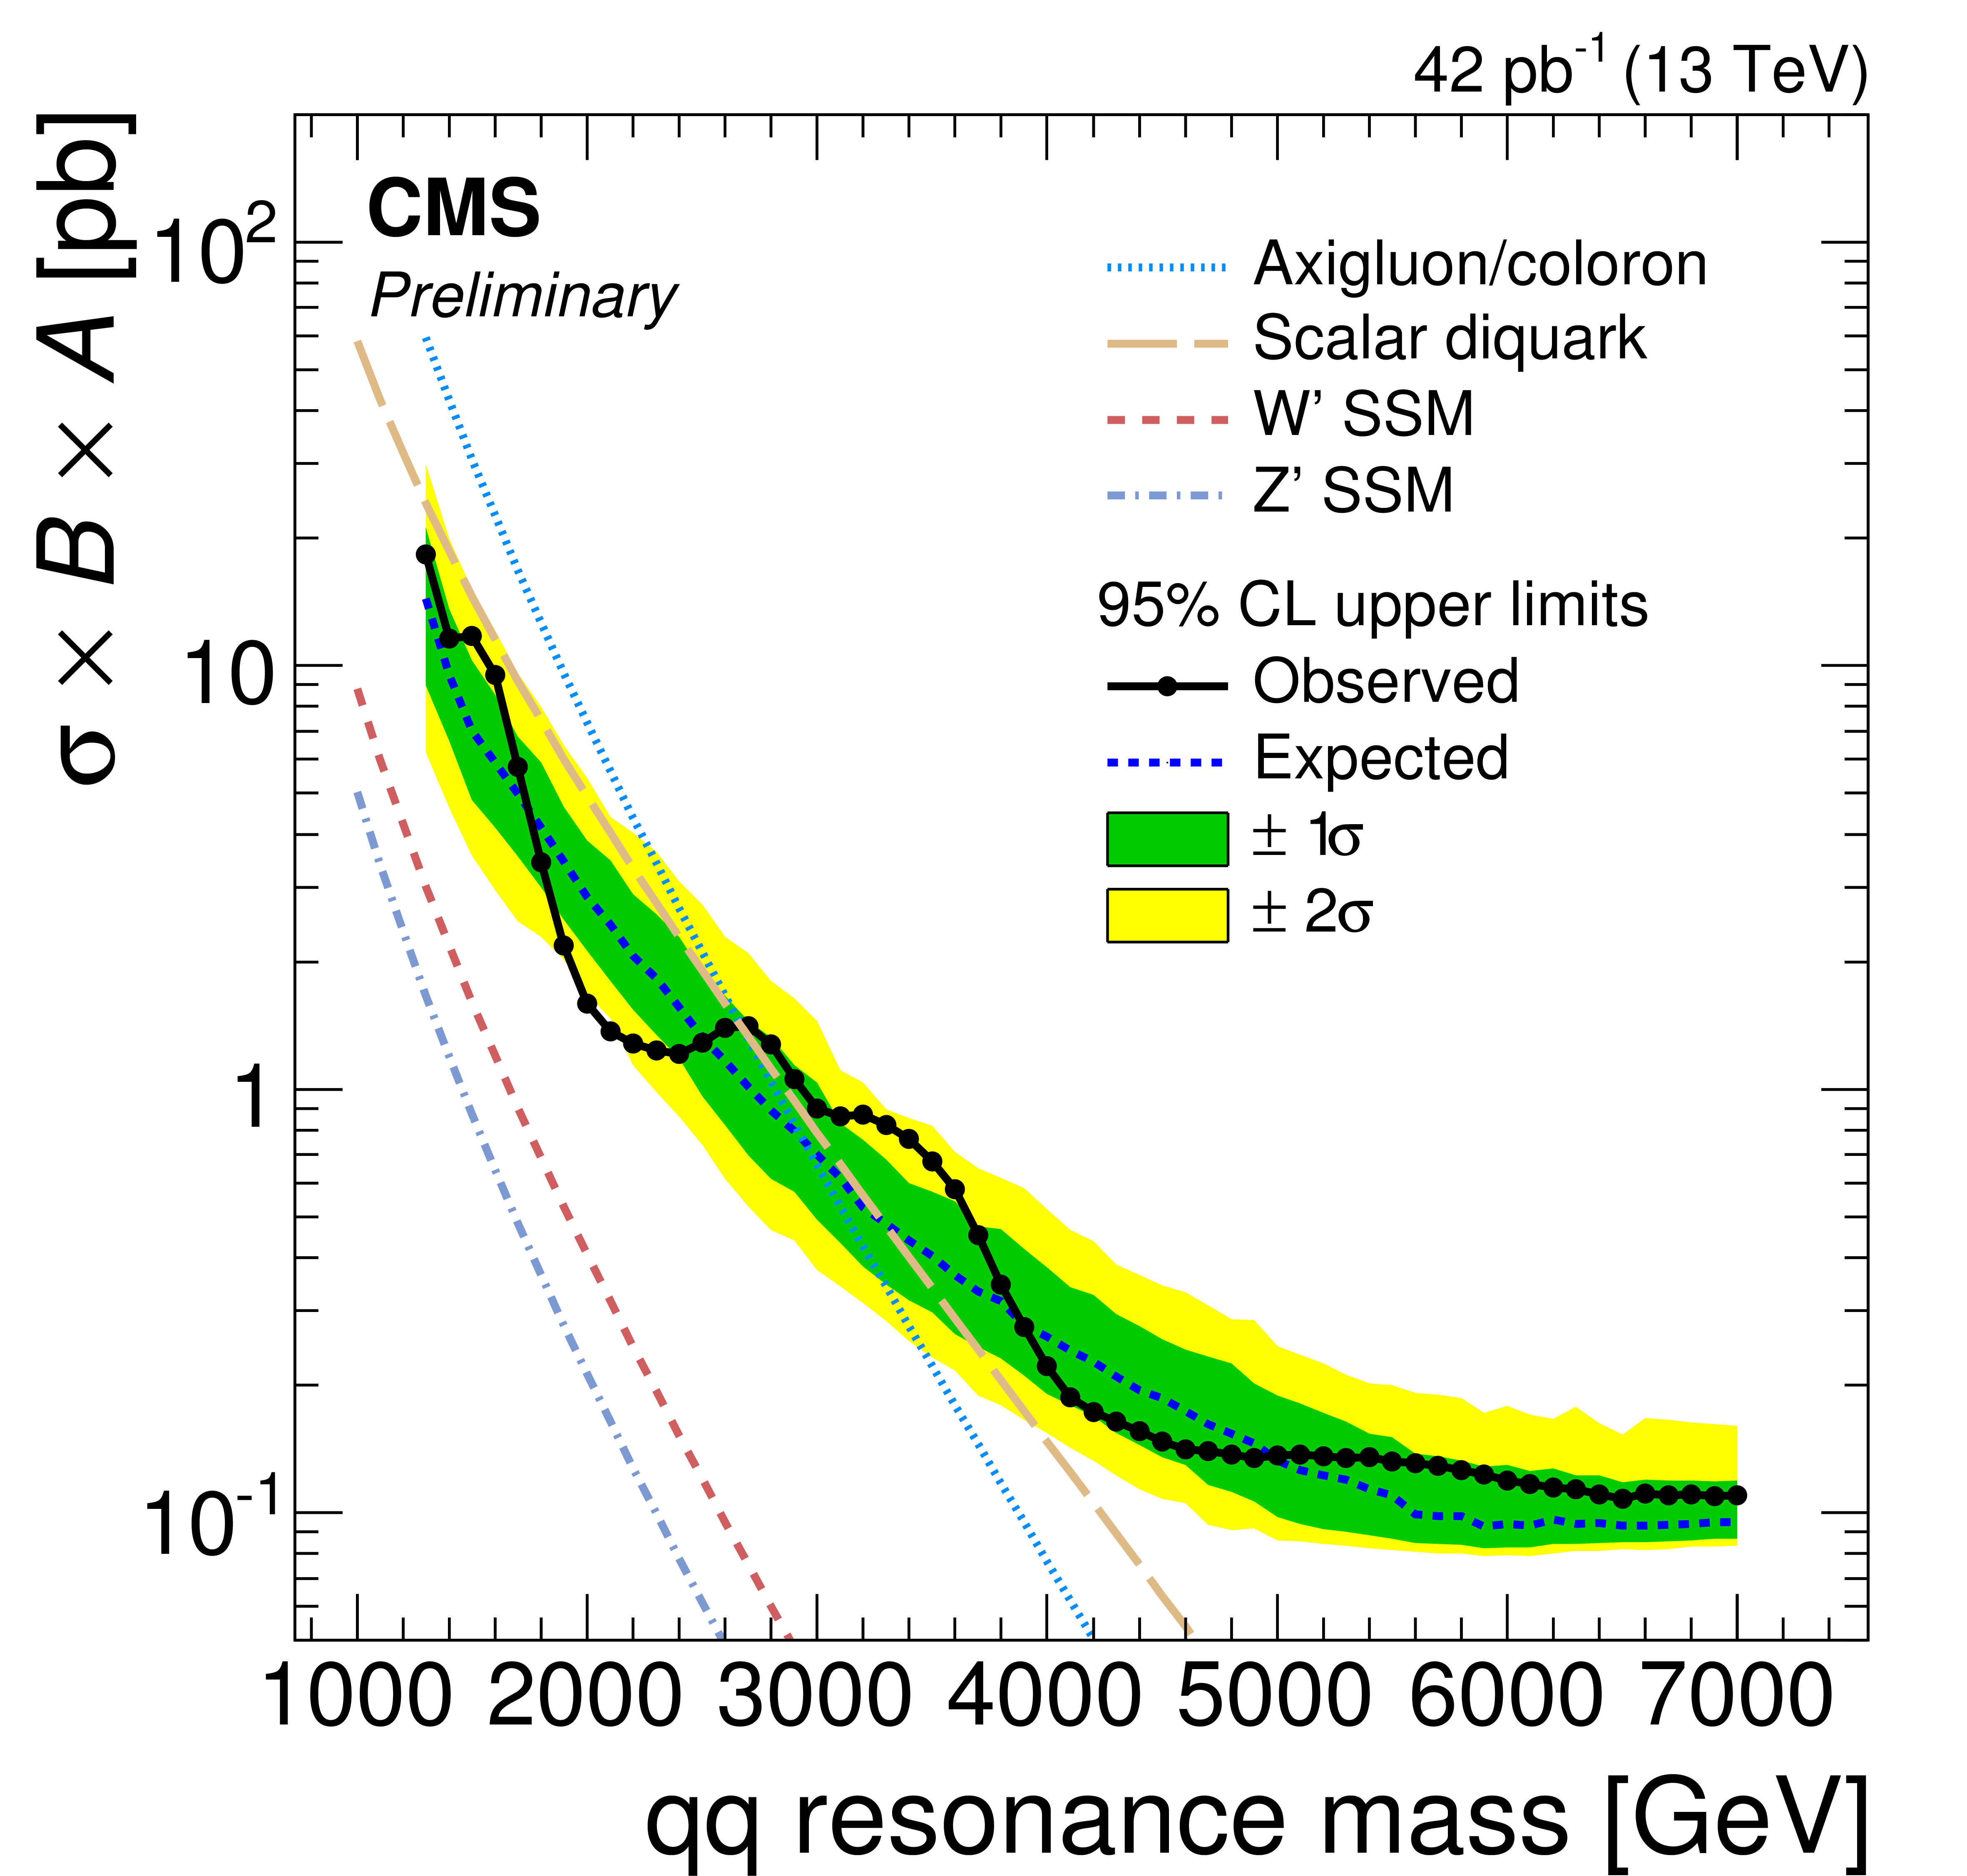
Figure 5-a:
The observed 95% CL upper limits on $\sigma \times B \times A$ for resonances decaying into quark quark (top left), quark gluon (top right), and gluon gluon (bottom) final states. The limits are shown as points connected by solid curves. Also shown are the expected limits (dot-dashed dark curves) and their variation at the 1$\sigma $ and 2$\sigma $ levels (shaded bands). Predicted cross sections of various resonance models are also shown. |
png ; pdf |
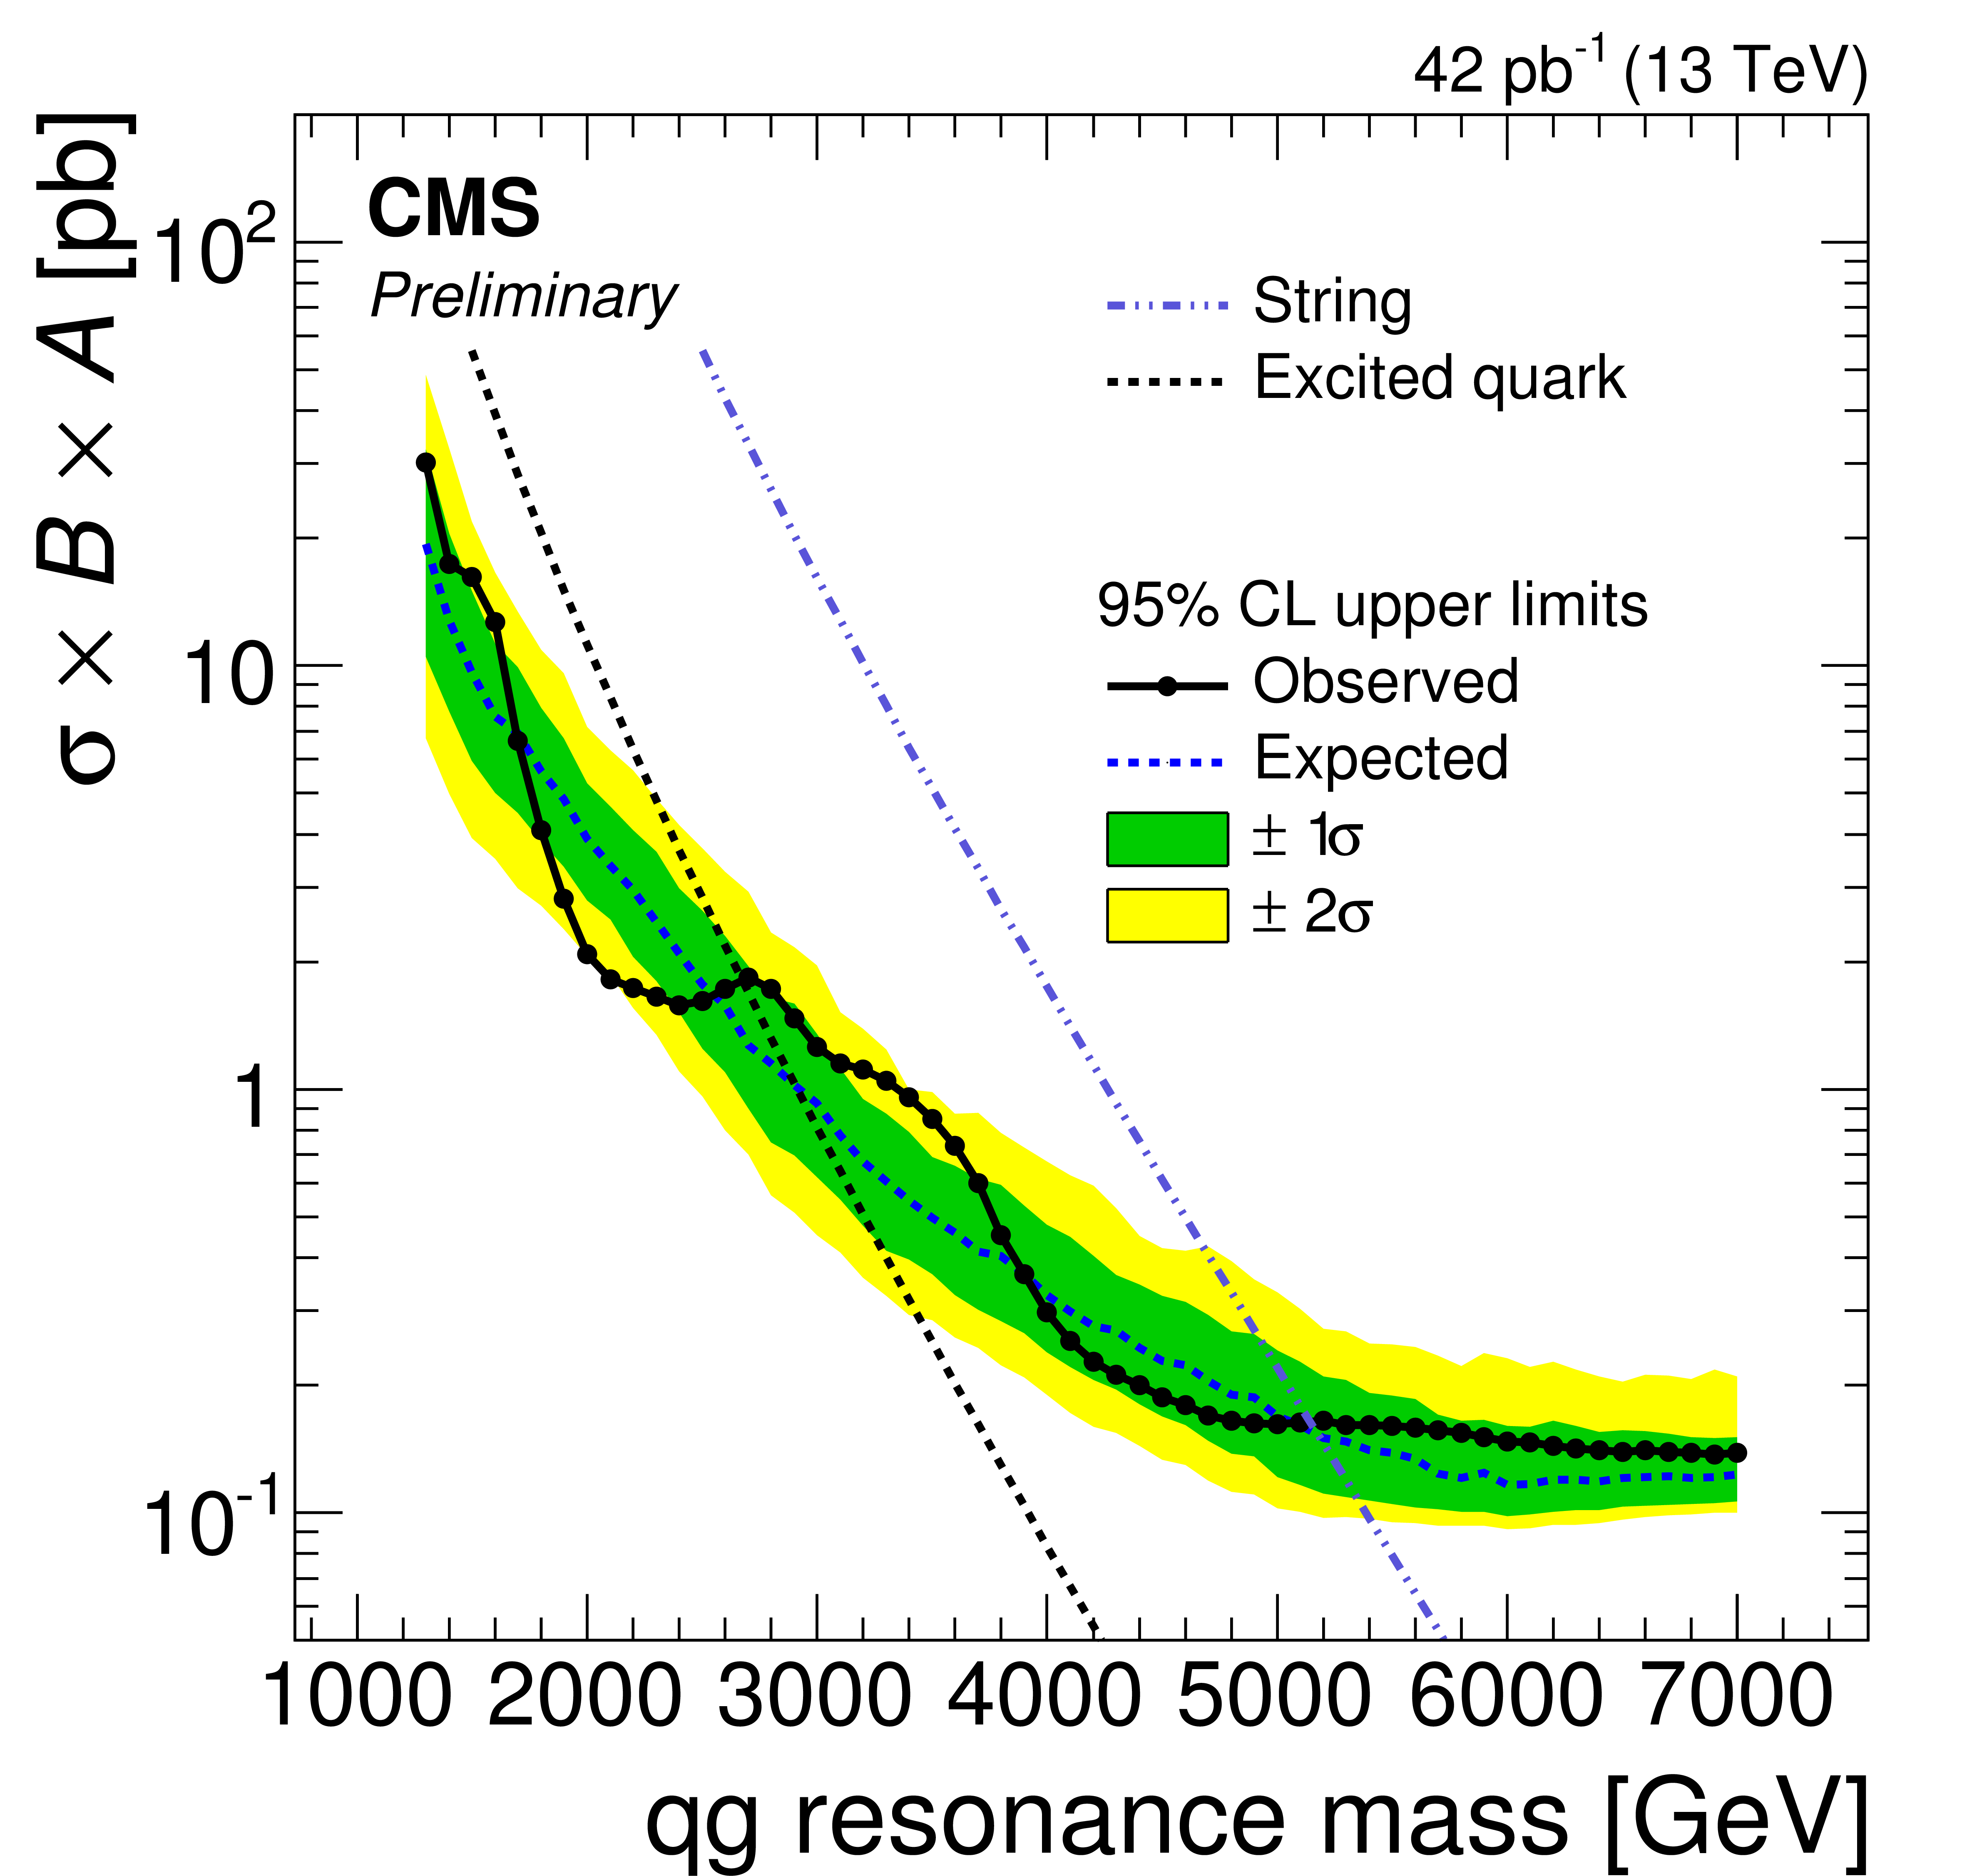
Figure 5-b:
The observed 95% CL upper limits on $\sigma \times B \times A$ for resonances decaying into quark quark (top left), quark gluon (top right), and gluon gluon (bottom) final states. The limits are shown as points connected by solid curves. Also shown are the expected limits (dot-dashed dark curves) and their variation at the 1$\sigma $ and 2$\sigma $ levels (shaded bands). Predicted cross sections of various resonance models are also shown. |

png ; pdf |
Figure 5-c:
The observed 95% CL upper limits on $\sigma \times B \times A$ for resonances decaying into quark quark (top left), quark gluon (top right), and gluon gluon (bottom) final states. The limits are shown as points connected by solid curves. Also shown are the expected limits (dot-dashed dark curves) and their variation at the 1$\sigma $ and 2$\sigma $ levels (shaded bands). Predicted cross sections of various resonance models are also shown. |
| Tables | |
png ; pdf |
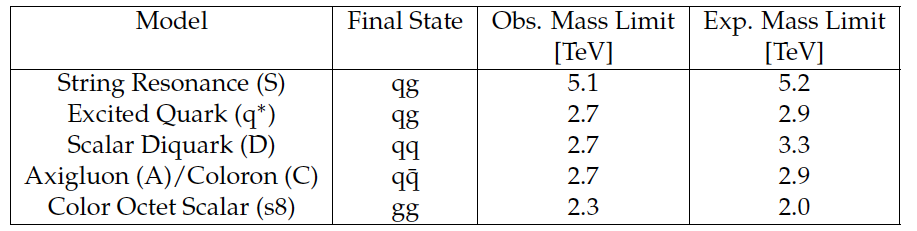
Table 1:
Observed and expected 95% CL limits on the mass of various resonances. This analysis excludes the resonances listed at 95% CL between a mass of 1.3 TeV and the limits shown. |
|
|
Compact Muon Solenoid LHC, CERN |
|

|

|

|

|

|