

Compact Muon Solenoid
LHC, CERN
| CMS-PAS-EXO-14-014 | ||
| Search for heavy Majorana neutrinos in $ \mathrm{ e^{\pm} e^{\pm} } $ + jets and $ \mathrm{ e^{\pm} \mu^{\pm} } $ + jets events in proton-proton collisions at $ \sqrt{s} =$ 8 TeV | ||
| CMS Collaboration | ||
| September 2015 | ||
| Abstract: We report a search for heavy Majorana neutrinos (N) decaying into a W boson and a lepton using the CMS detector at the Large Hadron Collider. We search for a signature of two same-sign electrons and two jets or a same-sign electron-muon pair and two jets using 19.7 fb$^{-1}$ of data collected during 2012 in proton-proton collisions at a center-of-mass energy of 8 TeV. We find the data to be consistent with the expected standard model background and upper limits are set on $ | V_{\ell \mathrm{N}} |^2 $, as a function of Majorana neutrino mass from 40-500 GeV/$c^2$, where $V_{\ell \mathrm{N}}$ is the mixing element of the heavy neutrino with the standard model neutrino. The upper limits obtained for $ | V_{e \mathrm{N}} |^2 $ ($ | V_{e \mathrm{N}} V_{\mu \mathrm{N}}^* | $) are 0.022 (0.009) for $ m_\mathrm{N} =$ 90 GeV/$c^2$, 0.016 (0.009) for $m_\mathrm{N} =$ 200 GeV/$c^2$, and 0.72 (0.47) for $m_\mathrm{N} =$ 500 GeV/$c^2$. These results extend considerably the regions excluded by previous direct searches. | ||
|
Links:
CDS record (PDF) ;
Public twiki page ;
CADI line (restricted) ; Figures are also available from the CDS record. These preliminary results are superseded in this paper, JHEP 04 (2016) 169. |
||
| Figures | |

png ; pdf |
Figure 1:
The Feynman diagram for resonance production of a Majorana neutrino (N). The charge-conjugate diagram results in a $\ell ^- \ell ^- \mathrm{ q \bar{q}^\prime } $ final state. |
png ; pdf |
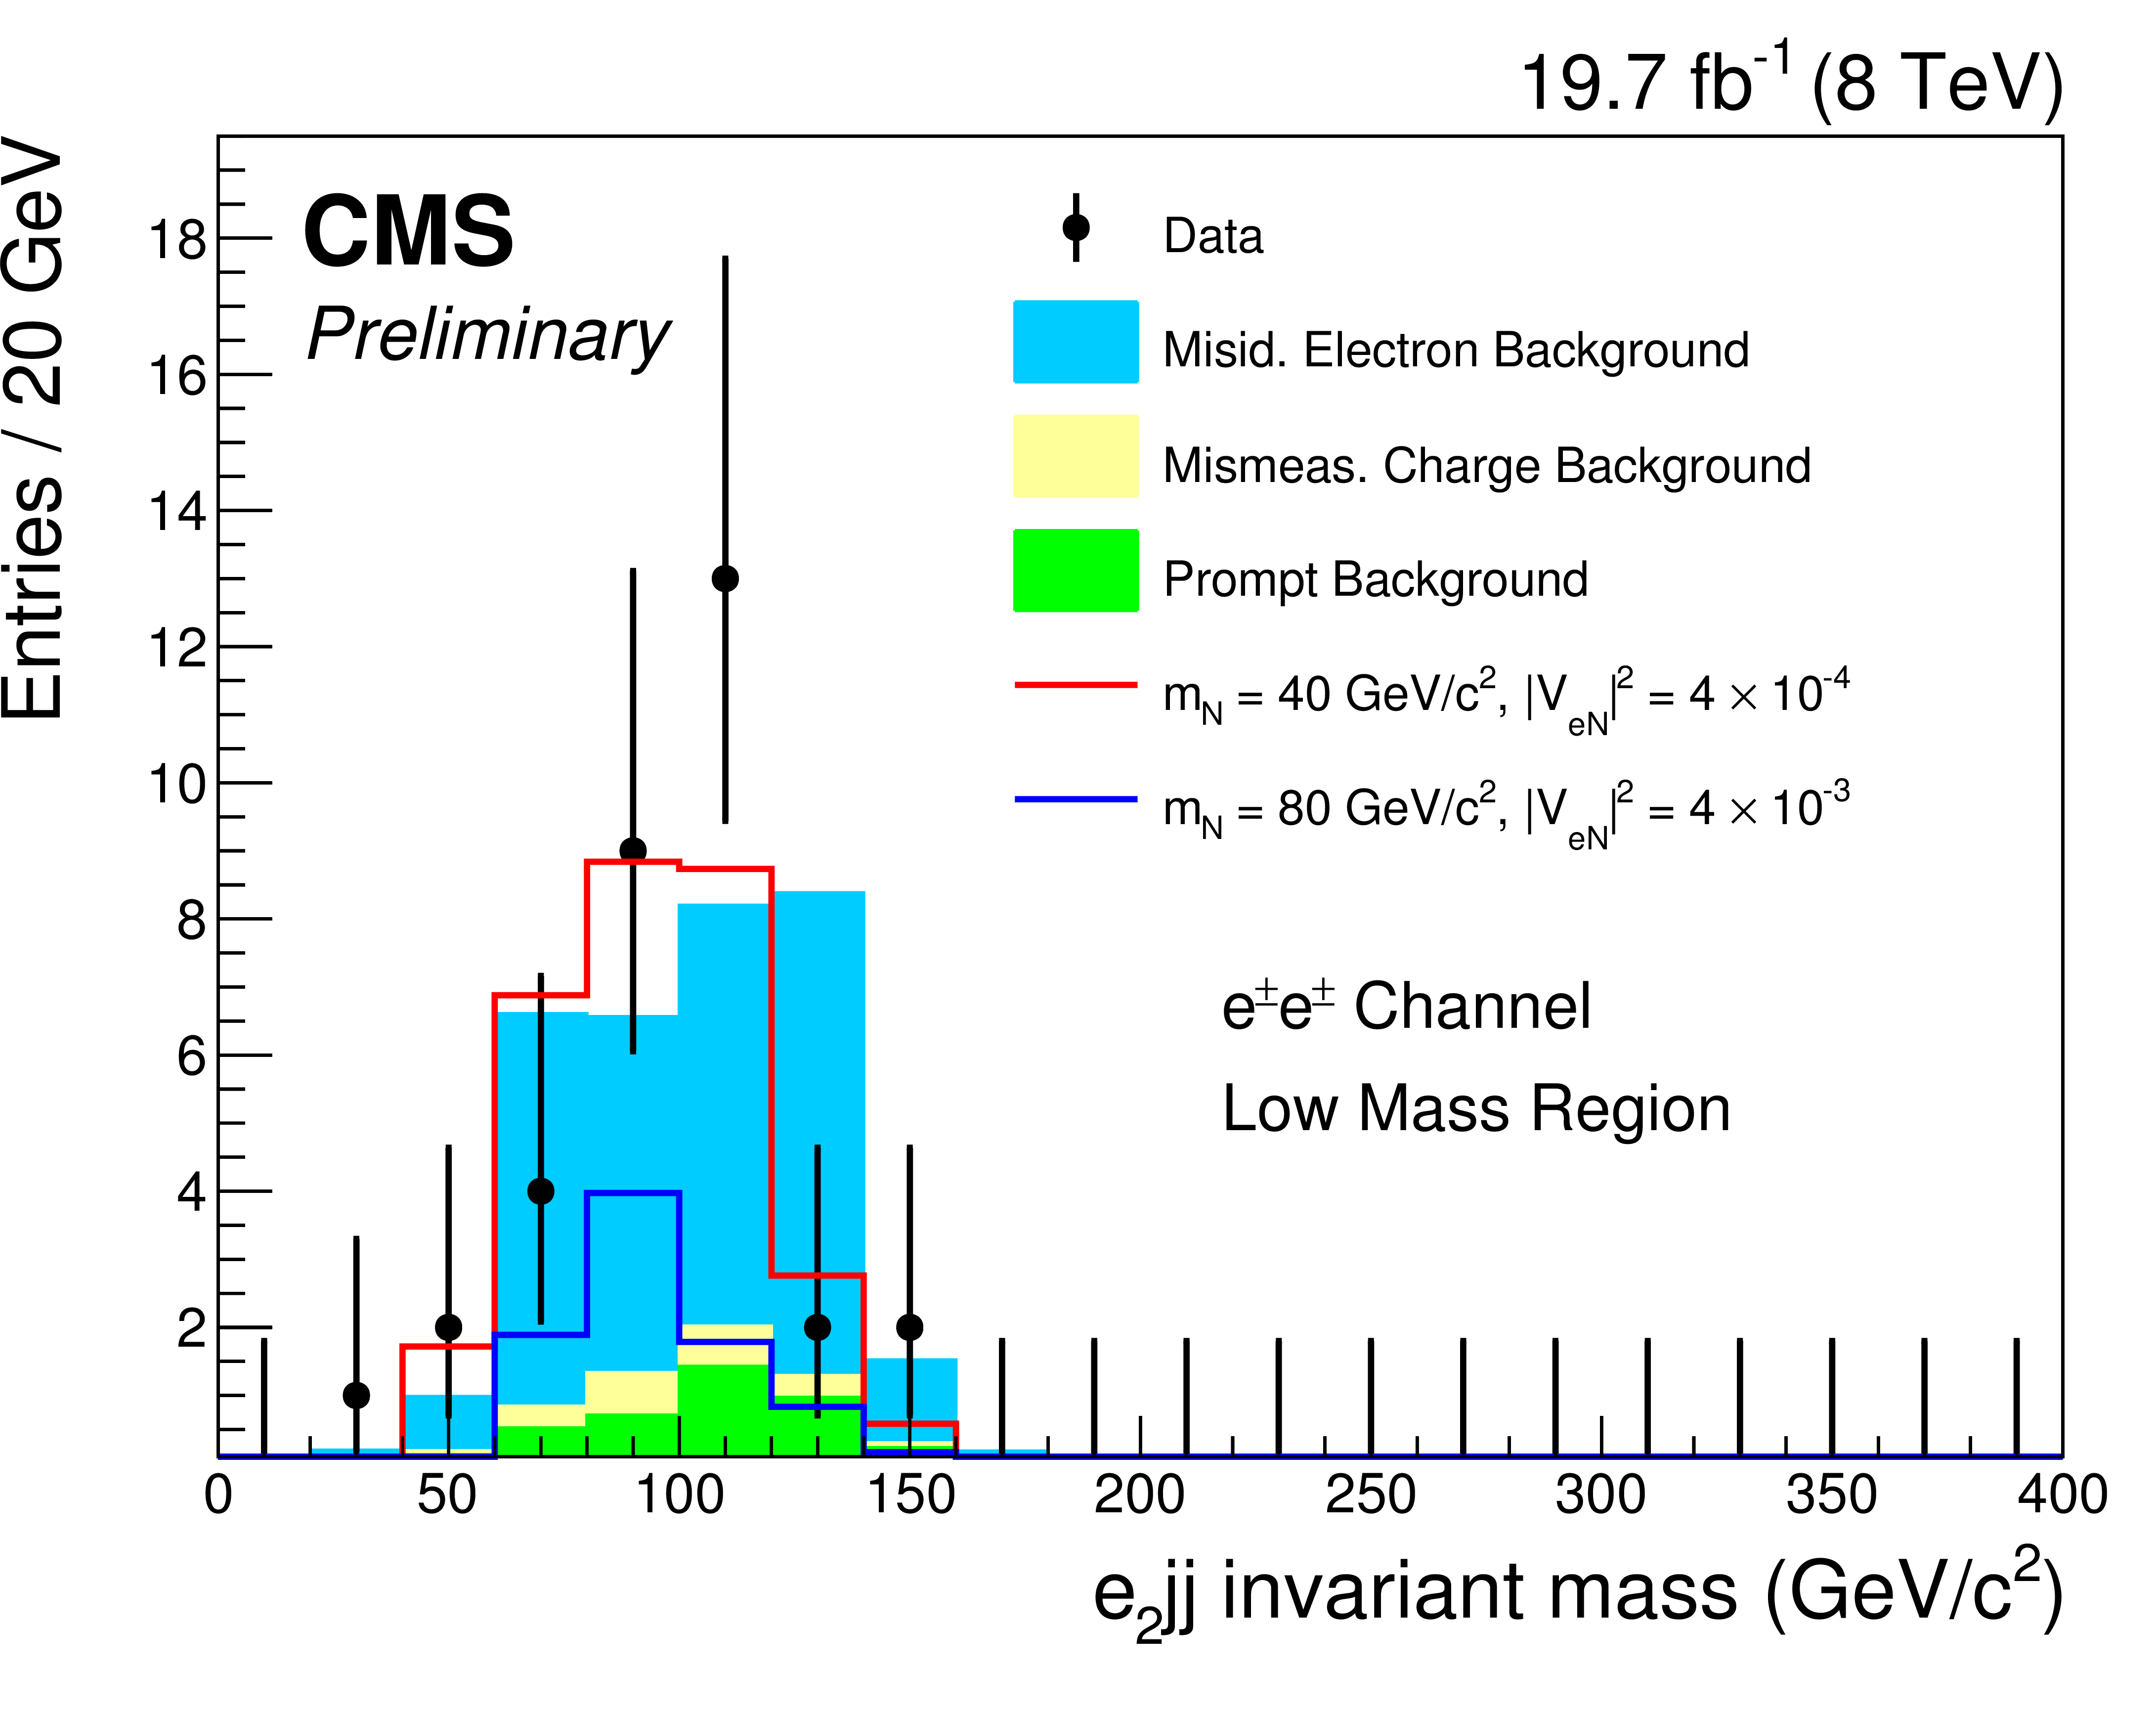
Figure 2-a:
Kinematic distributions for the low-mass selection (dielectron channel) after all selection cuts are applied except for the final optimization requirement: [a] Invariant mass of the trailing $ {p_{\mathrm {T}}} $ lepton and the two selected jets, [b] Invariant mass of two leptons and the two selected jets and [c] the ${p_{\mathrm {T}}} $ of the leading lepton. The plot shows the data, backgrounds, and two choices for the heavy Majorana neutrino signal: $ {m_\mathrm {N}} =$ 40 GeV/$c^2$, $ {| {V_{e \mathrm {N}}} {V_{\mu \mathrm {N}}} ^* | } = 4 \times 10^{-4}$ and $ {m_\mathrm {N}} =$ 80 GeV/$c^2$, $ {| {V_{e \mathrm {N}}} {V_{\mu \mathrm {N}}} ^* | } = 4 \times 10^{-3}$. The prompt background includes diboson (VV), Higgs boson, triboson (VVV) and $\mathrm{t \bar{t}}$V production and is stacked along with the backgrounds from misidentified leptons and mismeasured charge. |
png ; pdf |
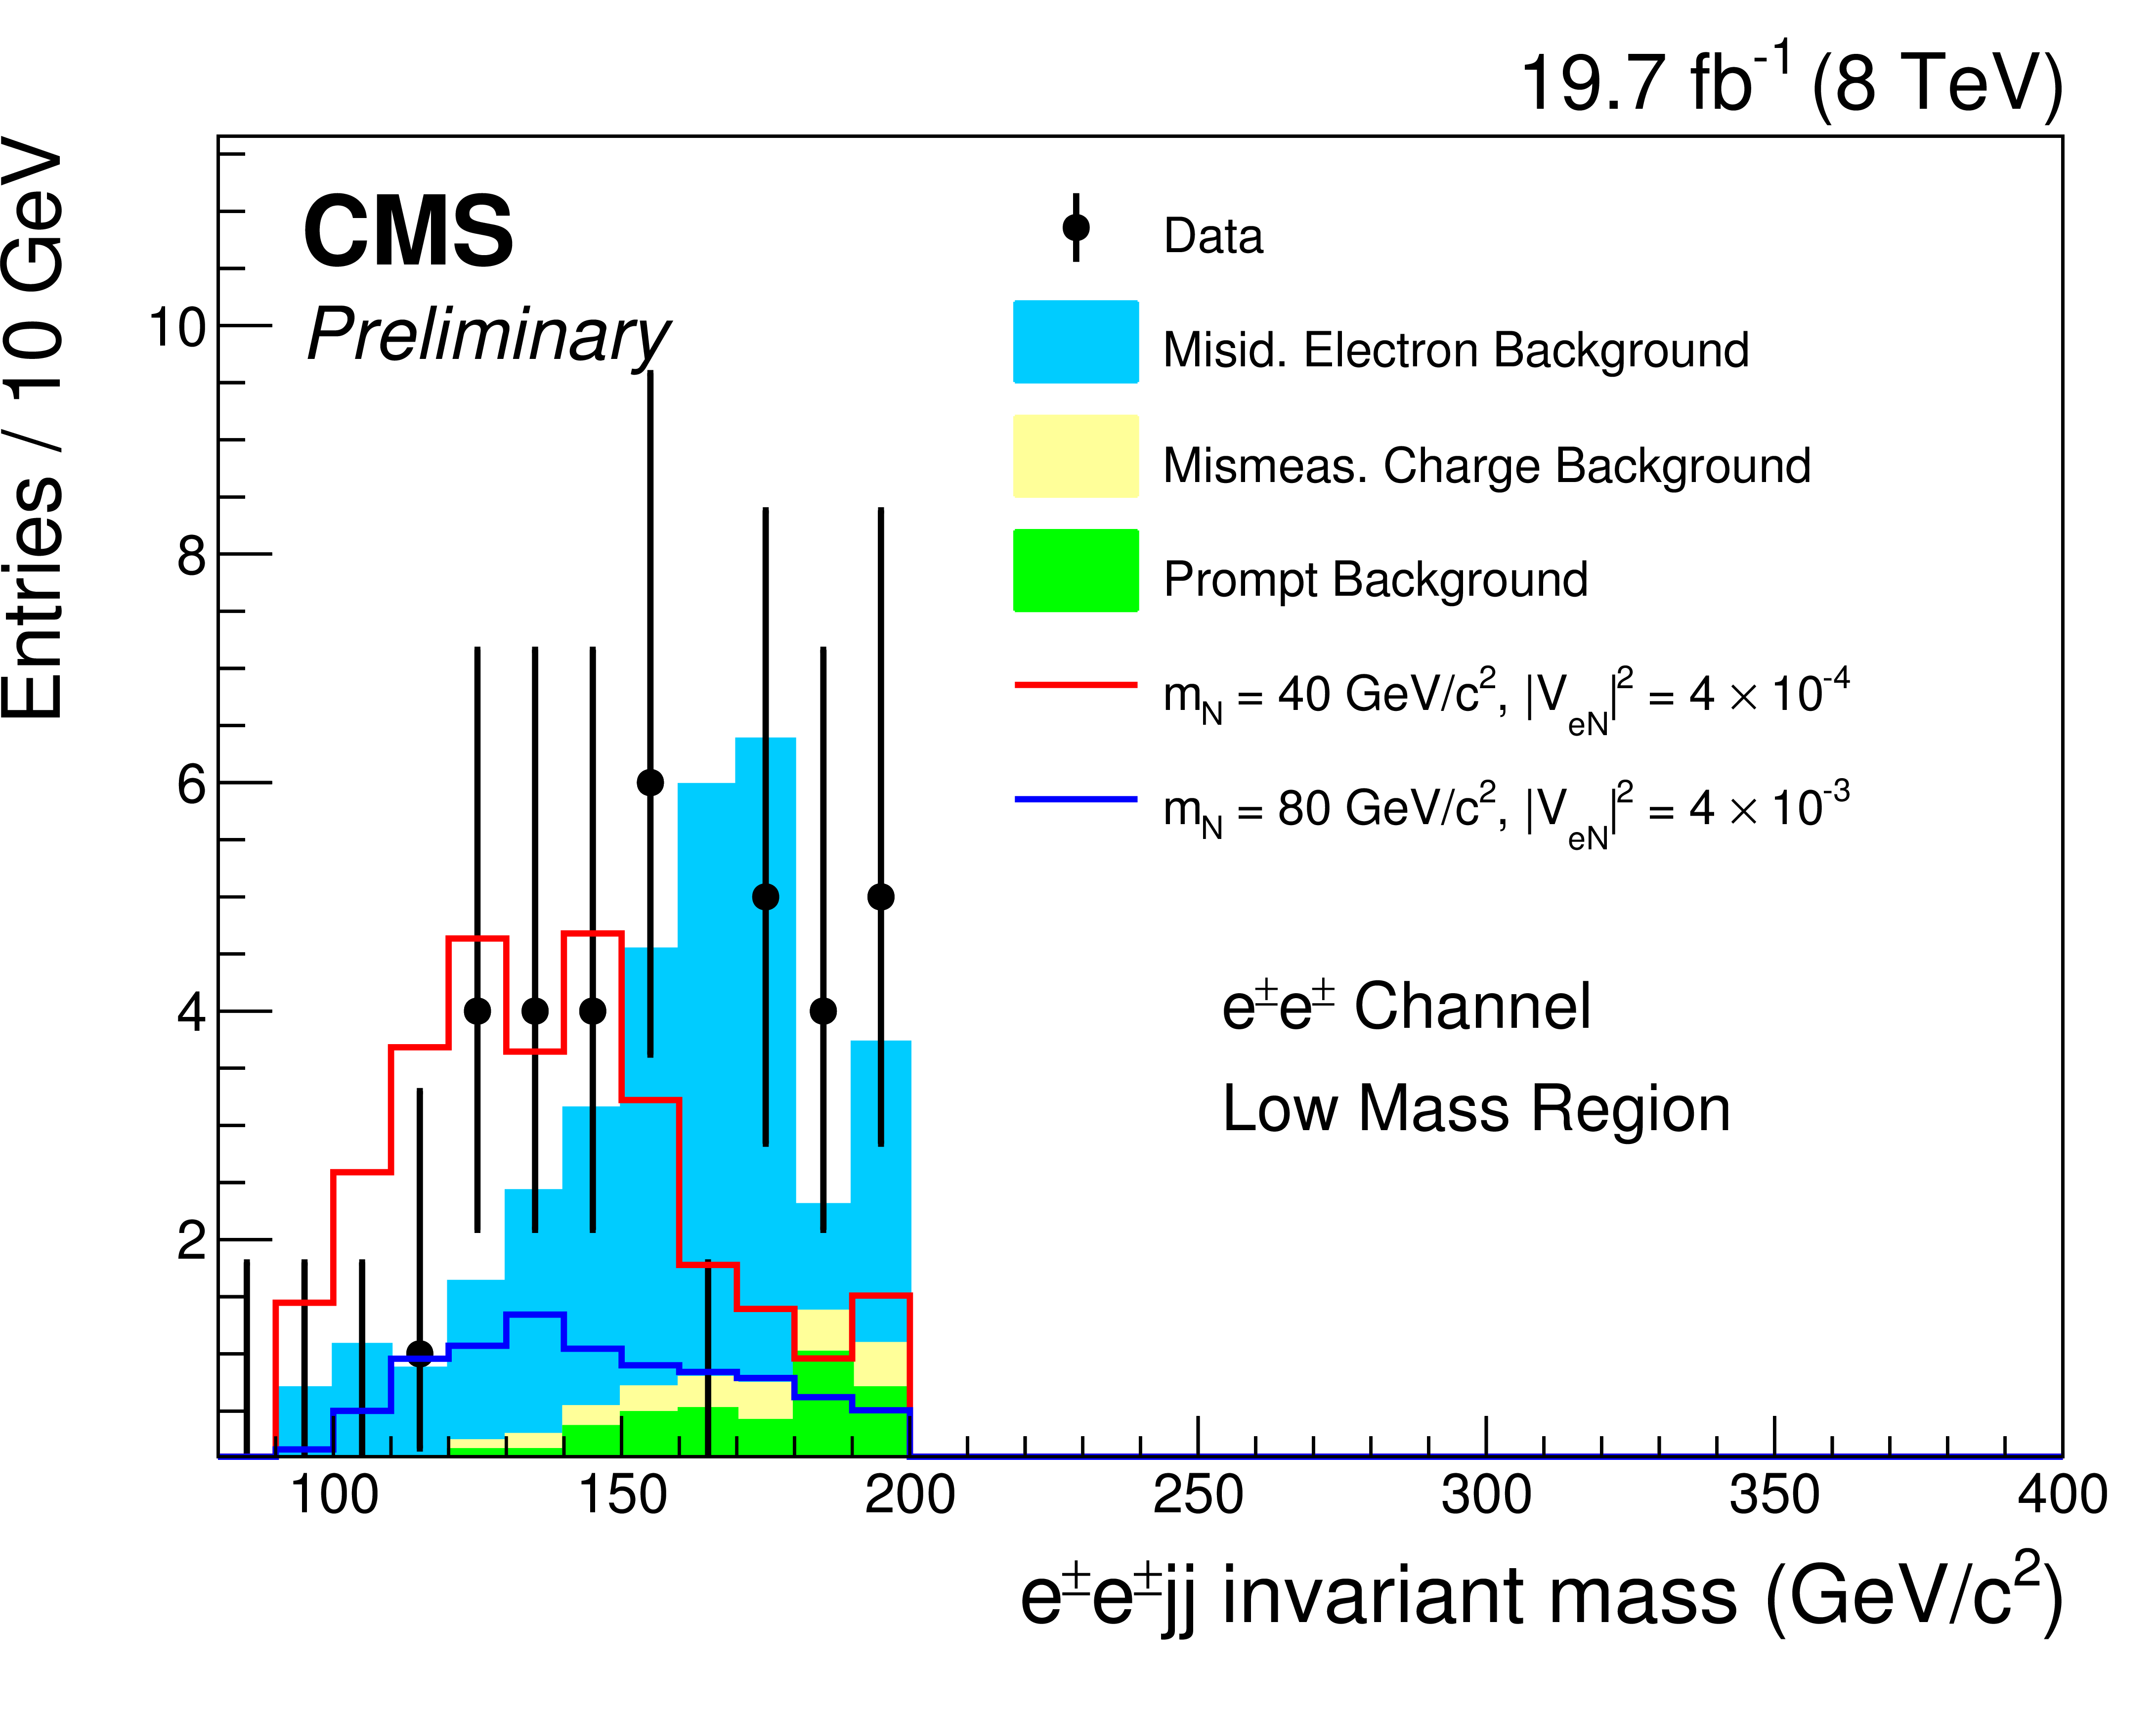
Figure 2-b:
Kinematic distributions for the low-mass selection (dielectron channel) after all selection cuts are applied except for the final optimization requirement: [a] Invariant mass of the trailing $ {p_{\mathrm {T}}} $ lepton and the two selected jets, [b] Invariant mass of two leptons and the two selected jets and [c] the ${p_{\mathrm {T}}} $ of the leading lepton. The plot shows the data, backgrounds, and two choices for the heavy Majorana neutrino signal: $ {m_\mathrm {N}} =$ 40 GeV/$c^2$, $ {| {V_{e \mathrm {N}}} {V_{\mu \mathrm {N}}} ^* | } = 4 \times 10^{-4}$ and $ {m_\mathrm {N}} =$ 80 GeV/$c^2$, $ {| {V_{e \mathrm {N}}} {V_{\mu \mathrm {N}}} ^* | } = 4 \times 10^{-3}$. The prompt background includes diboson (VV), Higgs boson, triboson (VVV) and $\mathrm{t \bar{t}}$V production and is stacked along with the backgrounds from misidentified leptons and mismeasured charge. |
png ; pdf |
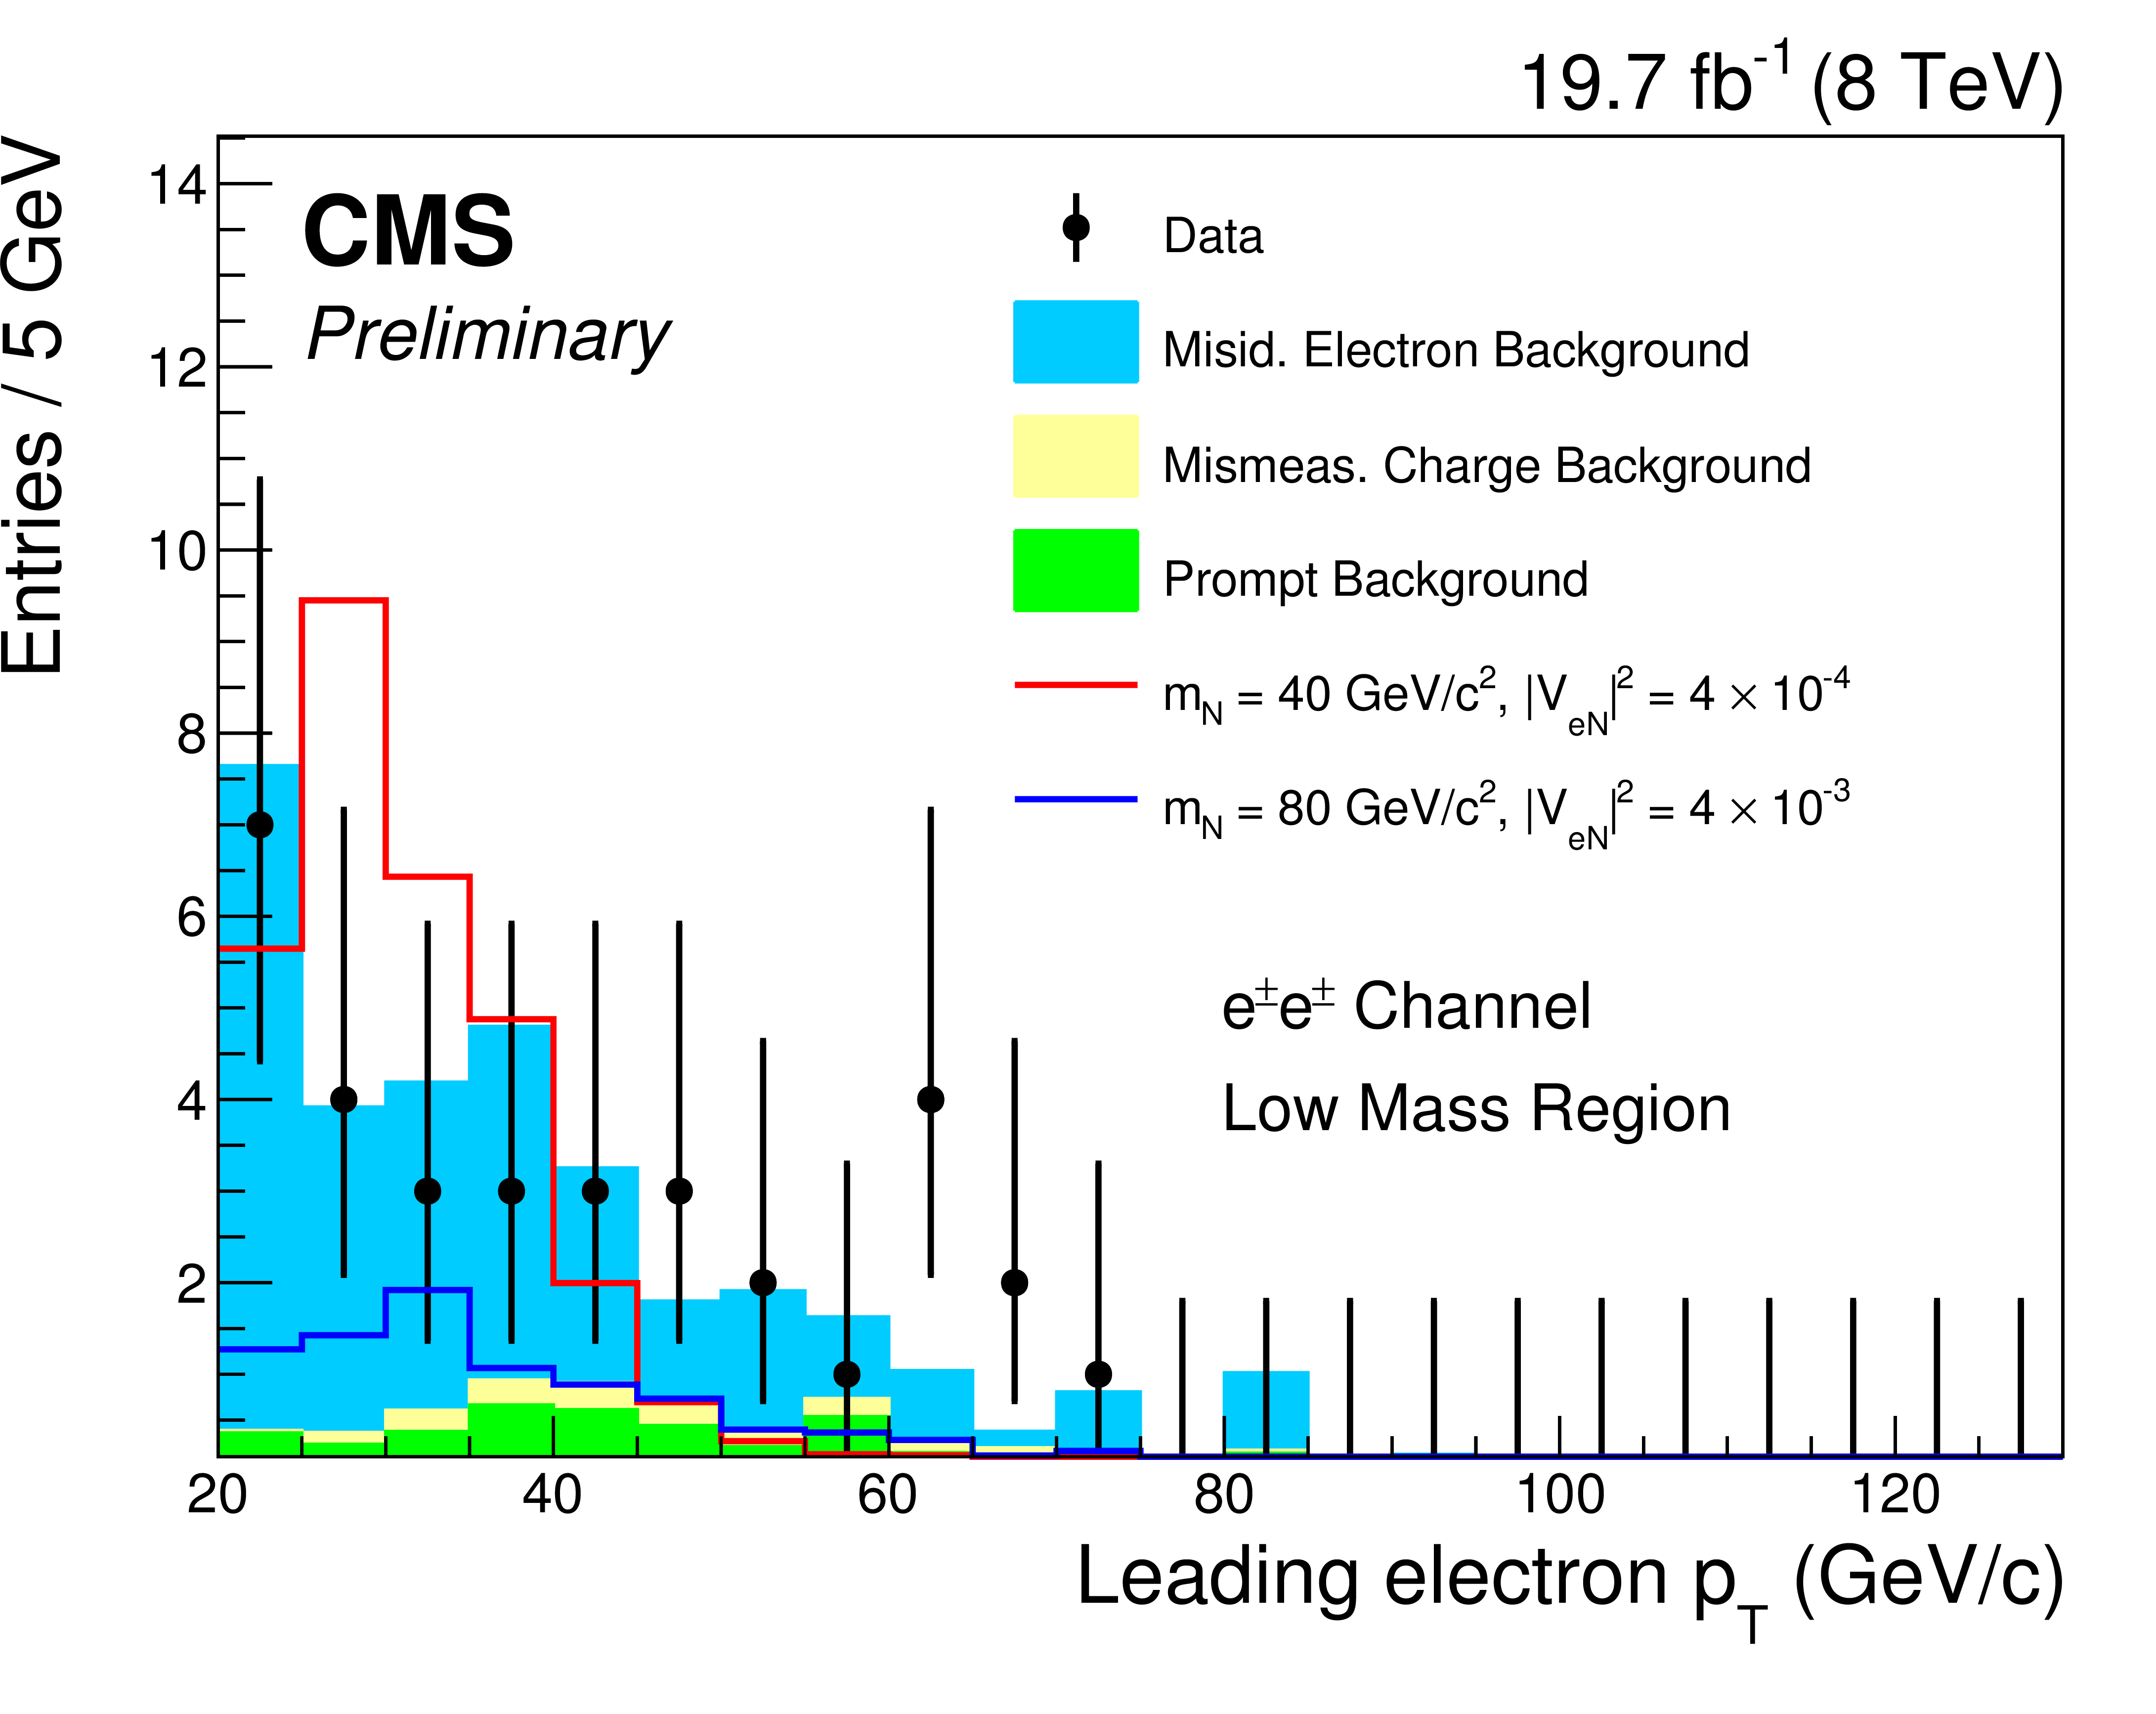
Figure 2-c:
Kinematic distributions for the low-mass selection (dielectron channel) after all selection cuts are applied except for the final optimization requirement: [a] Invariant mass of the trailing $ {p_{\mathrm {T}}} $ lepton and the two selected jets, [b] Invariant mass of two leptons and the two selected jets and [c] the ${p_{\mathrm {T}}} $ of the leading lepton. The plot shows the data, backgrounds, and two choices for the heavy Majorana neutrino signal: $ {m_\mathrm {N}} =$ 40 GeV/$c^2$, $ {| {V_{e \mathrm {N}}} {V_{\mu \mathrm {N}}} ^* | } = 4 \times 10^{-4}$ and $ {m_\mathrm {N}} =$ 80 GeV/$c^2$, $ {| {V_{e \mathrm {N}}} {V_{\mu \mathrm {N}}} ^* | } = 4 \times 10^{-3}$. The prompt background includes diboson (VV), Higgs boson, triboson (VVV) and $\mathrm{t \bar{t}}$V production and is stacked along with the backgrounds from misidentified leptons and mismeasured charge. |

png ; pdf |
Figure 3-a:
Kinematic distributions for the low-mass selection (electron-muon channel) after all selection cuts are applied except for the final optimization requirement: [a] Invariant mass of the trailing $ {p_{\mathrm {T}}} $ lepton and the two selected jets, [b] Invariant mass of two leptons and the two selected jets and [c] the $ {p_{\mathrm {T}}} $ of the leading lepton. The plot shows the data, backgrounds, and two choices for the heavy Majorana neutrino signal: $ {m_\mathrm {N}} =$ 40 GeV/$c^2$, $ {| {V_{e \mathrm {N}}} {V_{\mu \mathrm {N}}} ^* | } = 4 \times 10^{-4}$ and $ {m_\mathrm {N}} =$ 80 GeV/$c^2$, $ {| {V_{e \mathrm {N}}} {V_{\mu \mathrm {N}}} ^* | } = 4 \times 10^{-3}$. The prompt background includes diboson (VV), Higgs boson, triboson (VVV) and $\mathrm{ t \bar{t} }$V production and is stacked along with the backgrounds from misidentified leptons and mismeasured charge. |

png ; pdf |
Figure 3-b:
Kinematic distributions for the low-mass selection (electron-muon channel) after all selection cuts are applied except for the final optimization requirement: [a] Invariant mass of the trailing $ {p_{\mathrm {T}}} $ lepton and the two selected jets, [b] Invariant mass of two leptons and the two selected jets and [c] the $ {p_{\mathrm {T}}} $ of the leading lepton. The plot shows the data, backgrounds, and two choices for the heavy Majorana neutrino signal: $ {m_\mathrm {N}} =$ 40 GeV/$c^2$, $ {| {V_{e \mathrm {N}}} {V_{\mu \mathrm {N}}} ^* | } = 4 \times 10^{-4}$ and $ {m_\mathrm {N}} =$ 80 GeV/$c^2$, $ {| {V_{e \mathrm {N}}} {V_{\mu \mathrm {N}}} ^* | } = 4 \times 10^{-3}$. The prompt background includes diboson (VV), Higgs boson, triboson (VVV) and $\mathrm{ t \bar{t} }$V production and is stacked along with the backgrounds from misidentified leptons and mismeasured charge. |
png ; pdf |
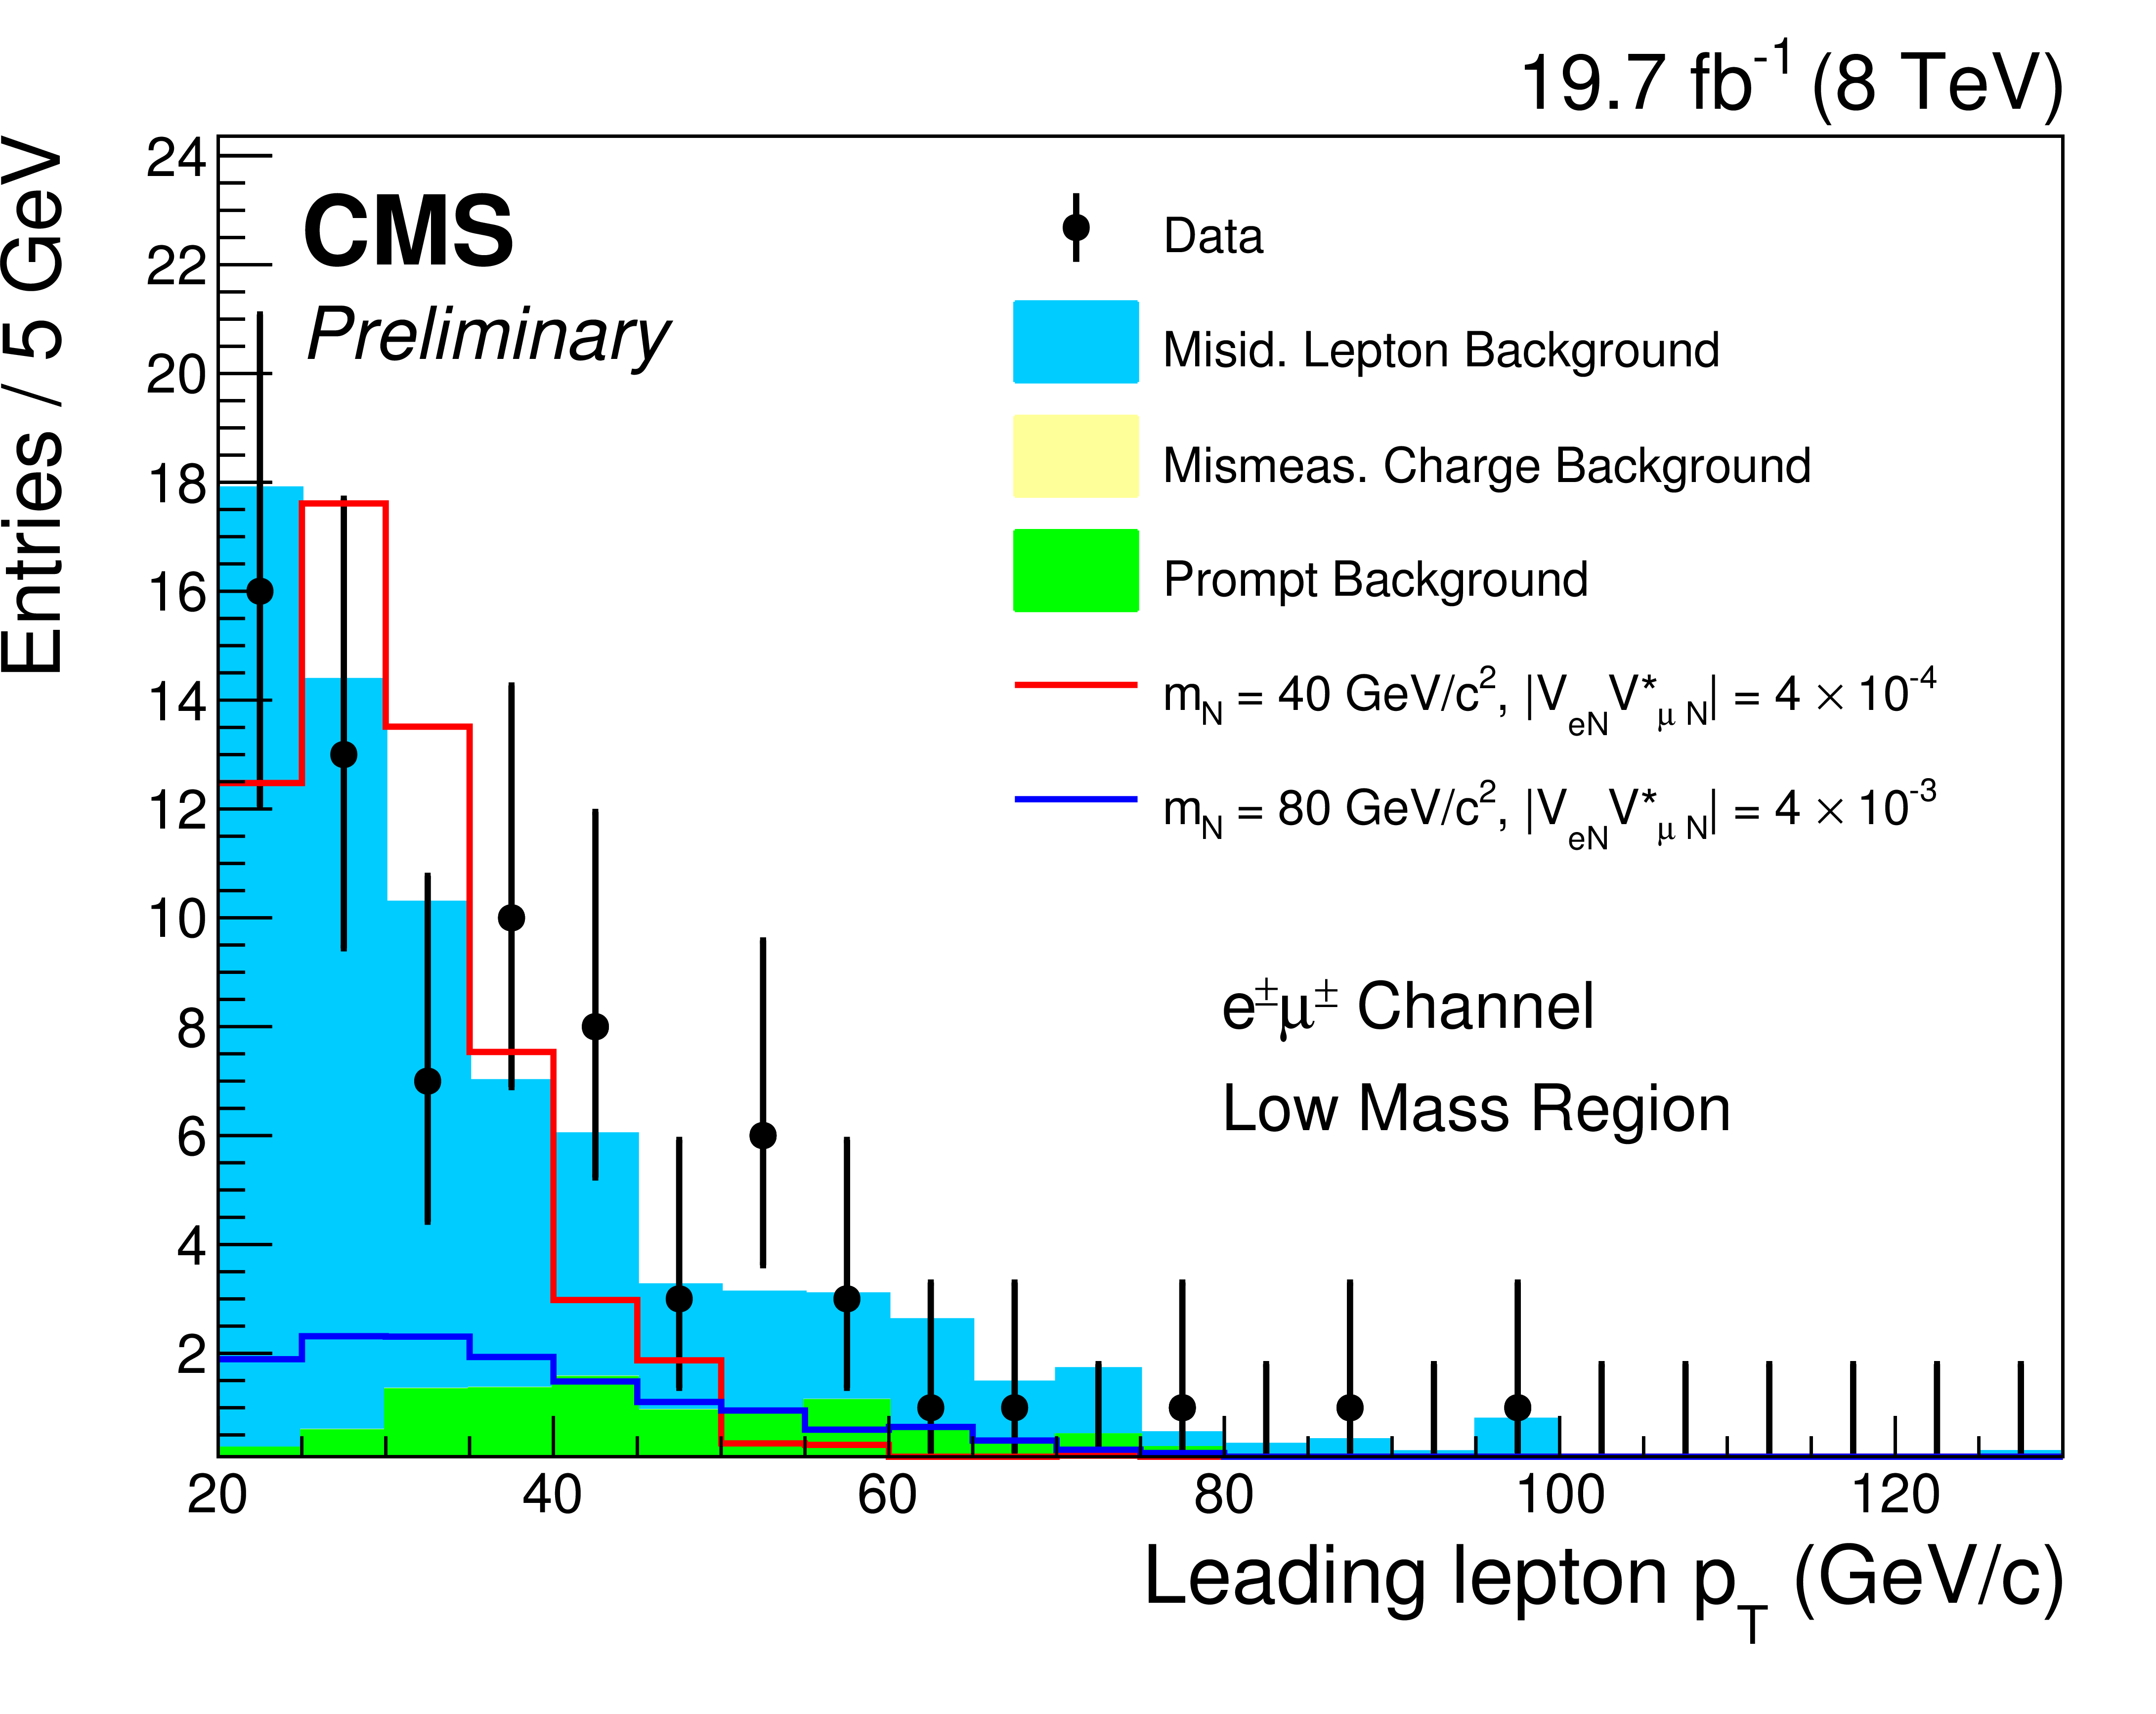
Figure 3-c:
Kinematic distributions for the low-mass selection (electron-muon channel) after all selection cuts are applied except for the final optimization requirement: [a] Invariant mass of the trailing $ {p_{\mathrm {T}}} $ lepton and the two selected jets, [b] Invariant mass of two leptons and the two selected jets and [c] the $ {p_{\mathrm {T}}} $ of the leading lepton. The plot shows the data, backgrounds, and two choices for the heavy Majorana neutrino signal: $ {m_\mathrm {N}} =$ 40 GeV/$c^2$, $ {| {V_{e \mathrm {N}}} {V_{\mu \mathrm {N}}} ^* | } = 4 \times 10^{-4}$ and $ {m_\mathrm {N}} =$ 80 GeV/$c^2$, $ {| {V_{e \mathrm {N}}} {V_{\mu \mathrm {N}}} ^* | } = 4 \times 10^{-3}$. The prompt background includes diboson (VV), Higgs boson, triboson (VVV) and $\mathrm{ t \bar{t} }$V production and is stacked along with the backgrounds from misidentified leptons and mismeasured charge. |

png ; pdf |
Figure 4-a:
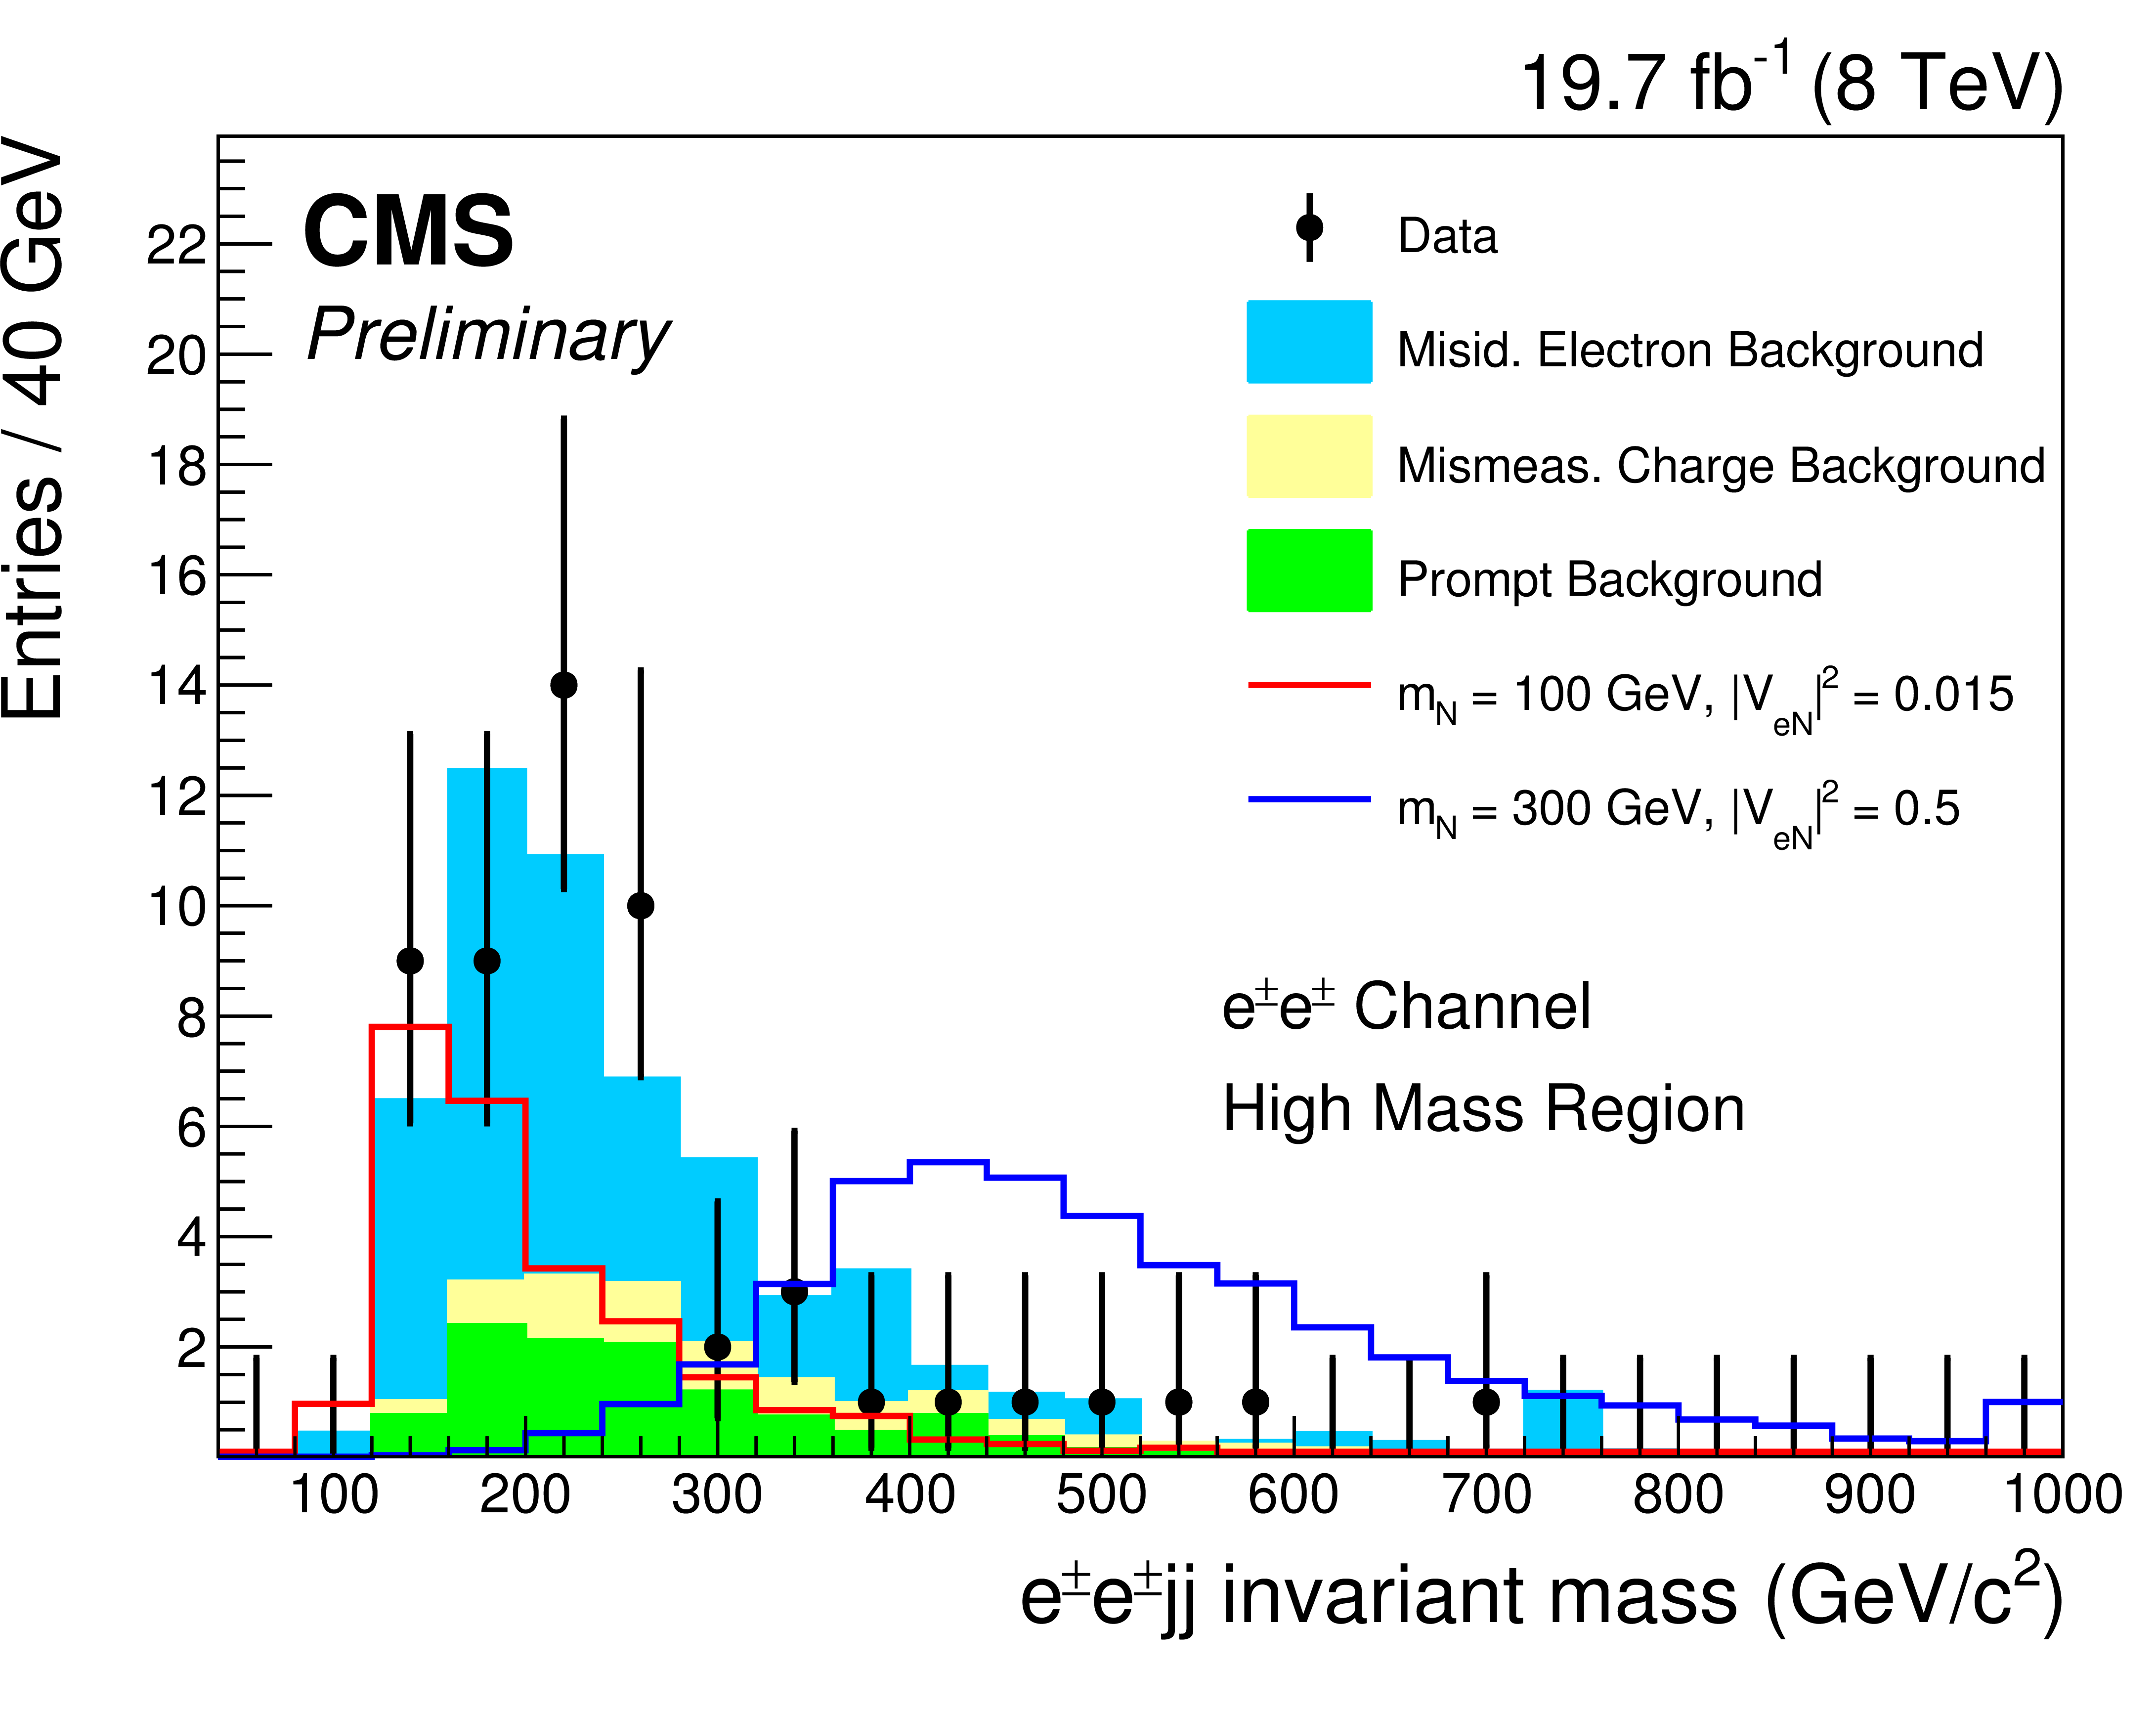
Kinematic distributions for the high-mass selection (dielectron channel) after all selection cuts are applied except for the final optimization requirement: [a] Invariant mass of the trailing $ {p_{\mathrm {T}}} $ lepton and the two selected jets, [b] Invariant mass of two leptons and the two selected jets and [c] the ${p_{\mathrm {T}}} $ of the leading lepton. The plot shows the data, backgrounds, and two choices for the heavy Majorana neutrino signal: $ {m_\mathrm {N}} =$ 100 GeV/$c^2$, $ {| {V_{e \mathrm {N}}} {V_{\mu \mathrm {N}}} ^* | } =$ 0.015 and $ {m_\mathrm {N}} =$ 300 GeV/$c^2$, $ {| {V_{e \mathrm {N}}} {V_{\mu \mathrm {N}}} ^* | } =$ 0.5. The prompt background includes diboson (VV), Higgs boson, triboson (VVV) and $\mathrm{ t \bar{t} }$V production and is stacked along with the backgrounds from misidentified leptons and mismeasured charge. |
png ; pdf |
Figure 4-b:
Kinematic distributions for the high-mass selection (dielectron channel) after all selection cuts are applied except for the final optimization requirement: [a] Invariant mass of the trailing $ {p_{\mathrm {T}}} $ lepton and the two selected jets, [b] Invariant mass of two leptons and the two selected jets and [c] the ${p_{\mathrm {T}}} $ of the leading lepton. The plot shows the data, backgrounds, and two choices for the heavy Majorana neutrino signal: $ {m_\mathrm {N}} =$ 100 GeV/$c^2$, $ {| {V_{e \mathrm {N}}} {V_{\mu \mathrm {N}}} ^* | } =$ 0.015 and $ {m_\mathrm {N}} =$ 300 GeV/$c^2$, $ {| {V_{e \mathrm {N}}} {V_{\mu \mathrm {N}}} ^* | } =$ 0.5. The prompt background includes diboson (VV), Higgs boson, triboson (VVV) and $\mathrm{ t \bar{t} }$V production and is stacked along with the backgrounds from misidentified leptons and mismeasured charge. |

png ; pdf |
Figure 4-c:
Kinematic distributions for the high-mass selection (dielectron channel) after all selection cuts are applied except for the final optimization requirement: [a] Invariant mass of the trailing $ {p_{\mathrm {T}}} $ lepton and the two selected jets, [b] Invariant mass of two leptons and the two selected jets and [c] the ${p_{\mathrm {T}}} $ of the leading lepton. The plot shows the data, backgrounds, and two choices for the heavy Majorana neutrino signal: $ {m_\mathrm {N}} =$ 100 GeV/$c^2$, $ {| {V_{e \mathrm {N}}} {V_{\mu \mathrm {N}}} ^* | } =$ 0.015 and $ {m_\mathrm {N}} =$ 300 GeV/$c^2$, $ {| {V_{e \mathrm {N}}} {V_{\mu \mathrm {N}}} ^* | } =$ 0.5. The prompt background includes diboson (VV), Higgs boson, triboson (VVV) and $\mathrm{ t \bar{t} }$V production and is stacked along with the backgrounds from misidentified leptons and mismeasured charge. |

png ; pdf |
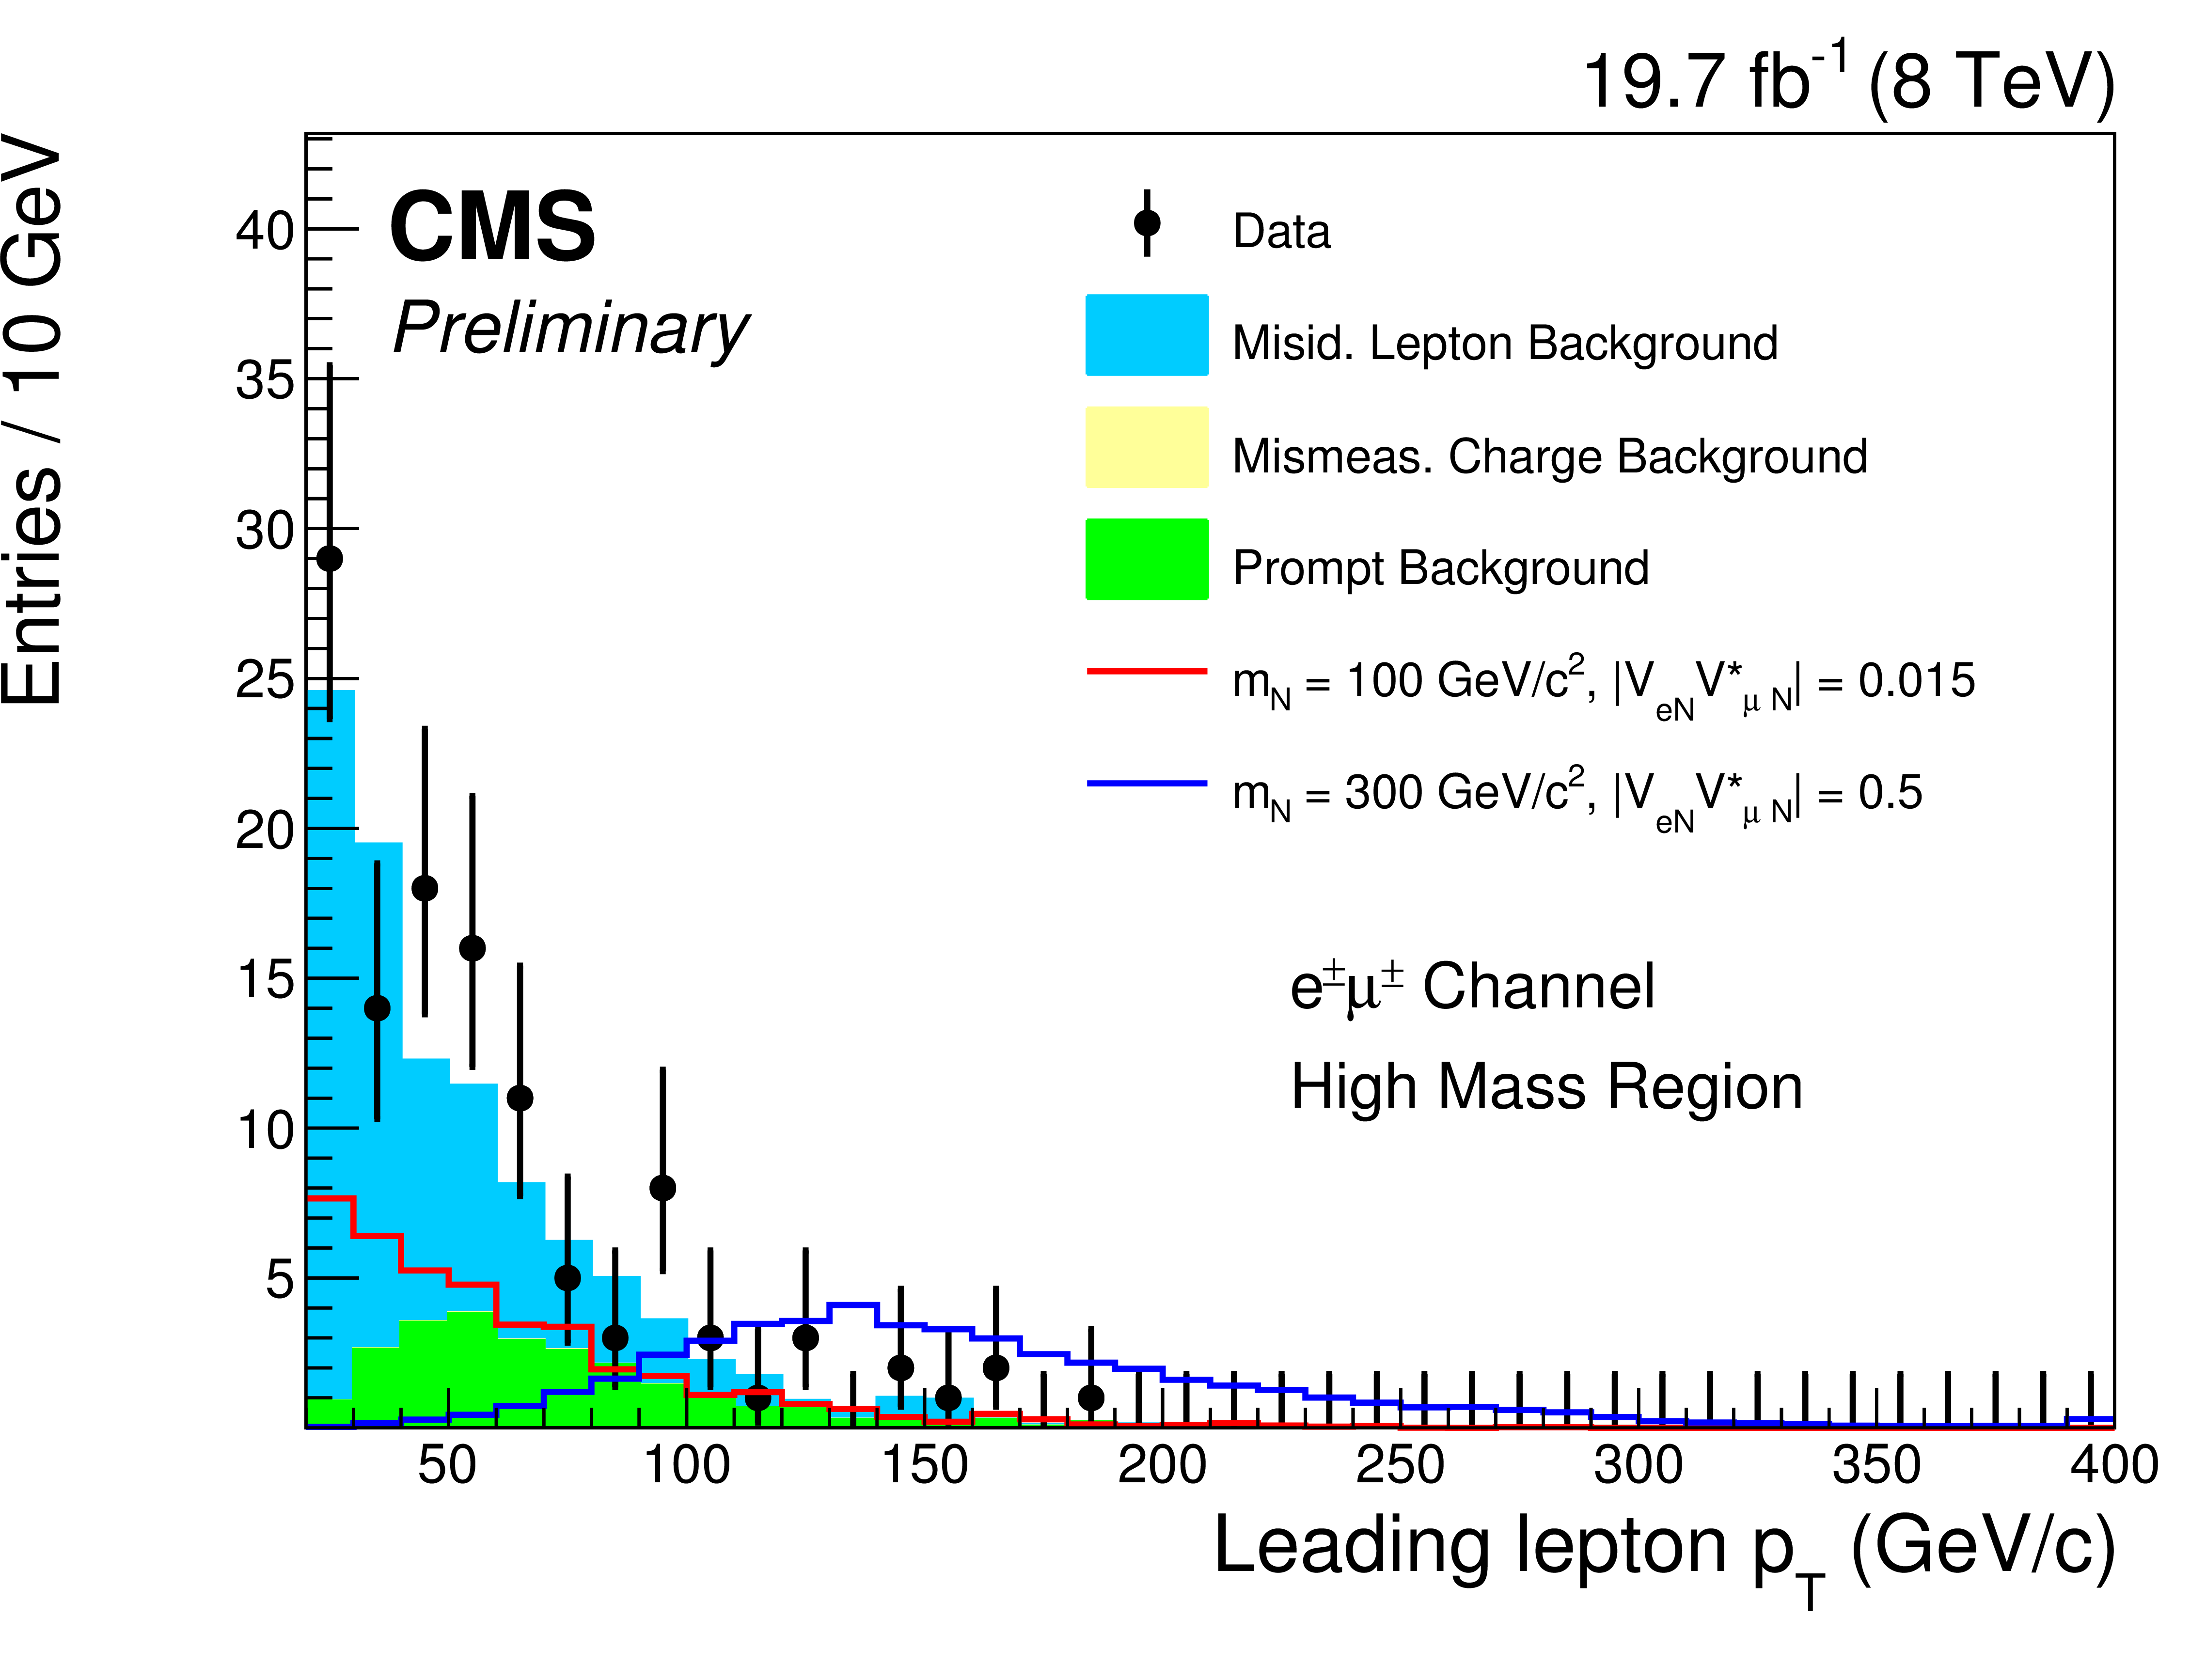
Figure 5-a:
Kinematic distributions for the high-mass selection (electron-muon channel) after all selection cuts are applied except for the final optimization requirement: [a] Invariant mass of the trailing $ {p_{\mathrm {T}}} $ lepton and the two selected jets, [b] Invariant mass of two leptons and the two selected jets and [c] the $ {p_{\mathrm {T}}} $ of the leading lepton. The plot shows the data, backgrounds, and two choices for the heavy Majorana neutrino signal: $ {m_\mathrm {N}} =$ 100 GeV/$c^2$, $ {| {V_{e \mathrm {N}}} {V_{\mu \mathrm {N}}} ^* | } =$ 0.015 and $ {m_\mathrm {N}} =$ 300 GeV/$c^2$, $ {| {V_{e \mathrm {N}}} {V_{\mu \mathrm {N}}} ^* | } = 0.5$. The prompt background includes diboson (VV), Higgs boson, triboson (VVV) and $ \mathrm{ t \bar{t} } $V production and is stacked along with the backgrounds from misidentified leptons and mismeasured charge. |

png ; pdf |
Figure 5-b:
Kinematic distributions for the high-mass selection (electron-muon channel) after all selection cuts are applied except for the final optimization requirement: [a] Invariant mass of the trailing $ {p_{\mathrm {T}}} $ lepton and the two selected jets, [b] Invariant mass of two leptons and the two selected jets and [c] the $ {p_{\mathrm {T}}} $ of the leading lepton. The plot shows the data, backgrounds, and two choices for the heavy Majorana neutrino signal: $ {m_\mathrm {N}} =$ 100 GeV/$c^2$, $ {| {V_{e \mathrm {N}}} {V_{\mu \mathrm {N}}} ^* | } =$ 0.015 and $ {m_\mathrm {N}} =$ 300 GeV/$c^2$, $ {| {V_{e \mathrm {N}}} {V_{\mu \mathrm {N}}} ^* | } = 0.5$. The prompt background includes diboson (VV), Higgs boson, triboson (VVV) and $ \mathrm{ t \bar{t} } $V production and is stacked along with the backgrounds from misidentified leptons and mismeasured charge. |
png ; pdf |
Figure 5-c:
Kinematic distributions for the high-mass selection (electron-muon channel) after all selection cuts are applied except for the final optimization requirement: [a] Invariant mass of the trailing $ {p_{\mathrm {T}}} $ lepton and the two selected jets, [b] Invariant mass of two leptons and the two selected jets and [c] the $ {p_{\mathrm {T}}} $ of the leading lepton. The plot shows the data, backgrounds, and two choices for the heavy Majorana neutrino signal: $ {m_\mathrm {N}} =$ 100 GeV/$c^2$, $ {| {V_{e \mathrm {N}}} {V_{\mu \mathrm {N}}} ^* | } =$ 0.015 and $ {m_\mathrm {N}} =$ 300 GeV/$c^2$, $ {| {V_{e \mathrm {N}}} {V_{\mu \mathrm {N}}} ^* | } = 0.5$. The prompt background includes diboson (VV), Higgs boson, triboson (VVV) and $ \mathrm{ t \bar{t} } $V production and is stacked along with the backgrounds from misidentified leptons and mismeasured charge. |

png ; pdf |
Figure 6-a:
[a] Exclusion region at 95% CL in the square of the heavy Majorana neutrino mixing parameter as a function of the heavy Majorana neutrino mass: ($ {| {V_{e \mathrm {N}}} ^2 | }$ vs. $ {m_\mathrm {N}} $). The dashed black curve is the expected upper limit, with one and two standard-deviation bands shown in dark green and light yellow, respectively. The solid black curve is the observed upper limit. Also shown are the upper limits from other direct searches: L3 [21], DELPHI [20], and the upper limits from CMS obtained with the 2011 LHC data at $\sqrt {s} = 7$ TeV [29]. [b] An expanded view of the region 40 GeV/$c^2$ $< {m_\mathrm {N}} <$ 200 GeV/$c^2$. |

png ; pdf |
Figure 6-b:
[a] Exclusion region at 95% CL in the square of the heavy Majorana neutrino mixing parameter as a function of the heavy Majorana neutrino mass: ($ {| {V_{e \mathrm {N}}} ^2 | }$ vs. $ {m_\mathrm {N}} $). The dashed black curve is the expected upper limit, with one and two standard-deviation bands shown in dark green and light yellow, respectively. The solid black curve is the observed upper limit. Also shown are the upper limits from other direct searches: L3 [21], DELPHI [20], and the upper limits from CMS obtained with the 2011 LHC data at $\sqrt {s} = 7$ TeV [29]. [b] An expanded view of the region 40 GeV/$c^2$ $< {m_\mathrm {N}} <$ 200 GeV/$c^2$. |

png ; pdf |
Figure 7:
Exclusion region at 95% CL in the cross section times branching fraction, as a function of the heavy Majorana neutrino mass. The dashed curve is the expected upper limit, with one and two standard-deviation bands shown in dark green and light yellow, respectively. The solid black curve is the observed upper limit. |

png ; pdf |
Figure 8-a:
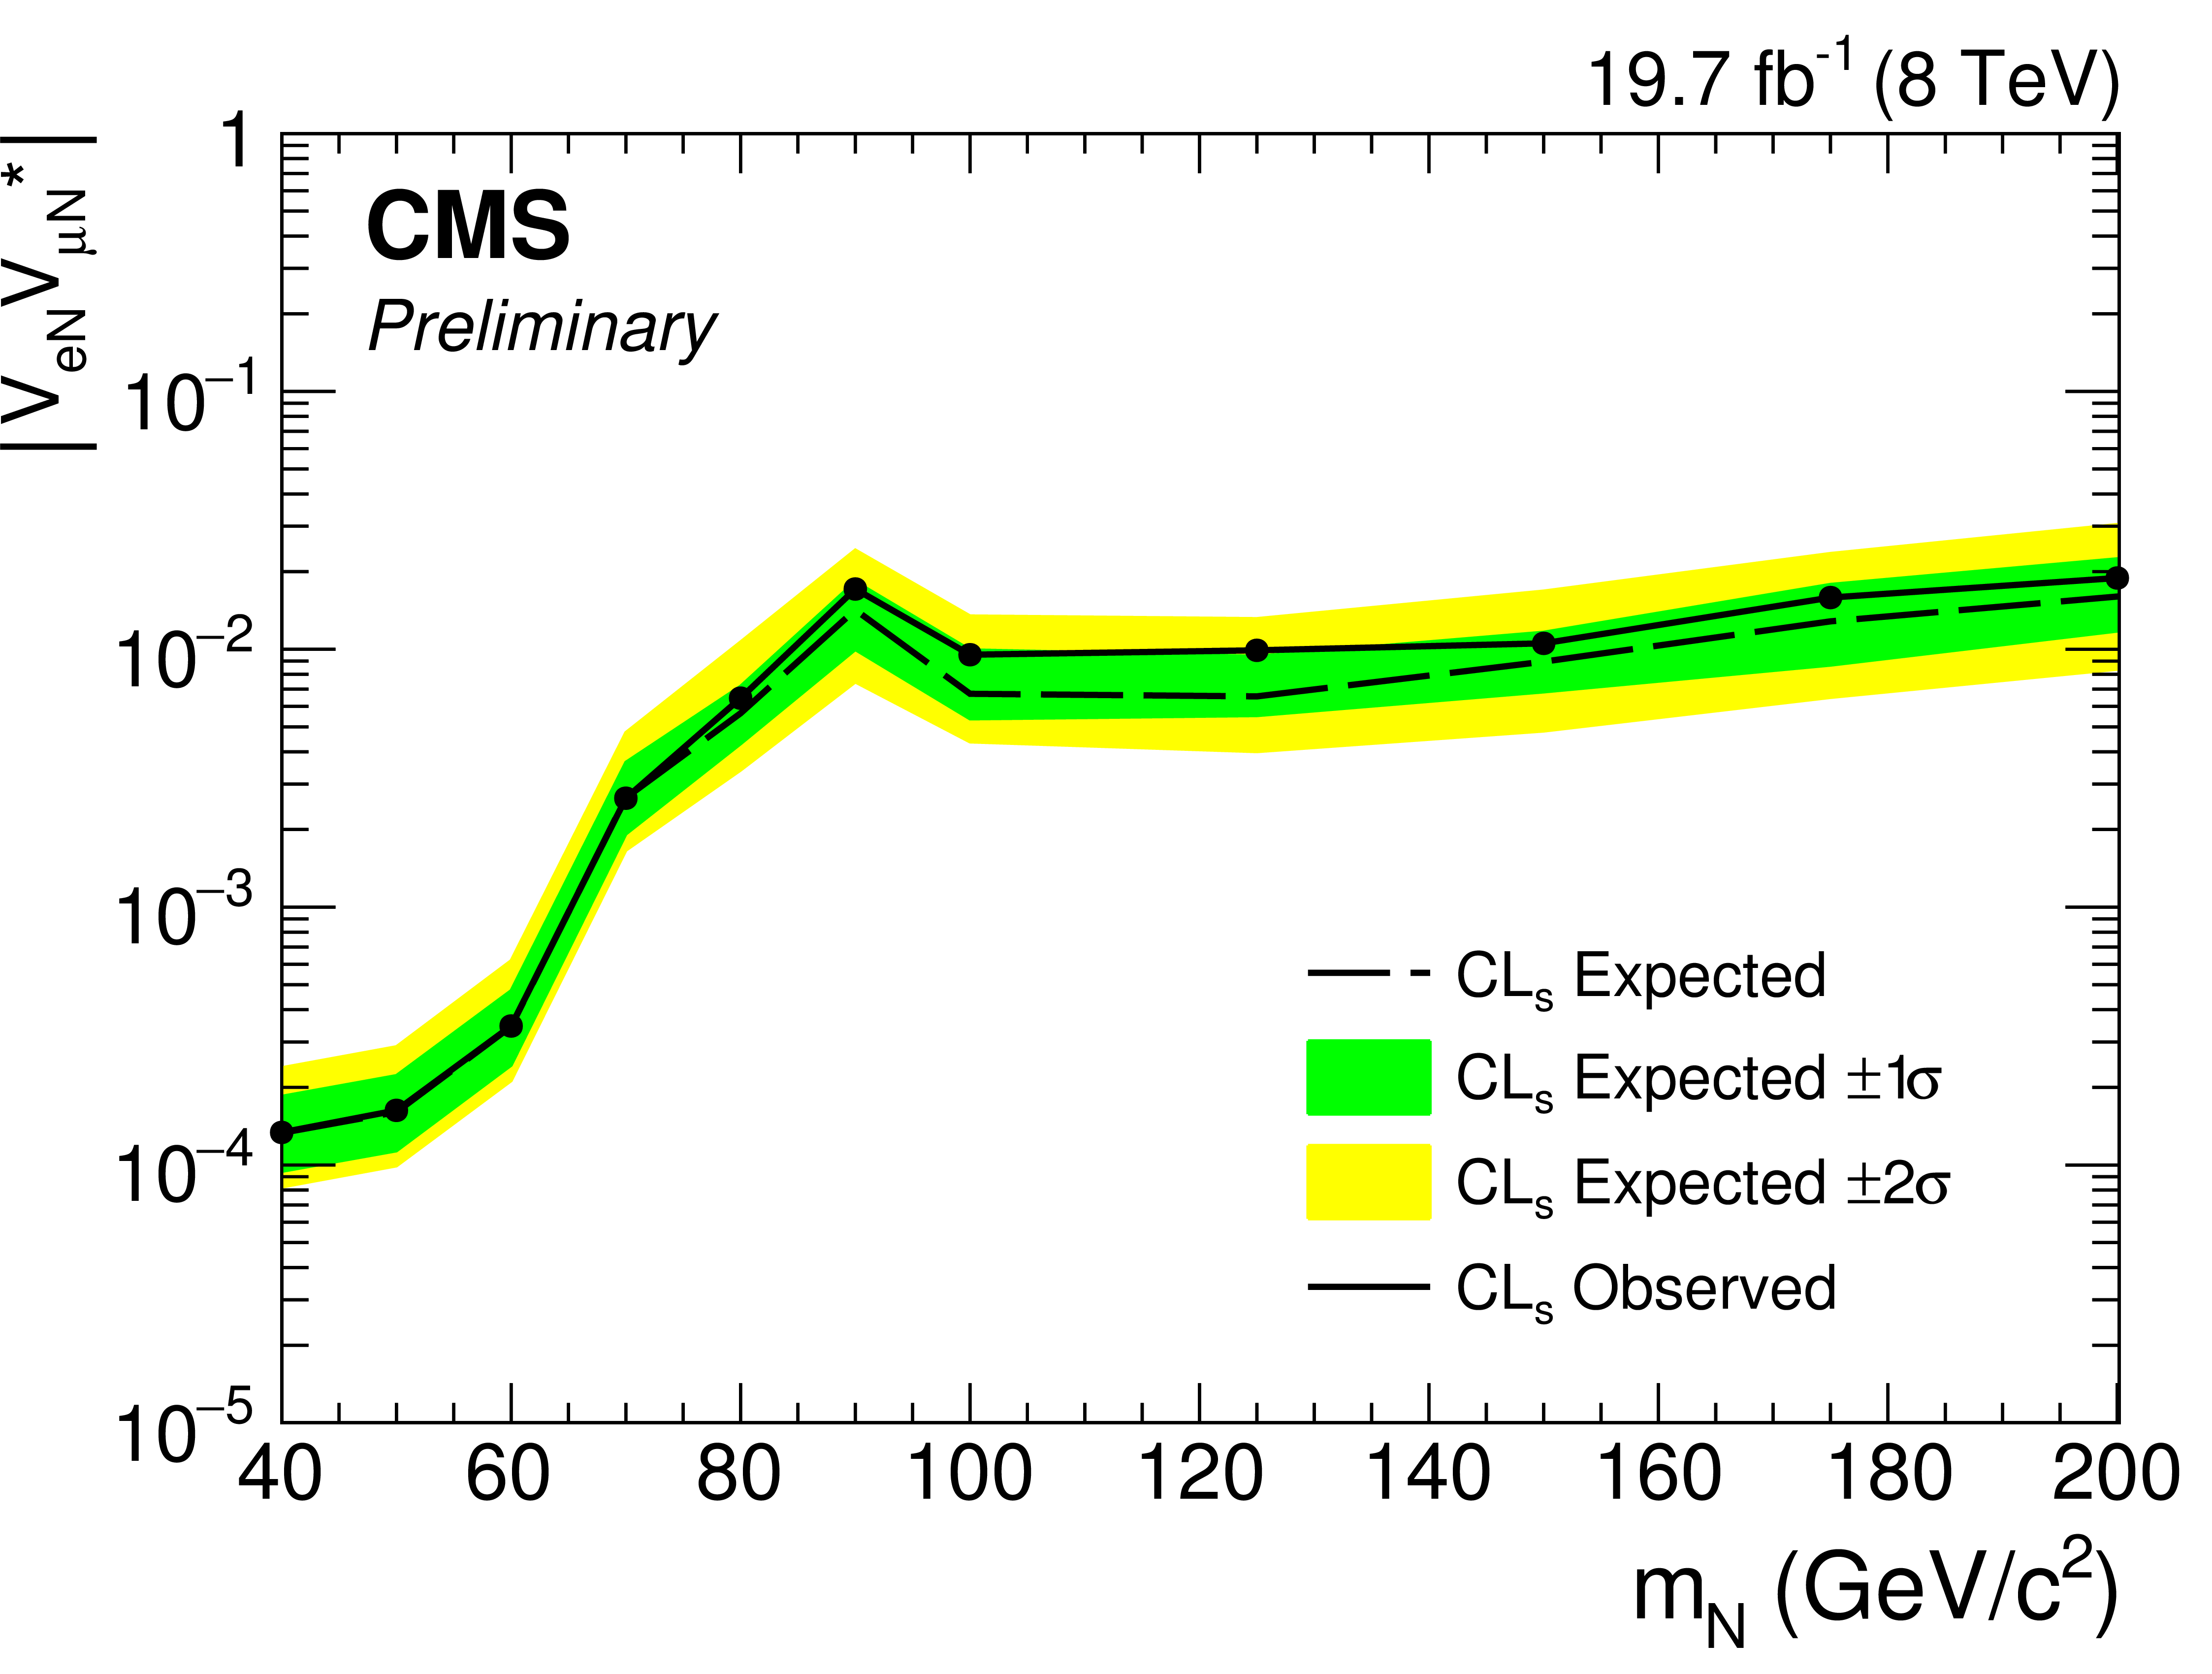
[a] Exclusion region at 95% CL in the square of the heavy Majorana neutrino mixing parameter as a function of the heavy Majorana neutrino mass: ($ {| {V_{e \mathrm {N}}} {V_{\mu \mathrm {N}}} ^* | }$ vs. $ {m_\mathrm {N}} $). The dashed black curve is the expected upper limit, with one and two standard-deviation bands shown in dark green and light yellow, respectively. The solid black curve is the observed upper limit. [b] An expanded view of the region 40 GeV/$c^2$ $ < {m_\mathrm {N}} < $ 200 GeV/$c^2$. |
png ; pdf |
Figure 8-b:
[a] Exclusion region at 95% CL in the square of the heavy Majorana neutrino mixing parameter as a function of the heavy Majorana neutrino mass: ($ {| {V_{e \mathrm {N}}} {V_{\mu \mathrm {N}}} ^* | }$ vs. $ {m_\mathrm {N}} $). The dashed black curve is the expected upper limit, with one and two standard-deviation bands shown in dark green and light yellow, respectively. The solid black curve is the observed upper limit. [b] An expanded view of the region 40 GeV/$c^2$ $ < {m_\mathrm {N}} < $ 200 GeV/$c^2$. |

png ; pdf |
Figure 9:
Exclusion region at 95% CL in the cross section times branching fraction, as a function of the heavy Majorana neutrino mass. The dashed curve is the expected upper limit, with one and two standard-deviation bands shown in dark green and light yellow, respectively. The solid black curve is the observed upper limit. |
|
|
Compact Muon Solenoid LHC, CERN |
|

|

|

|

|

|