

Compact Muon Solenoid
LHC, CERN
| CMS-PAS-EXO-12-054 | ||
| Search for dark matter and unparticles produced in association with a Z boson in pp collisions at $\sqrt{s} =$ 8 TeV | ||
| CMS Collaboration | ||
| July 2015 | ||
| Abstract: Events containing two oppositely charged same-flavor leptons and large missing transverse energy are investigated to probe for evidence of dark matter (DM) or unparticle production at the Large Hadron Collider (LHC). This study is based on the data collected by the CMS detector corresponding to an integrated luminosity of 19.7 fb$^{-1}$ of pp collisions at the LHC at a center-of-mass energy of 8 TeV. In the selected signal region, the observed data are consistent with the expected standard model backgrounds; no excess of events is observed. The results are interpreted in terms of 90% confidence level limits on the DM-nucleon scattering cross section, as a function of the DM particle mass, for both spin-dependent and spin-independent scenarios. Limits are also set on the DM annihilation rate assuming 100% branching fraction of DM annihilating to quarks and on the effective coupling cut-off scale $\Lambda$. Finally, the most stringent limits on the unparticle model parameters $\lambda$ and $\Lambda_{\mathcal U}$ are obtained. | ||
|
Links:
CDS record (PDF) ;
Public twiki page ;
CADI line (restricted) ; Figures are also available from the CDS record. These preliminary results are superseded in this paper, PRD 93 (2016) 052011. |
||
| Figures | |

png ; pdf |
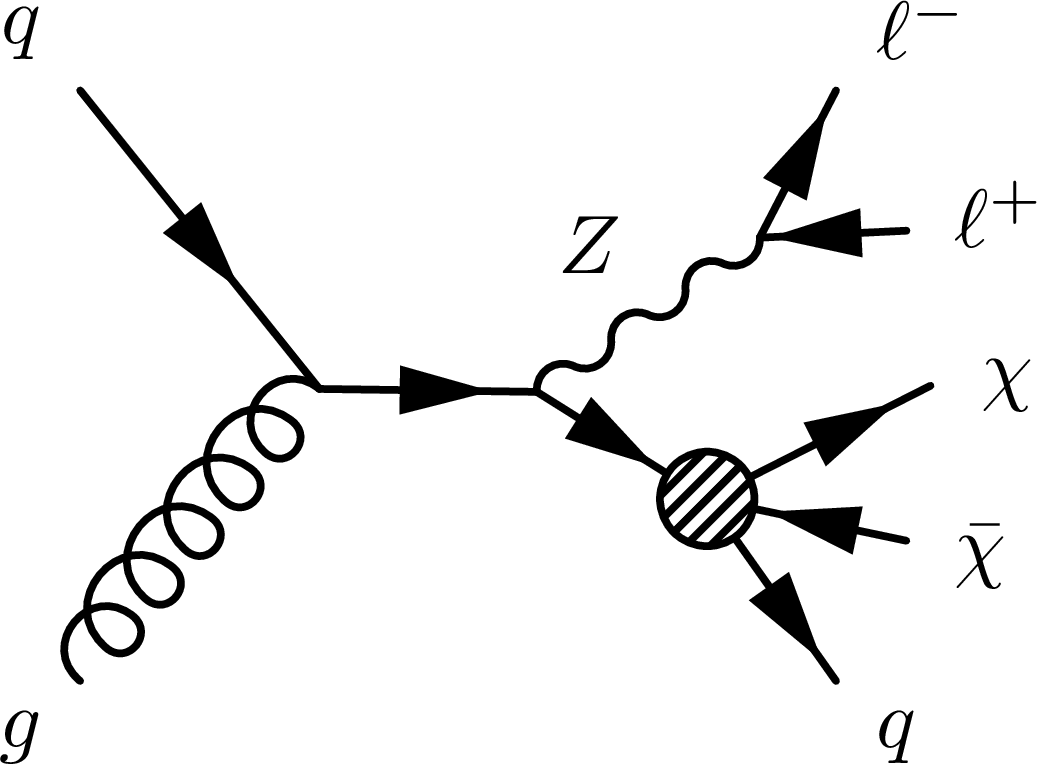
Figure 1-a:
The main Feynman diagrams for production of DM pairs (a), DM pairs plus an additional quark (a and c) together with a Z boson. The hatched circles represent the interaction modeled with effective field theory. |
png ; pdf |
Figure 1-b:
The main Feynman diagrams for production of DM pairs (a), DM pairs plus an additional quark (a and c) together with a Z boson. The hatched circles represent the interaction modeled with effective field theory. |

png ; pdf |
Figure 1-c:
The main Feynman diagrams for production of DM pairs (a), DM pairs plus an additional quark (a and c) together with a Z boson. The hatched circles represent the interaction modeled with effective field theory. |
png ; pdf |
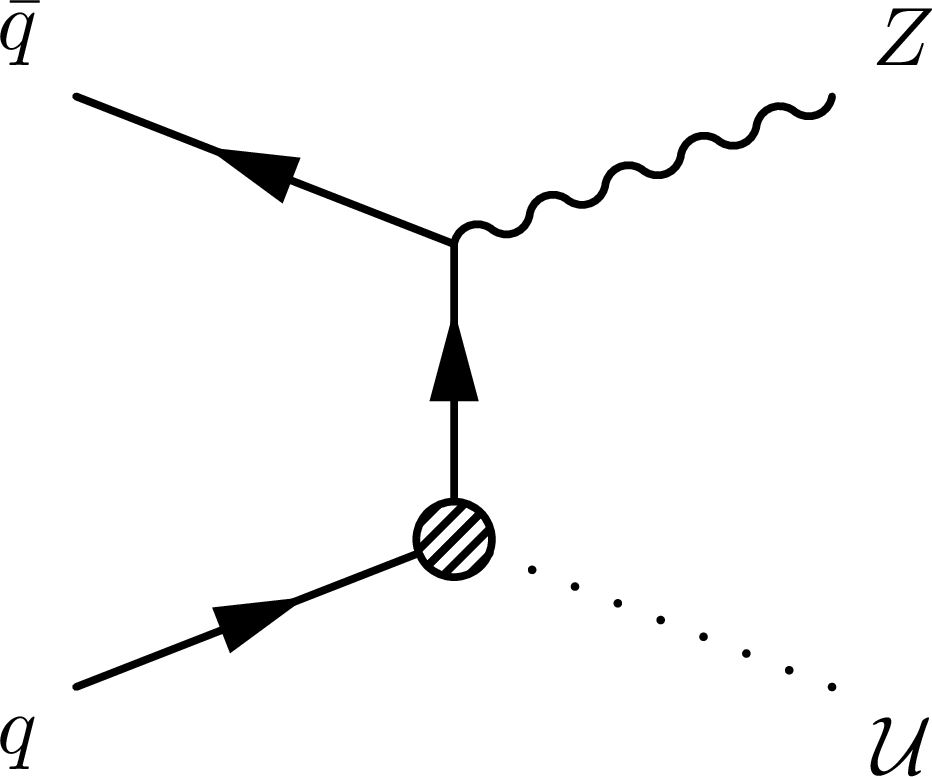
Figure 2-a:
Feynman diagrams for the unparticle production in association with a Z boson. |

png ; pdf |
Figure 2-b:
Feynman diagrams for the unparticle production in association with a Z boson. |

png ; pdf |
Figure 2-c:
Feynman diagrams for the unparticle production in association with a Z boson. |

png ; pdf |
Figure 2-d:
Feynman diagrams for the unparticle production in association with a Z boson. |
png ; pdf |
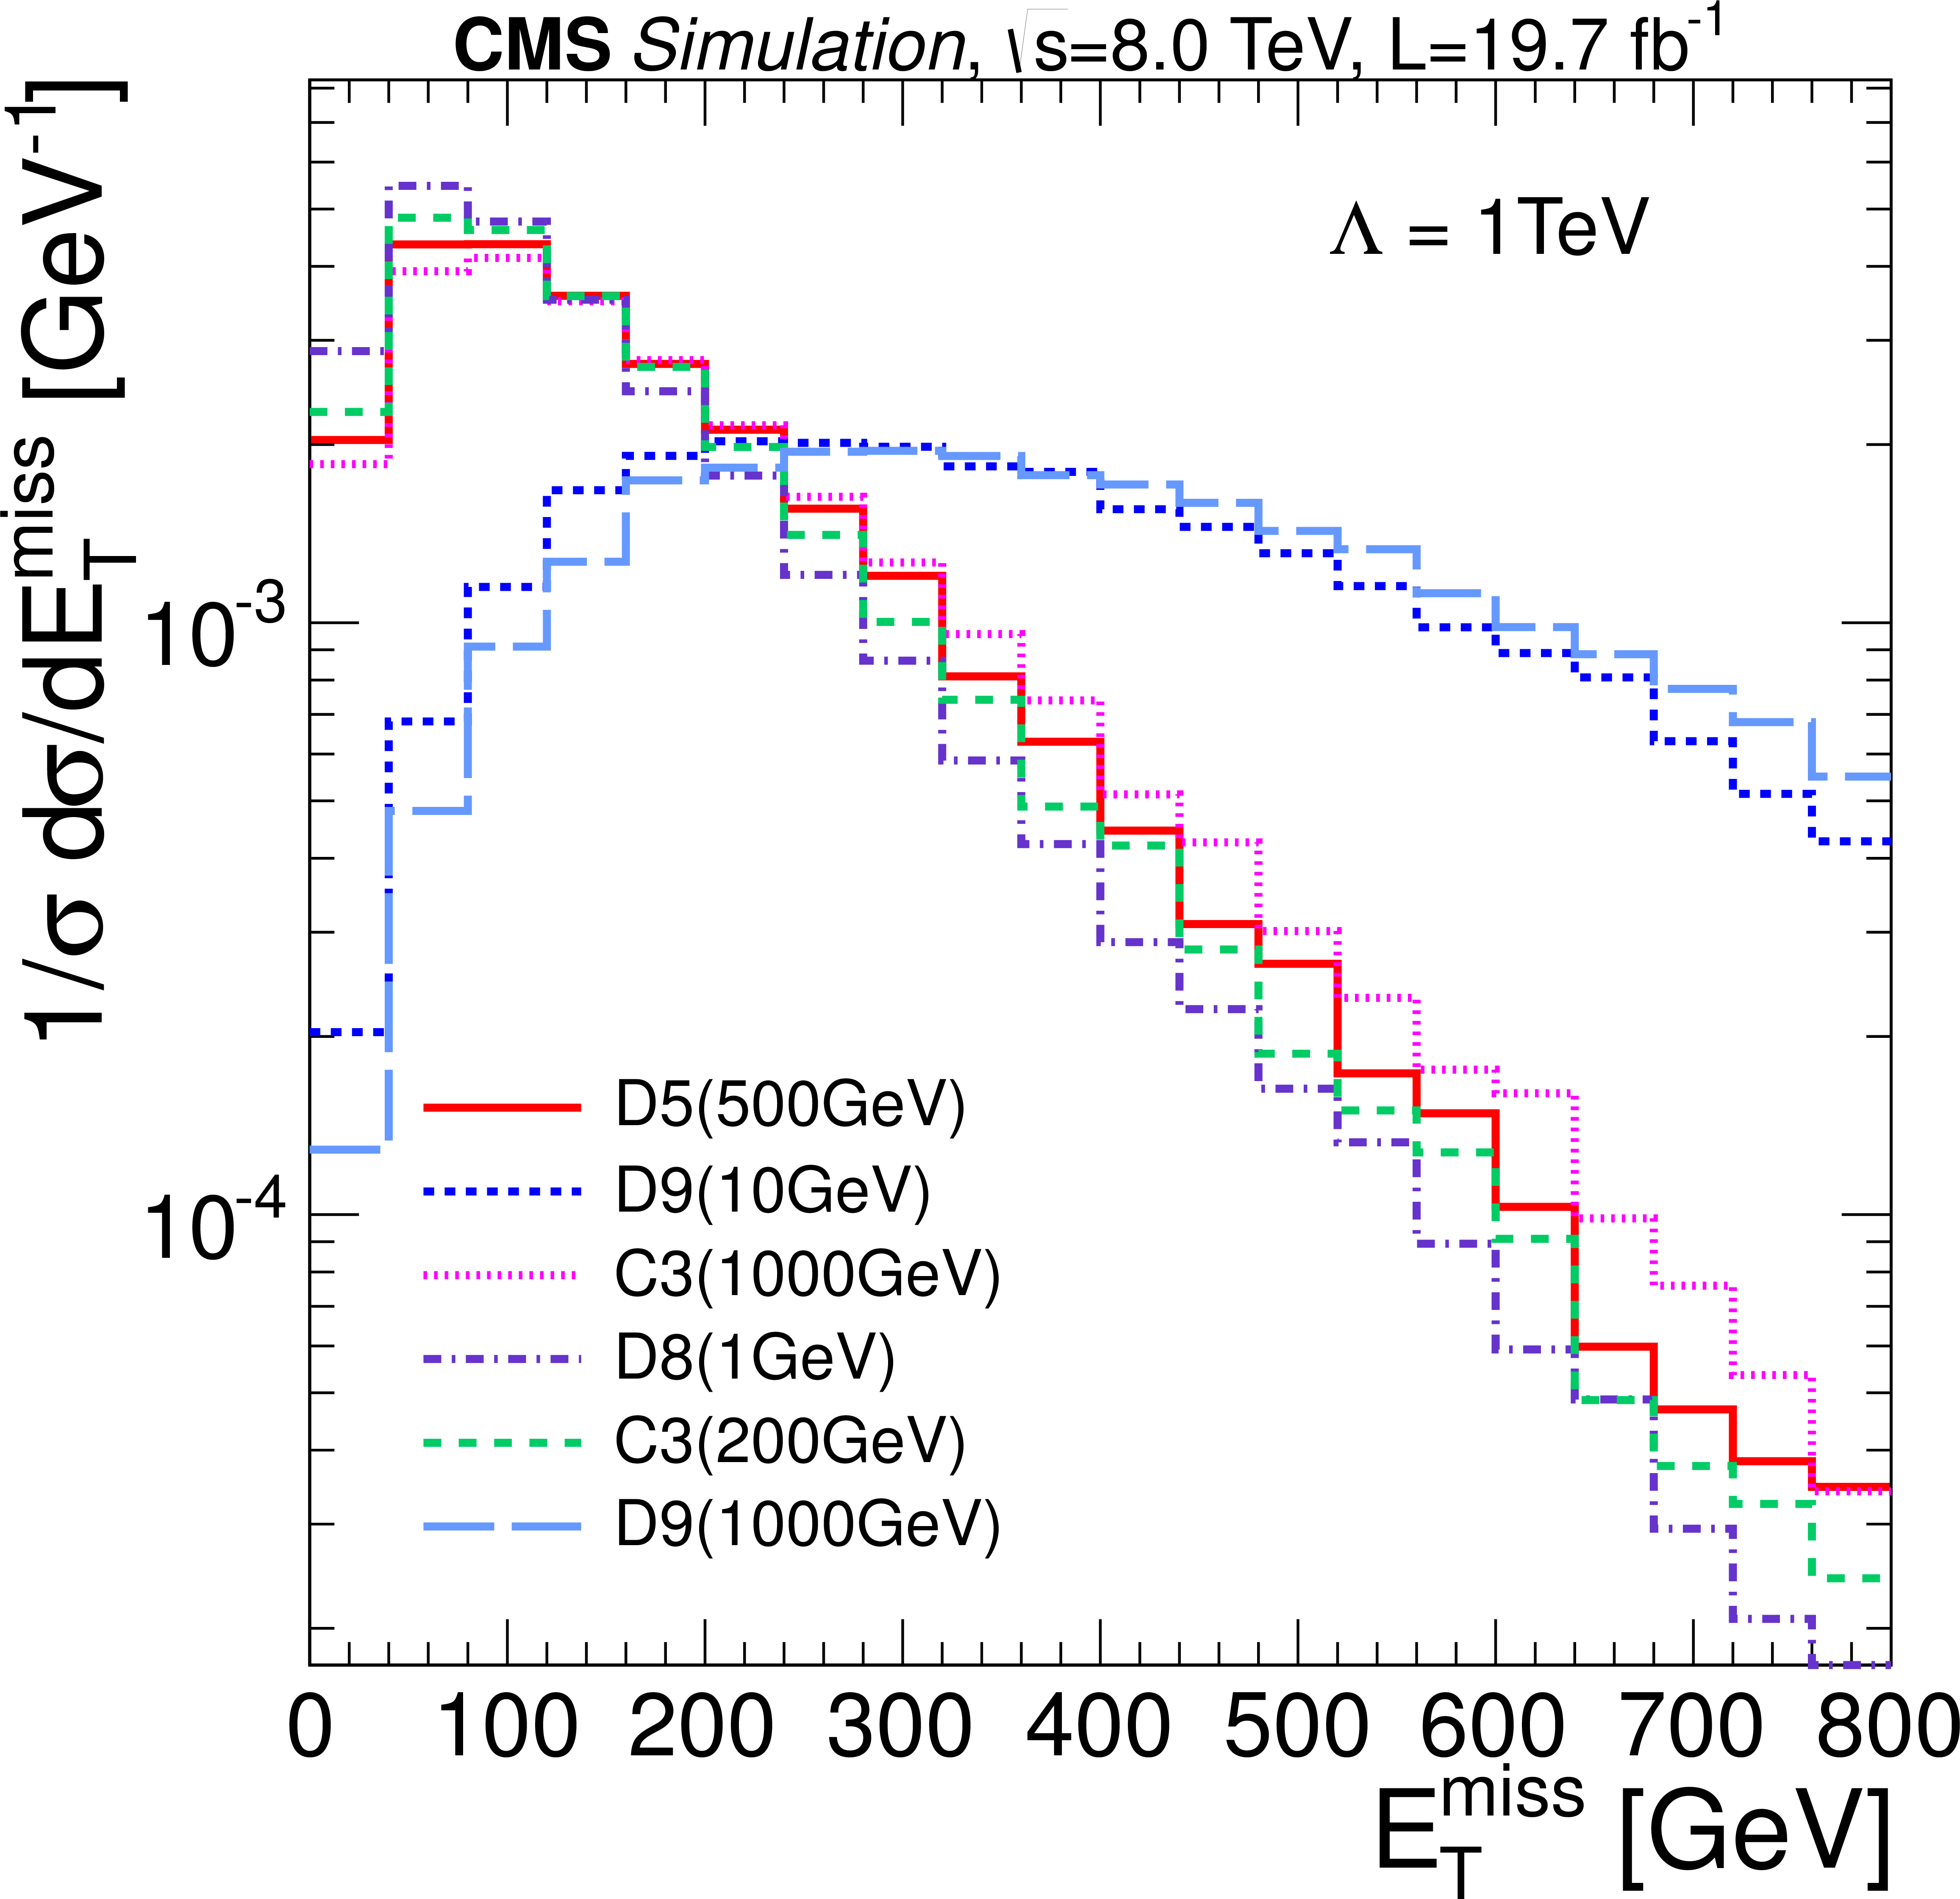
Figure 3-a:
The distribution of $ { {E_\mathrm {T}}^{\mathrm {miss}}}$ at generator level. a: DM for different $M_\chi $ with vector (D5), axial-vector (D8) and tensor (D9) coupling for Dirac fermion and vector (C3) coupling for complex scalar. b: scalar unparticle coupling $\lambda $ between unparticle and SM fields is set to 1, and the scale dimension parameter $\it {d}_{\mathcal U}$ ranges from 1.5 to 2.1. |

png ; pdf |
Figure 3-b:
The distribution of $ { {E_\mathrm {T}}^{\mathrm {miss}}}$ at generator level. a: DM for different $M_\chi $ with vector (D5), axial-vector (D8) and tensor (D9) coupling for Dirac fermion and vector (C3) coupling for complex scalar. b: scalar unparticle coupling $\lambda $ between unparticle and SM fields is set to 1, and the scale dimension parameter $\it {d}_{\mathcal U}$ ranges from 1.5 to 2.1. |

png ; pdf |
Figure 4-a:
The distribution of $ { {E_\mathrm {T}}^{\mathrm {miss}}}$ from $ {\mathrm {Z}} \to {\mathrm {ee}} $ (a) and $ {\mathrm {Z}} \to \mu \mu $ channel (b) after preselection. The selected signals are superimposed separately. The overflow events are stacked in the last bin. |

png ; pdf |
Figure 4-b:
The distribution of $ { {E_\mathrm {T}}^{\mathrm {miss}}}$ from $ {\mathrm {Z}} \to {\mathrm {ee}} $ (a) and $ {\mathrm {Z}} \to \mu \mu $ channel (b) after preselection. The selected signals are superimposed separately. The overflow events are stacked in the last bin. |
png ; pdf |
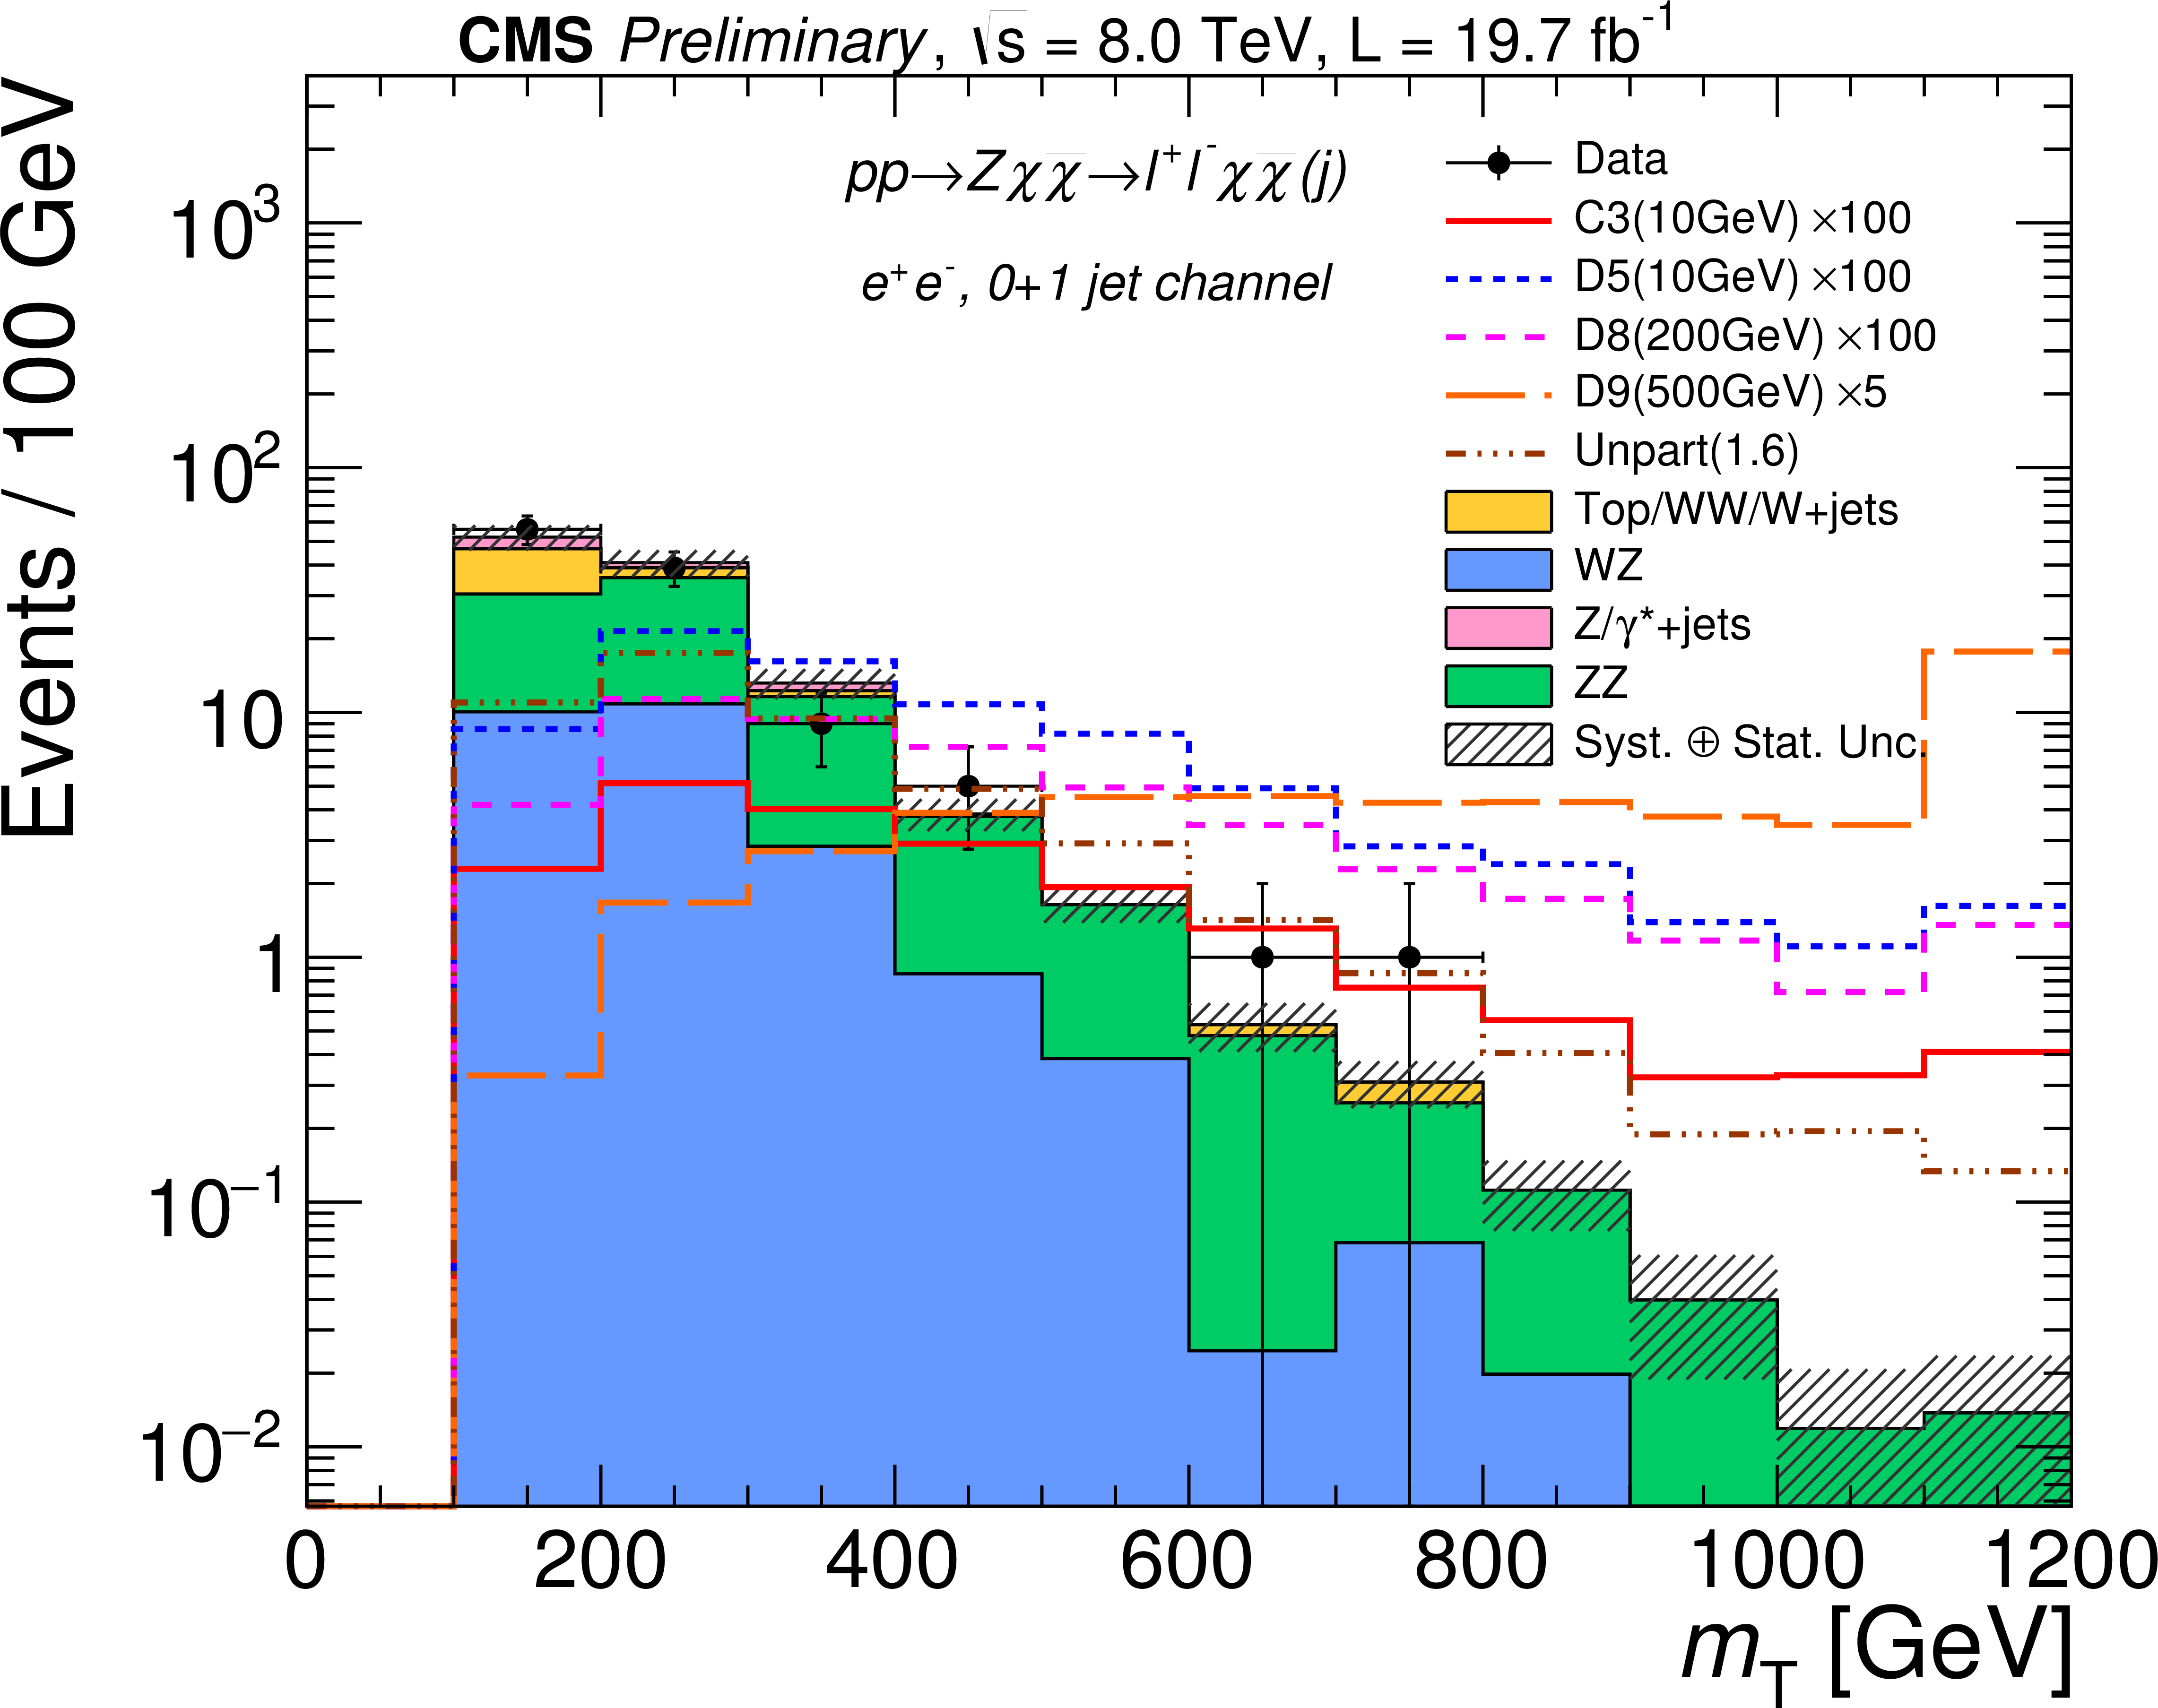
Figure 5-a:
Distributions of transverse mass with log scale in $y$-axis for the final selection in $ {\mathrm {Z}} \to {\mathrm {ee}} $ (a) and $\mu \mu $ (b) channel. Scaled signals with different mass points are superimposed separately. The total statistical and systematic uncertainty in the total background is shown as a hatched region. The overflow events are stacked in the last bin. |

png ; pdf |
Figure 5-b:
Distributions of transverse mass with log scale in $y$-axis for the final selection in $ {\mathrm {Z}} \to {\mathrm {ee}} $ (a) and $\mu \mu $ (b) channel. Scaled signals with different mass points are superimposed separately. The total statistical and systematic uncertainty in the total background is shown as a hatched region. The overflow events are stacked in the last bin. |
png ; pdf |
Figure 6-a:
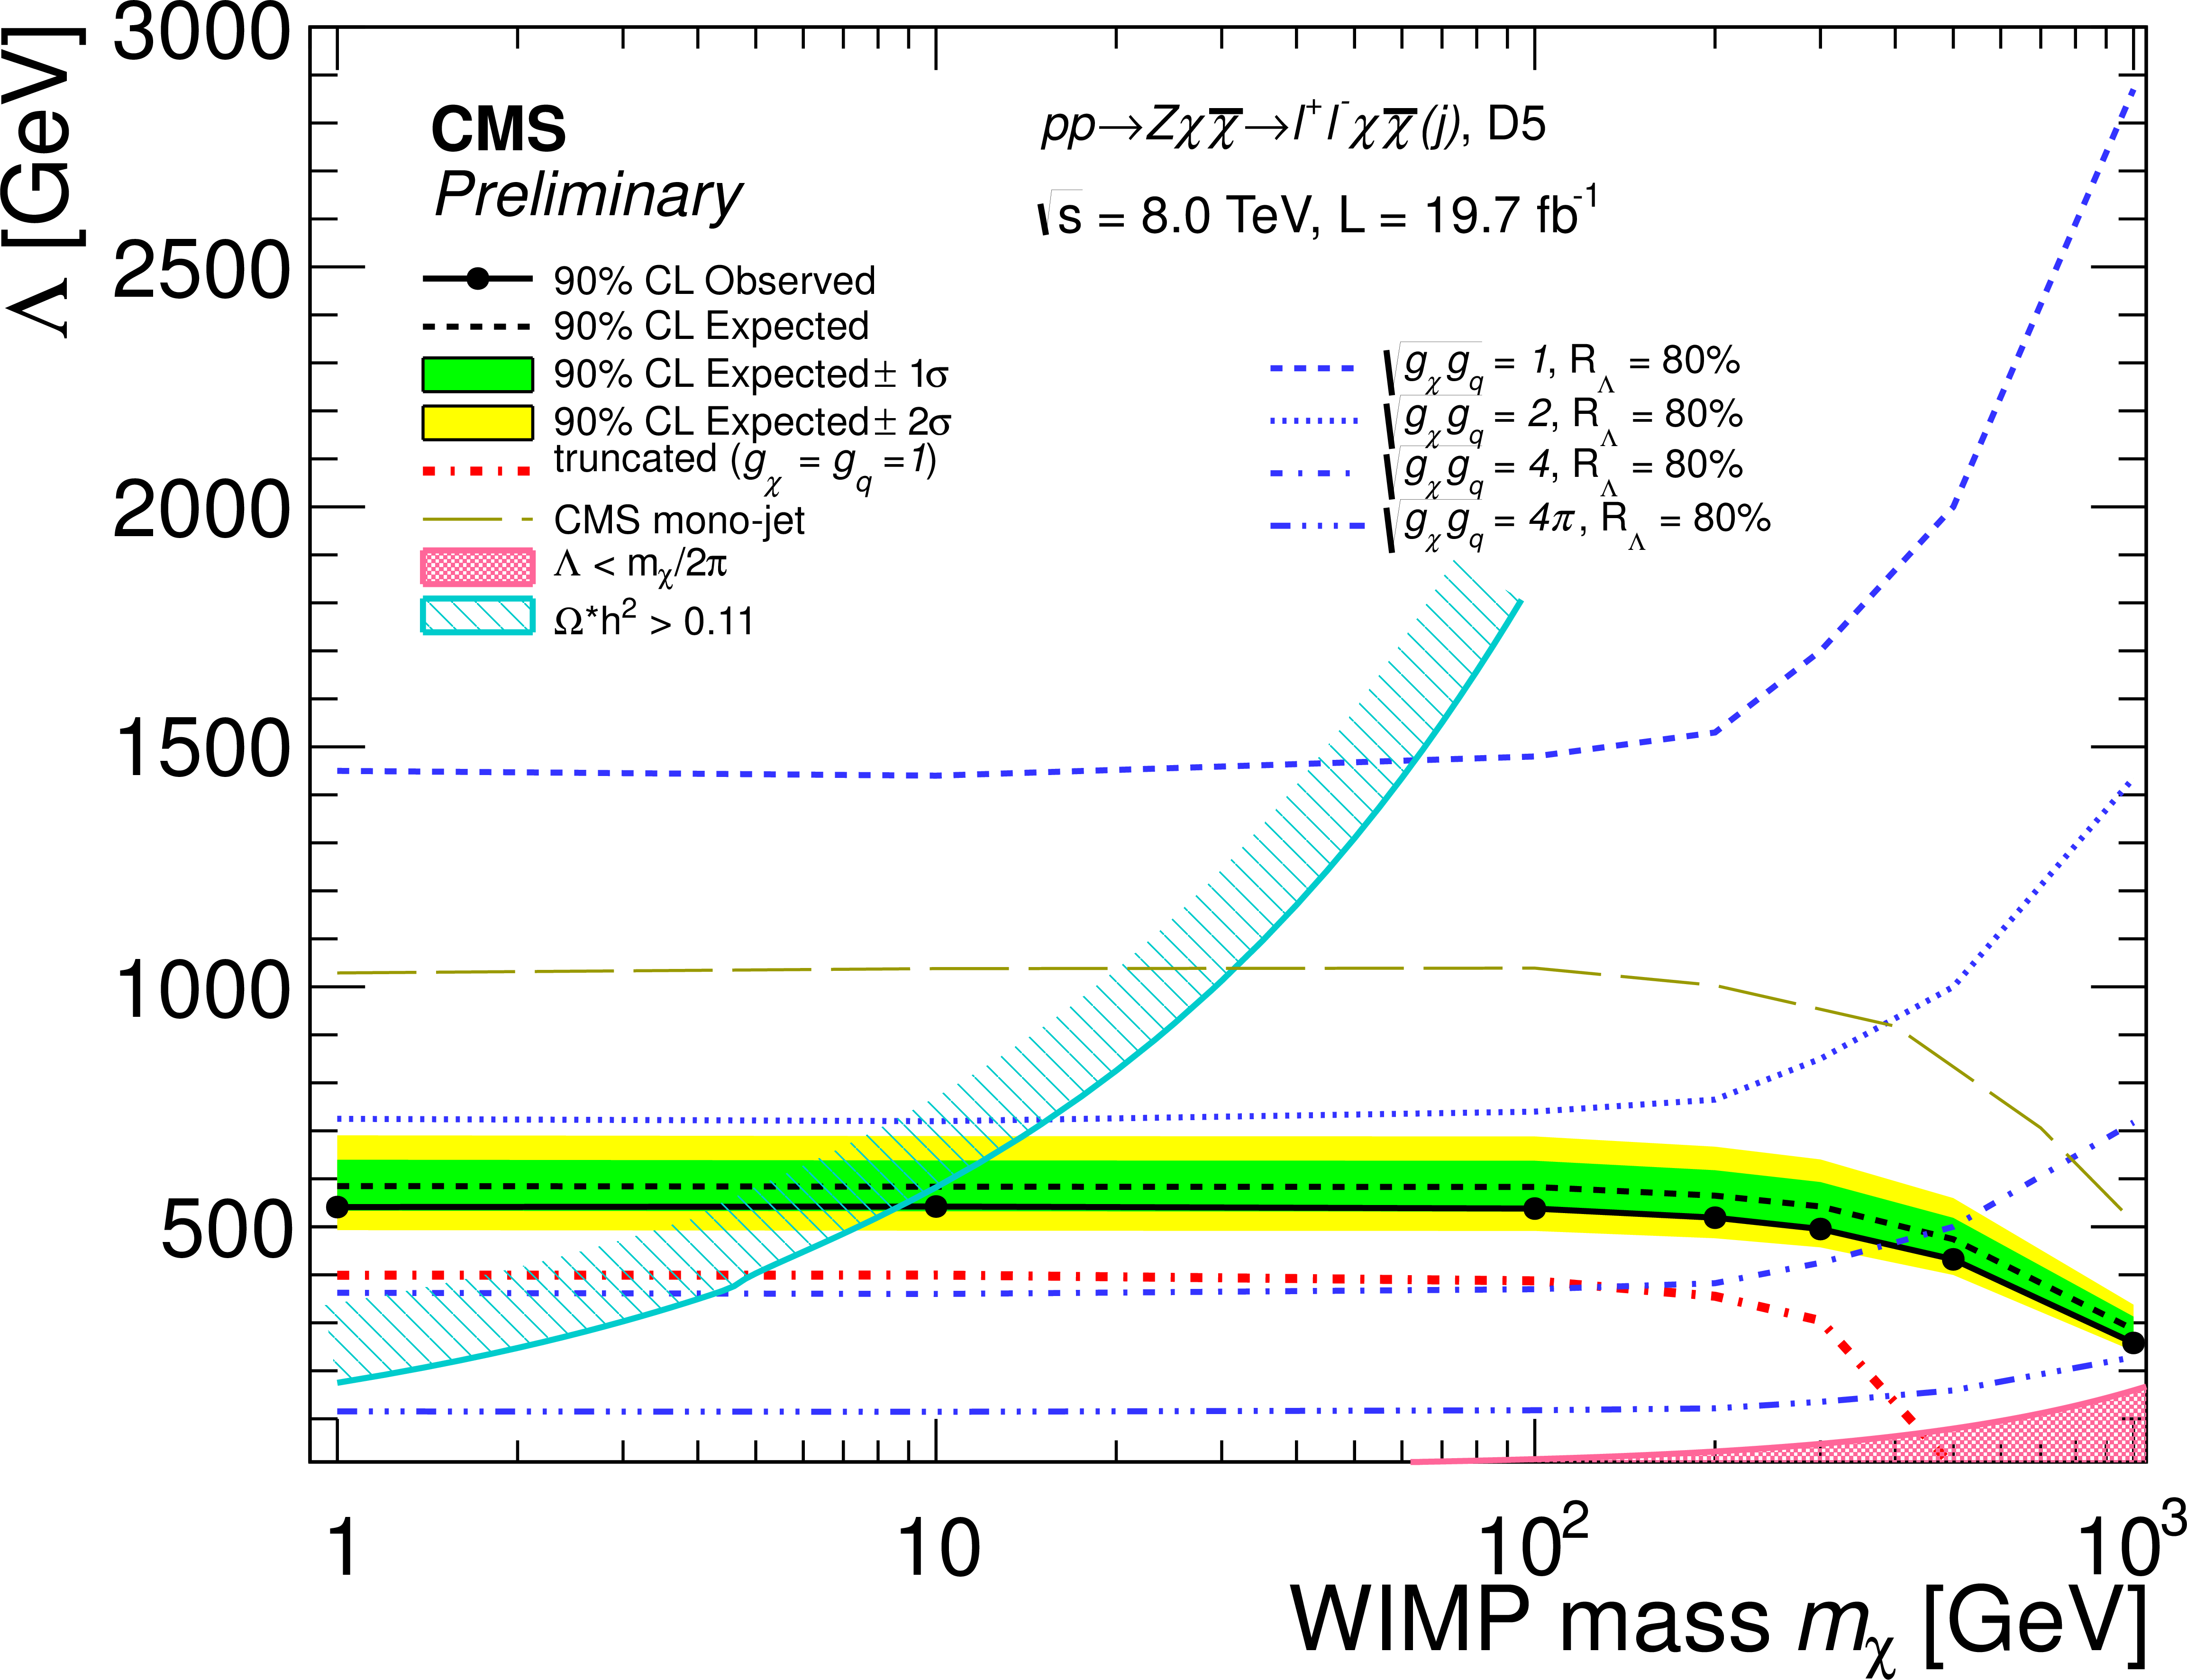
Expected and observed 90% CL lower limits on $\Lambda $ as a function of DM particle mass $m_{\chi }$ for operator D5, D8, D9 and C3. CMS mono-jet results are plotted for comparison. The cyan line calculated by MadDM indicates the relic density of cold DM: $\Omega h^2=0.11$ measured by WMAP. A pink shaded area is shown in each plot to indicate the lower bound $\Lambda > m_{\chi }/2\pi $ on the validity of the effective field theory on DM model. The blue dashed lines show qualified limits with $R_{\Lambda }= 80%$ for different couplings $\sqrt {g_qg_\chi }=1,2,4$ and $4\pi $. Truncated limits with $\sqrt {g_qg_\chi }=1$ are also presented. |

png ; pdf |
Figure 6-b:
Expected and observed 90% CL lower limits on $\Lambda $ as a function of DM particle mass $m_{\chi }$ for operator D5, D8, D9 and C3. CMS mono-jet results are plotted for comparison. The cyan line calculated by MadDM indicates the relic density of cold DM: $\Omega h^2=0.11$ measured by WMAP. A pink shaded area is shown in each plot to indicate the lower bound $\Lambda > m_{\chi }/2\pi $ on the validity of the effective field theory on DM model. The blue dashed lines show qualified limits with $R_{\Lambda }= 80%$ for different couplings $\sqrt {g_qg_\chi }=1,2,4$ and $4\pi $. Truncated limits with $\sqrt {g_qg_\chi }=1$ are also presented. |

png ; pdf |
Figure 6-c:
Expected and observed 90% CL lower limits on $\Lambda $ as a function of DM particle mass $m_{\chi }$ for operator D5, D8, D9 and C3. CMS mono-jet results are plotted for comparison. The cyan line calculated by MadDM indicates the relic density of cold DM: $\Omega h^2=0.11$ measured by WMAP. A pink shaded area is shown in each plot to indicate the lower bound $\Lambda > m_{\chi }/2\pi $ on the validity of the effective field theory on DM model. The blue dashed lines show qualified limits with $R_{\Lambda }= 80%$ for different couplings $\sqrt {g_qg_\chi }=1,2,4$ and $4\pi $. Truncated limits with $\sqrt {g_qg_\chi }=1$ are also presented. |

png ; pdf |
Figure 6-d:
Expected and observed 90% CL lower limits on $\Lambda $ as a function of DM particle mass $m_{\chi }$ for operator D5, D8, D9 and C3. CMS mono-jet results are plotted for comparison. The cyan line calculated by MadDM indicates the relic density of cold DM: $\Omega h^2=0.11$ measured by WMAP. A pink shaded area is shown in each plot to indicate the lower bound $\Lambda > m_{\chi }/2\pi $ on the validity of the effective field theory on DM model. The blue dashed lines show qualified limits with $R_{\Lambda }= 80%$ for different couplings $\sqrt {g_qg_\chi }=1,2,4$ and $4\pi $. Truncated limits with $\sqrt {g_qg_\chi }=1$ are also presented. |

png ; pdf |
Figure 7-a:
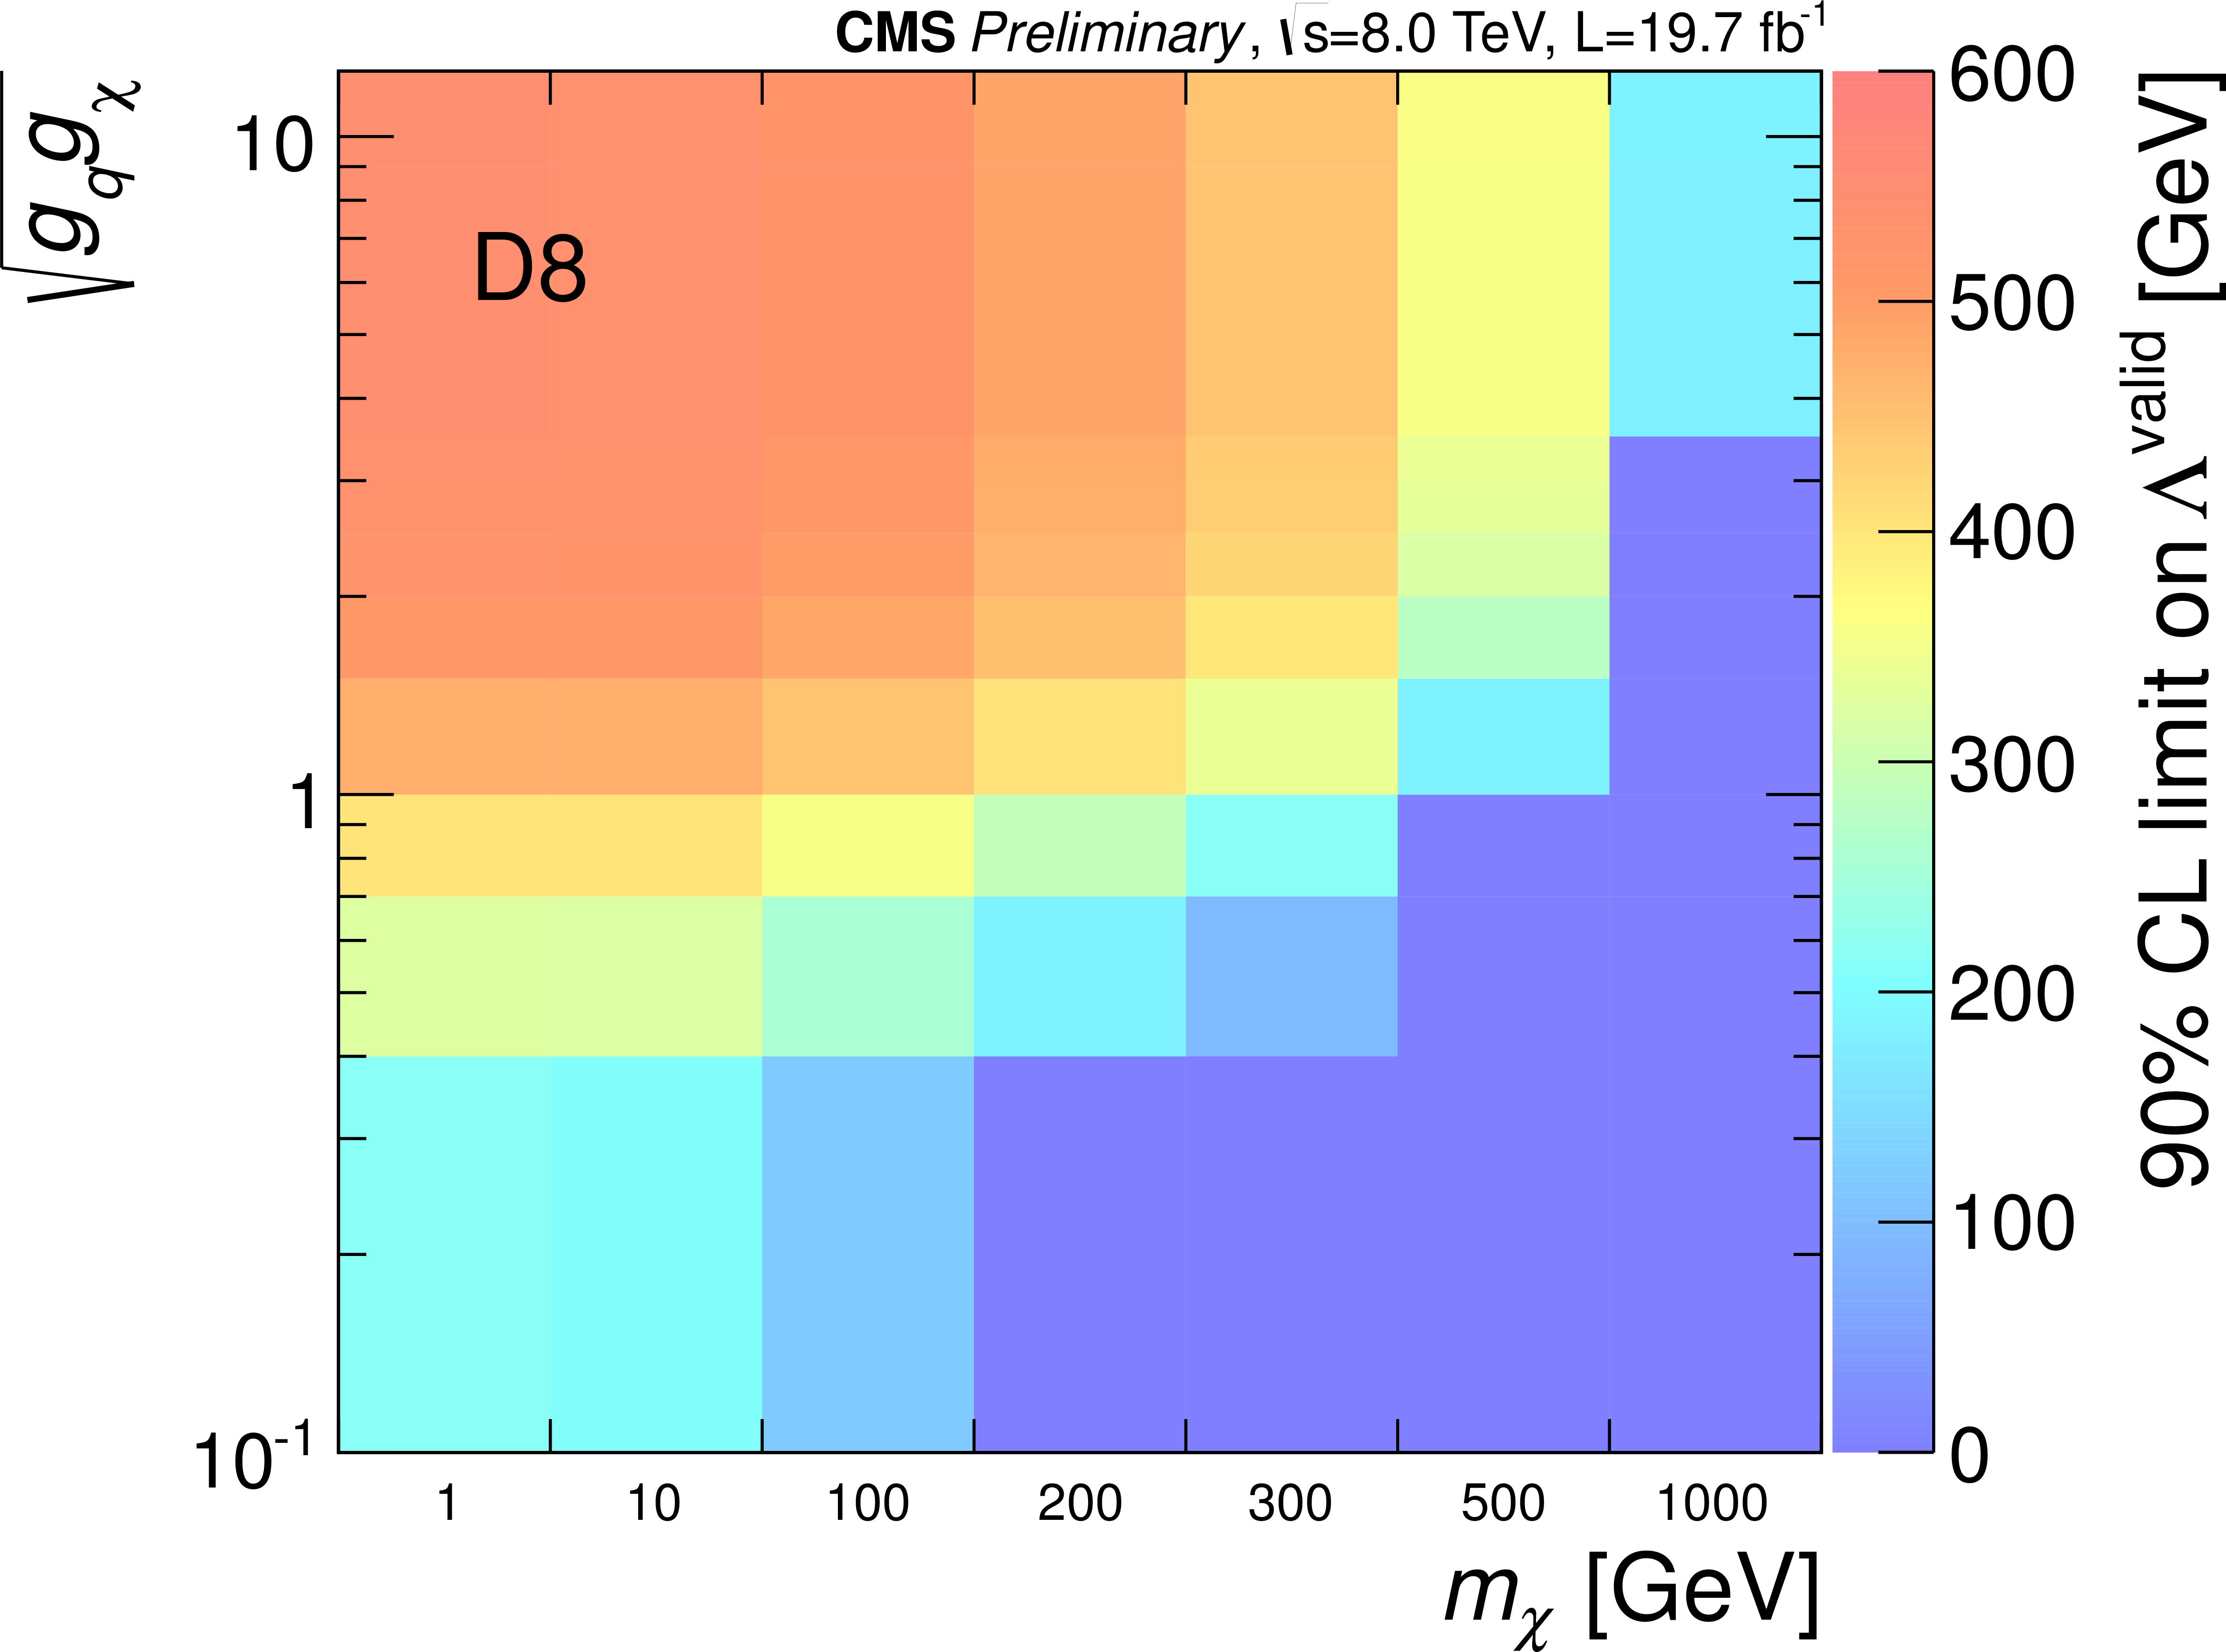
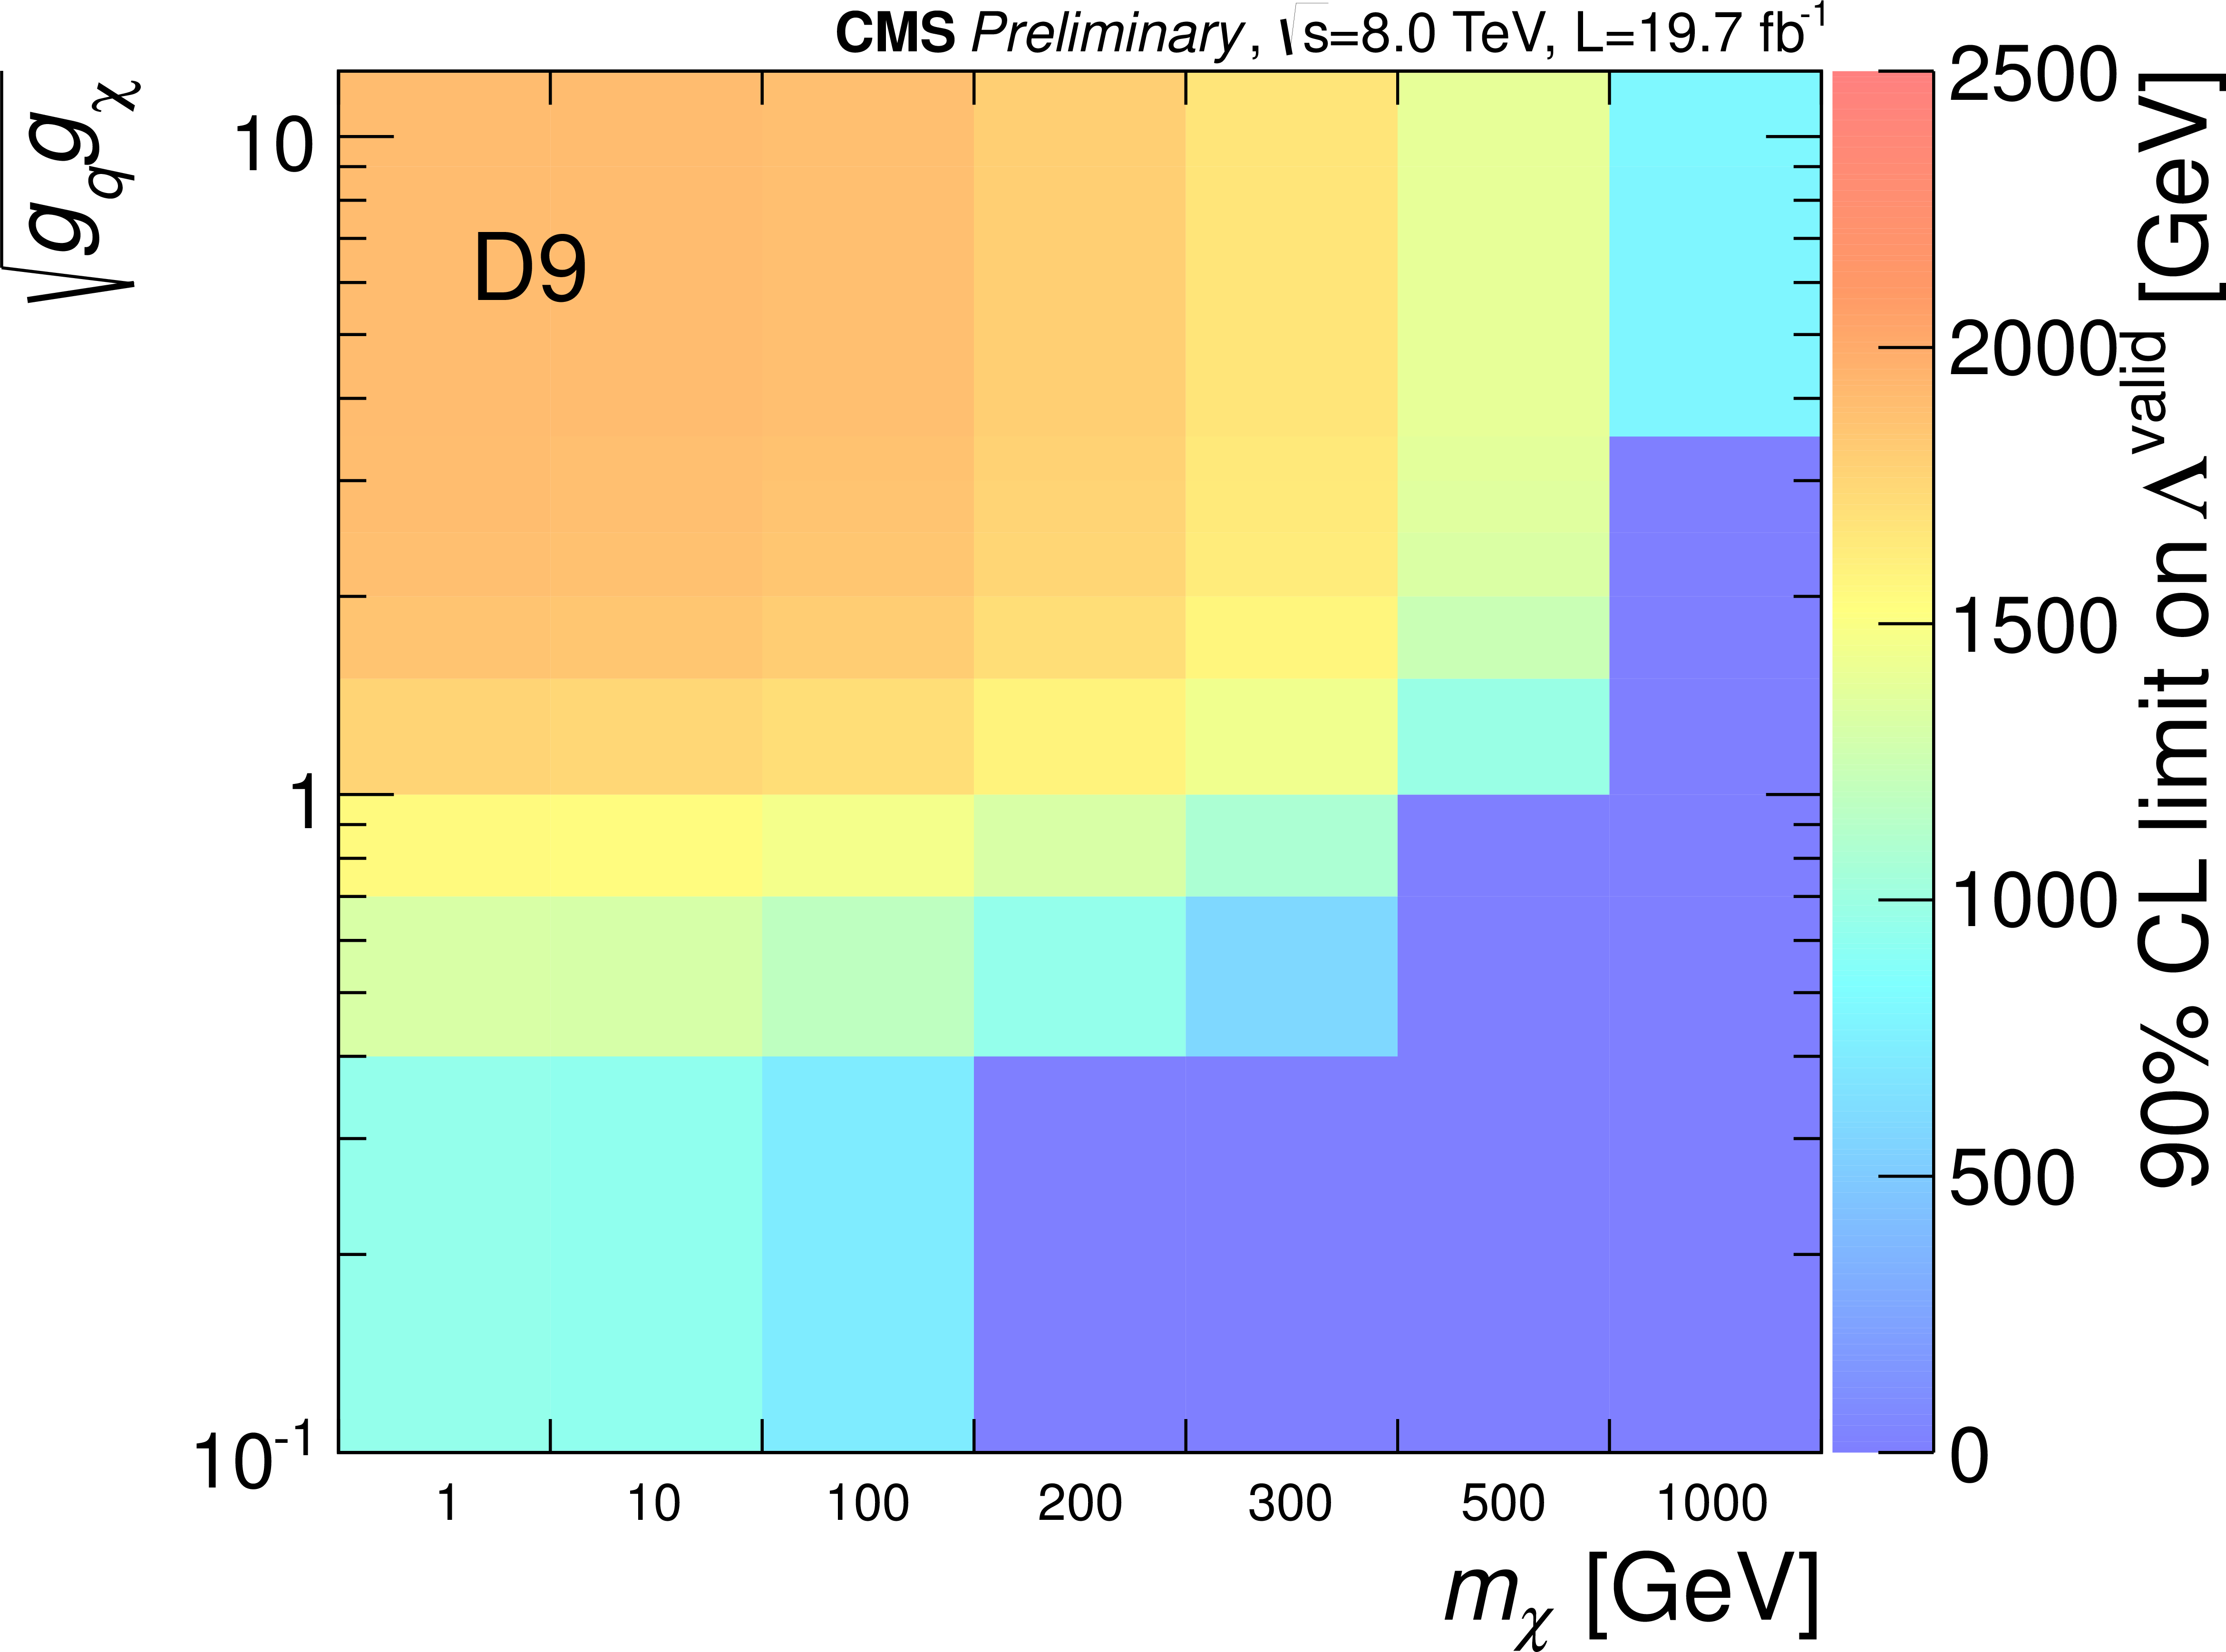
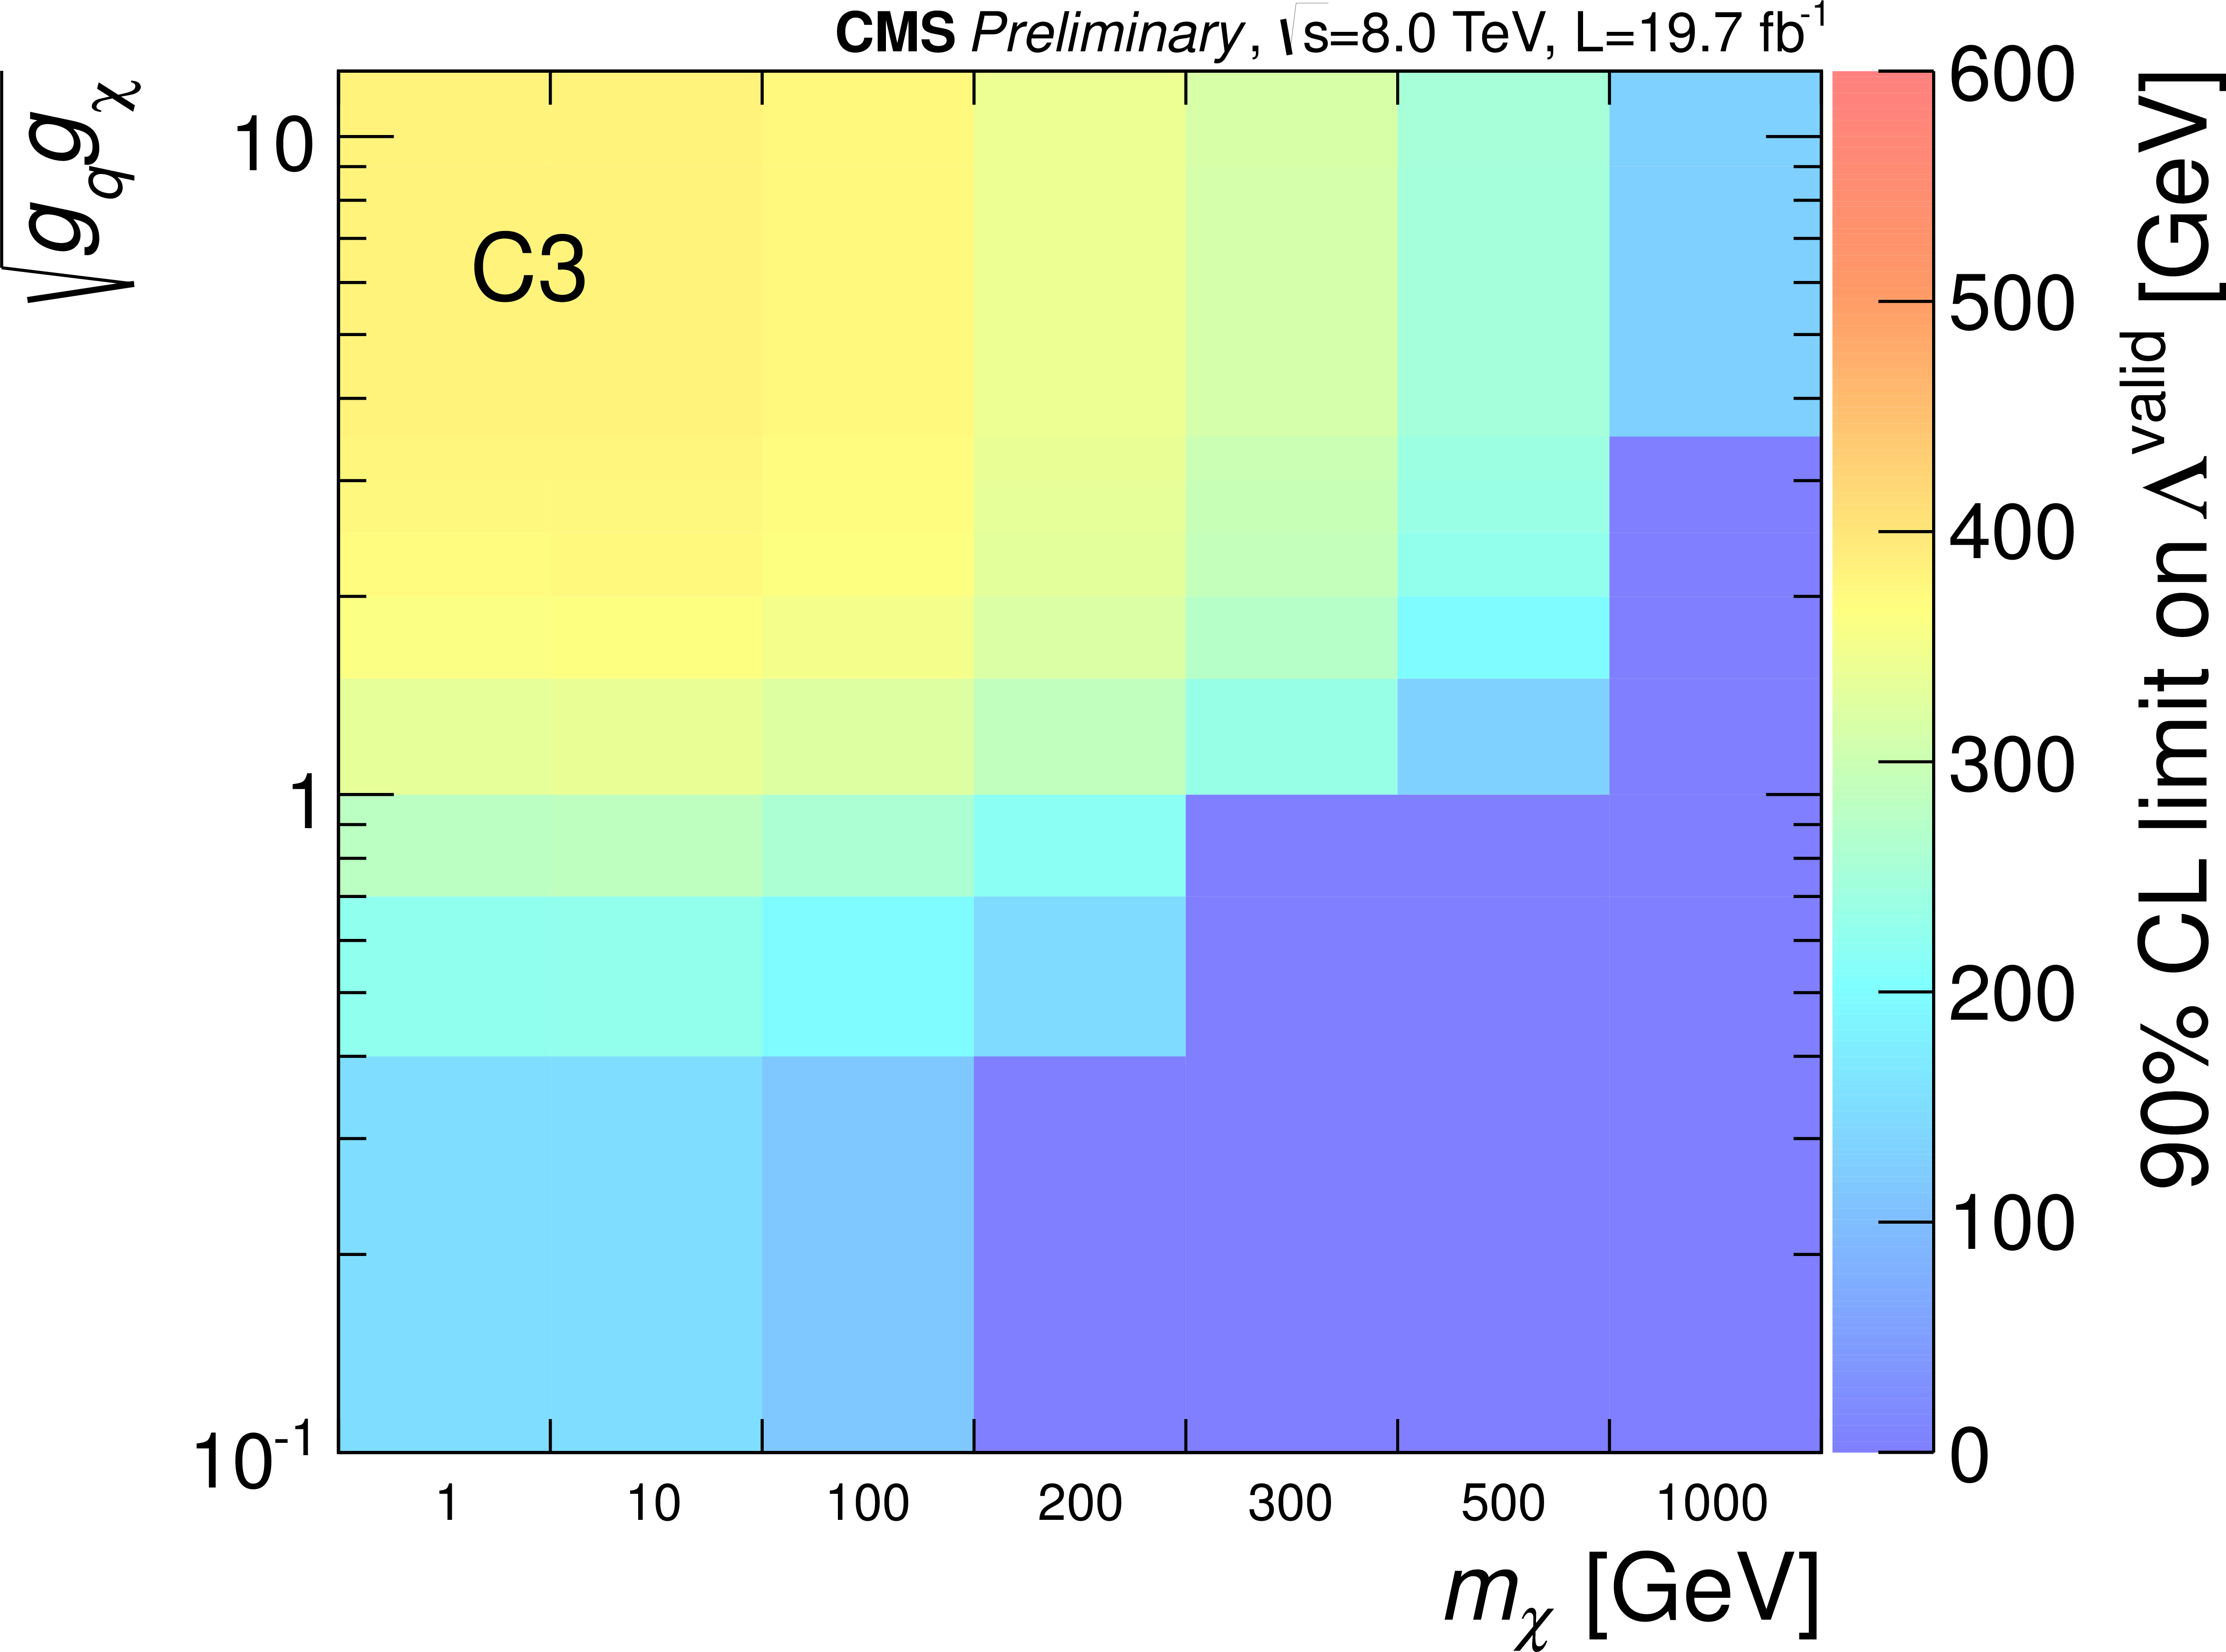
Observed 90% CL lower limits on the truncated cut-off scale $\Lambda $ as a function of DM mass $m_{\chi }$ and coupling $\sqrt {g_qg_\chi }$ for operators D5, D8, D9 and C3. |
png ; pdf |
Figure 7-b:
Observed 90% CL lower limits on the truncated cut-off scale $\Lambda $ as a function of DM mass $m_{\chi }$ and coupling $\sqrt {g_qg_\chi }$ for operators D5, D8, D9 and C3. |
png ; pdf |
Figure 7-c:
Observed 90% CL lower limits on the truncated cut-off scale $\Lambda $ as a function of DM mass $m_{\chi }$ and coupling $\sqrt {g_qg_\chi }$ for operators D5, D8, D9 and C3. |
png ; pdf |
Figure 7-d:
Observed 90% CL lower limits on the truncated cut-off scale $\Lambda $ as a function of DM mass $m_{\chi }$ and coupling $\sqrt {g_qg_\chi }$ for operators D5, D8, D9 and C3. |

png ; pdf |
Figure 8-a:
The 90%CL upper limits on the DM-nucleon cross section as a function of the DM particle mass. a: spin-dependent limits for axial-vector (D8) and tensor (D9) coupling of Dirac fermion DM candidates, together with direct search experimental results from PICASSO\cite {Archambault:2012pm}, SIMPLE, COUPP and IceCube collaborations. b: spin-independent limits for vector coupling of complex scalar (C3) and Dirac fermion (D5) DM candidates,together with CDMS, SuperCDMS, LUX as well as Higgs-portal DM results For both spin-dependent and spin-independent scenarios, collider results from CMS mono-jet and mono-photon are also plotted for comparison. The truncated limits for D5, D8, D9 and C3 with $\sqrt {g_q g_\chi }=1$ are presented with dashed lines in same color of the untruncated ones. |

png ; pdf |
Figure 8-b:
The 90%CL upper limits on the DM-nucleon cross section as a function of the DM particle mass. a: spin-dependent limits for axial-vector (D8) and tensor (D9) coupling of Dirac fermion DM candidates, together with direct search experimental results from PICASSO\cite {Archambault:2012pm}, SIMPLE, COUPP and IceCube collaborations. b: spin-independent limits for vector coupling of complex scalar (C3) and Dirac fermion (D5) DM candidates,together with CDMS, SuperCDMS, LUX as well as Higgs-portal DM results For both spin-dependent and spin-independent scenarios, collider results from CMS mono-jet and mono-photon are also plotted for comparison. The truncated limits for D5, D8, D9 and C3 with $\sqrt {g_q g_\chi }=1$ are presented with dashed lines in same color of the untruncated ones. |
png ; pdf |
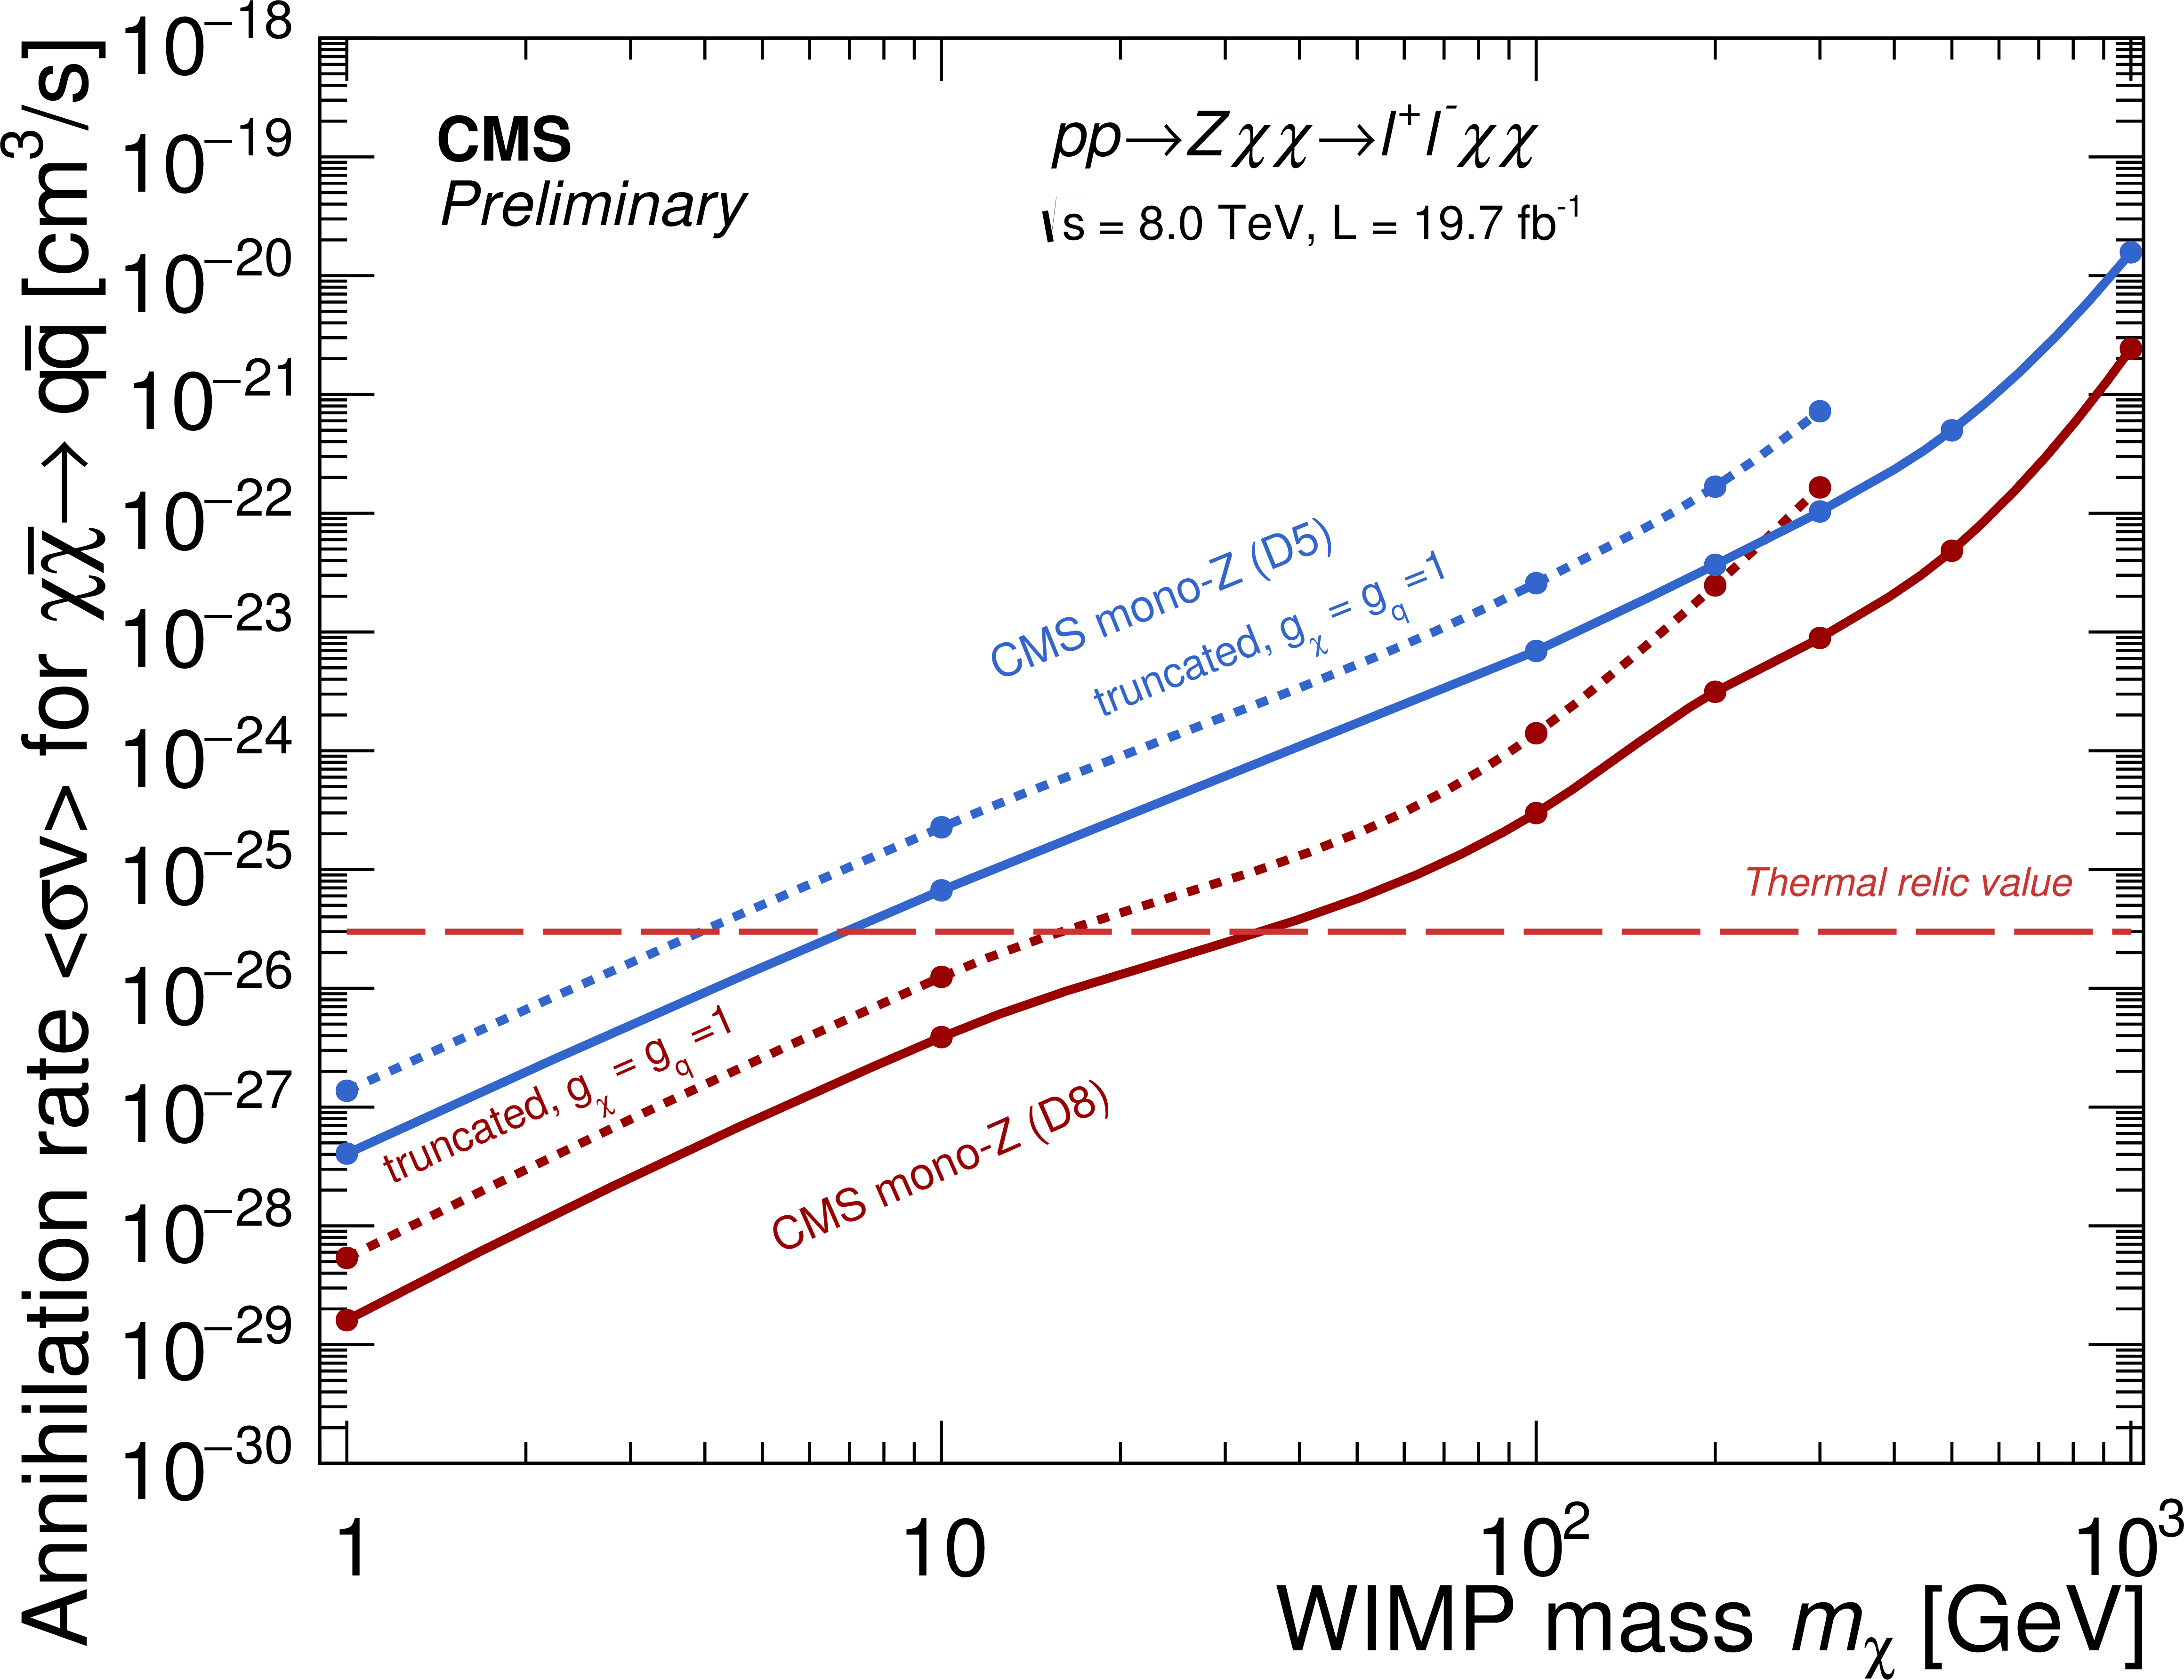
Figure 9:
The 90%CL upper limits on the DM annihilation rate $< \sigma v >$ as a function of the DM particle mass for vector (D5) and axial-vector (D8) couplings of Dirac fermion DM. A 100% branching fraction of DM annihilating to quarks is assumed. The value required for DM to make up the relic abundance is labeled ``Thermal relic value'' and shown as a red dashed line. The truncated limits for D5 and D8 with $\sqrt {g_q g_\chi }=1$ are presented with dashed lines in same color of the untruncated ones. |

png ; pdf |
Figure 10-a:
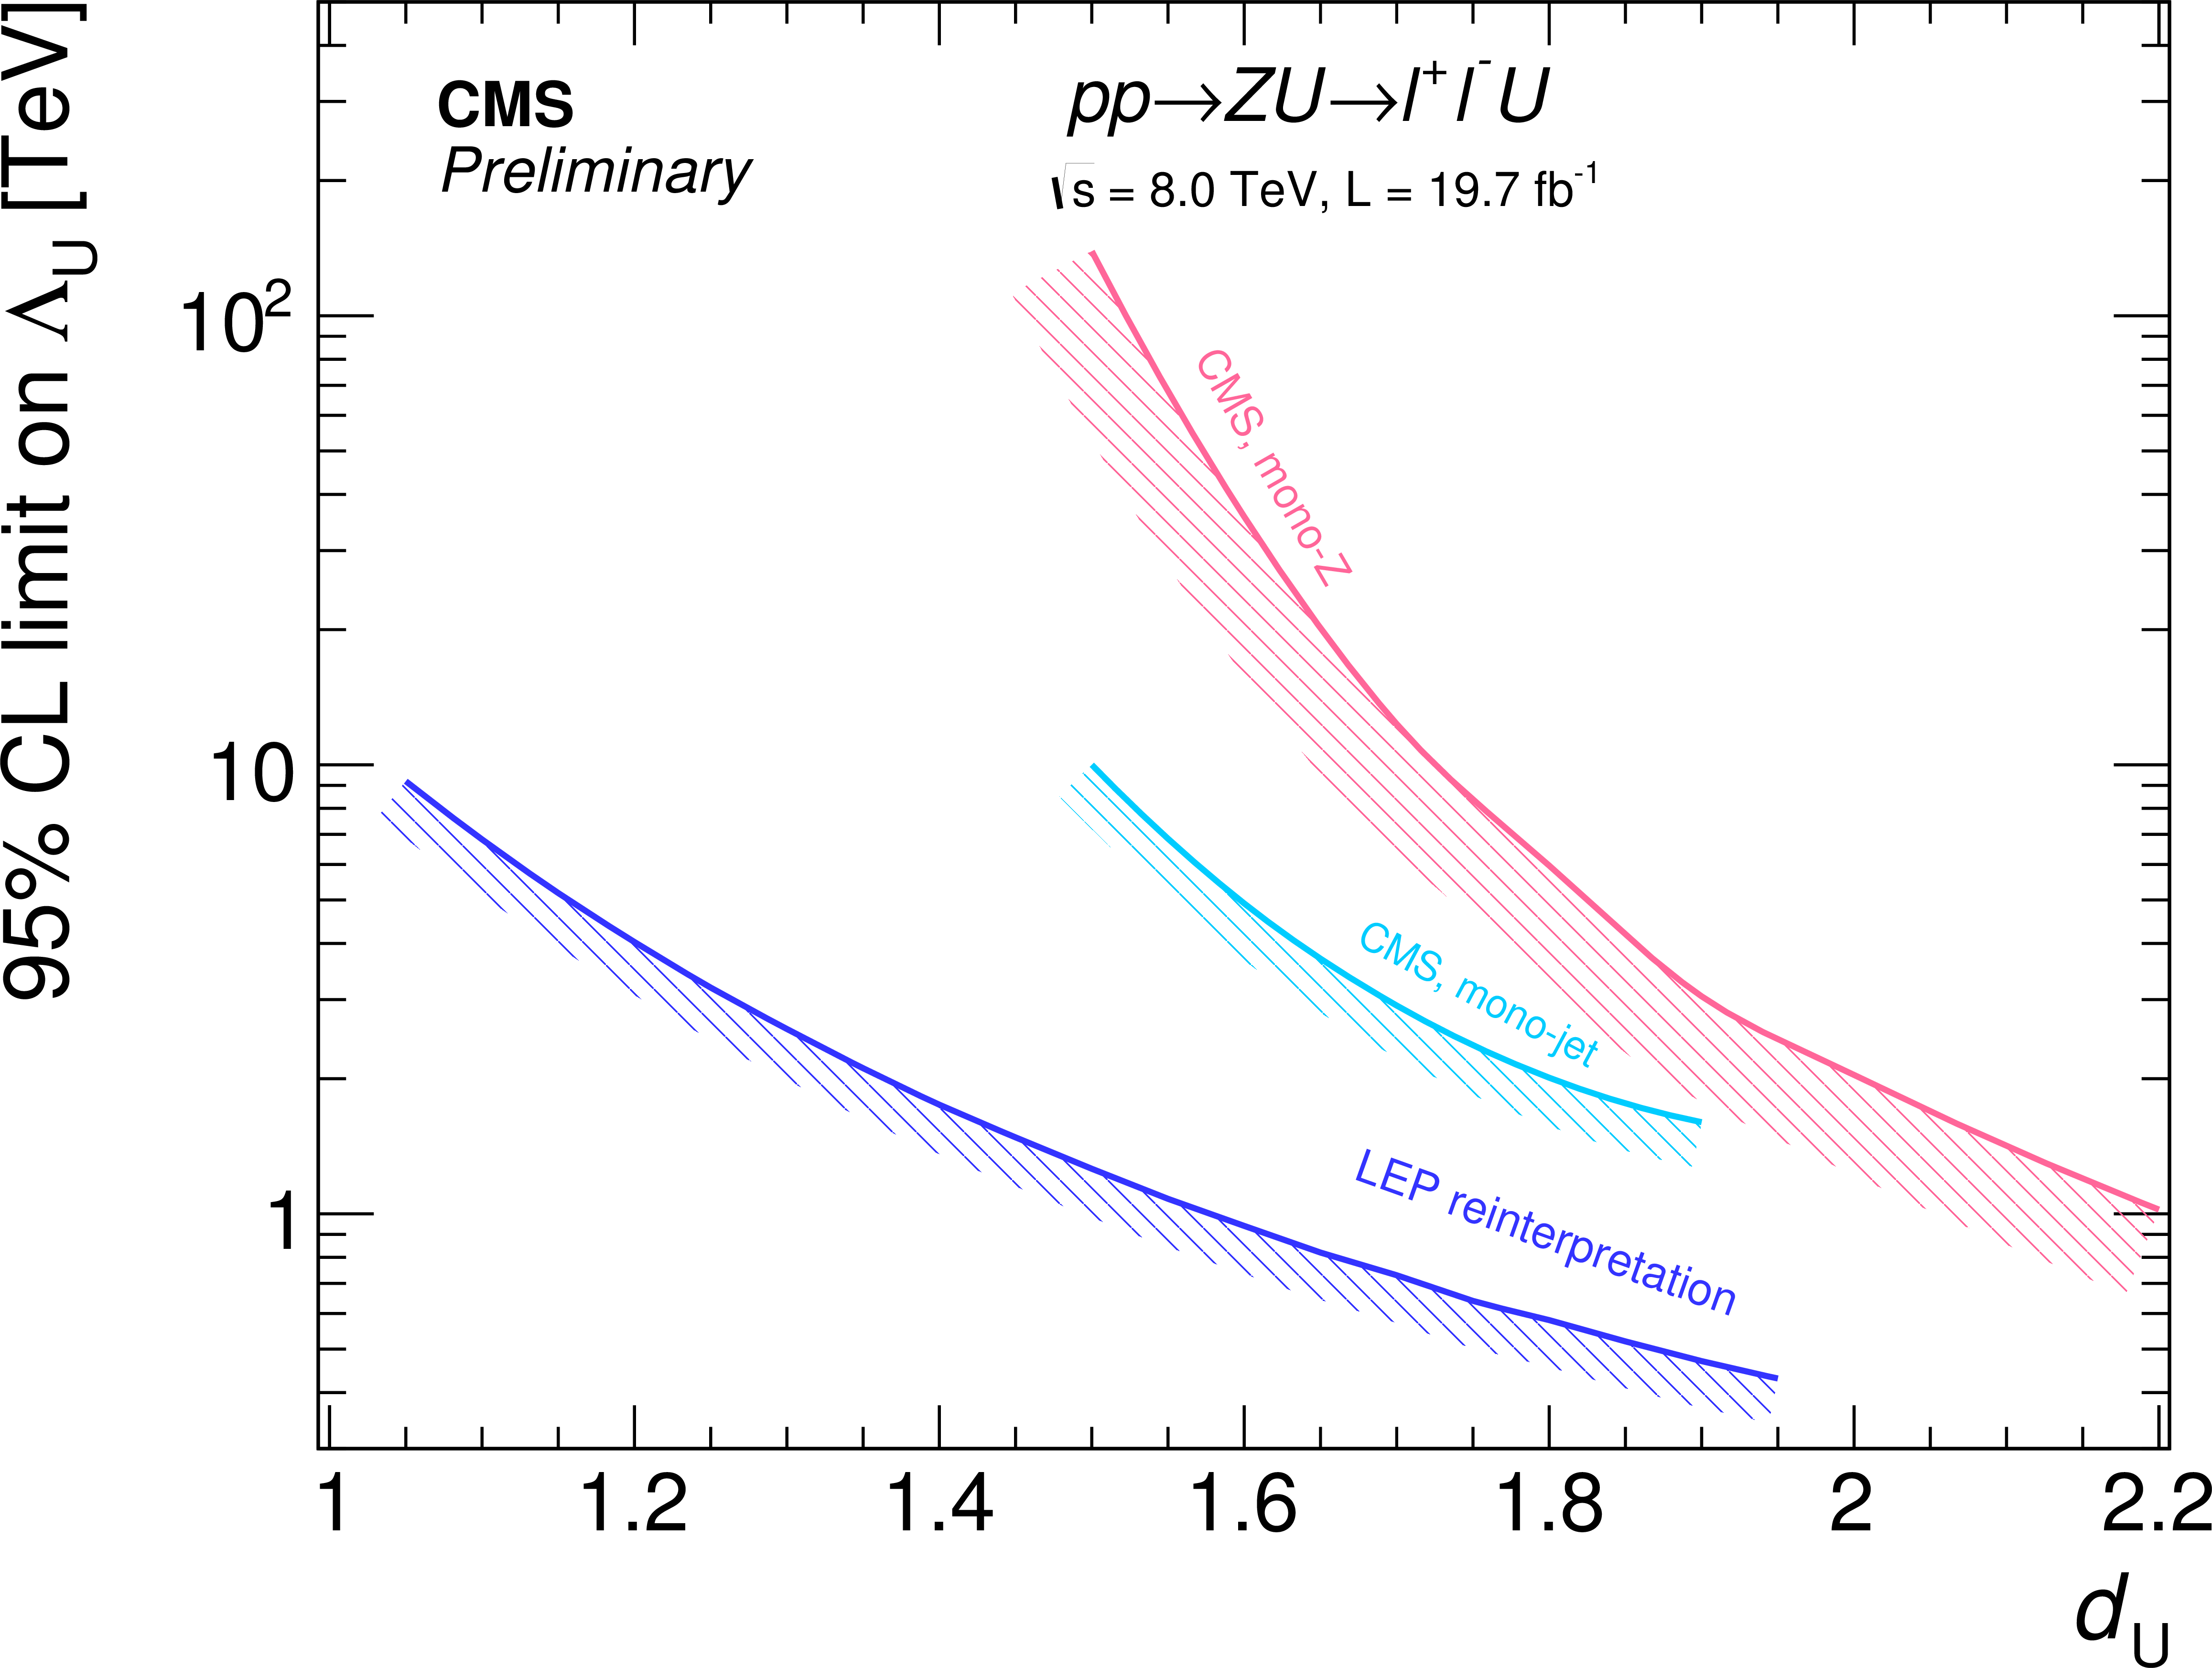
(a) 95% CL upper limits on the coupling $\lambda $ between unparticle and SM fields with fixed effective cut-off scale $\Lambda _{\mathcal U}=15$ TeV. (b) 95% CL lower limits on unparticle effective cut-off scale $\Lambda _{\mathcal U}$ with a fixed coupling $\lambda =1$, the results from CMS mono-jet and reinterpretation of LEP searches are also plotted for comparison. The excluded region is indicated by the shaded region. |
png ; pdf |
Figure 10-b:
(a) 95% CL upper limits on the coupling $\lambda $ between unparticle and SM fields with fixed effective cut-off scale $\Lambda _{\mathcal U}=15$ TeV. (b) 95% CL lower limits on unparticle effective cut-off scale $\Lambda _{\mathcal U}$ with a fixed coupling $\lambda =1$, the results from CMS mono-jet and reinterpretation of LEP searches are also plotted for comparison. The excluded region is indicated by the shaded region. |

png ; pdf |
Figure 11:
The model-independent expected and observed 95% CL upper limits on the visible cross section ($\sigma \times {A}\times \epsilon $) for BSM production of events as a function of missing transverse energy thresholds. |
|
|
Compact Muon Solenoid LHC, CERN |
|

|

|

|

|

|