

Compact Muon Solenoid
LHC, CERN
| CMS-PAS-EXO-12-053 | ||
| Search for heavy resonances in the H tagged dijet mass spectrum in pp collisions at 8 TeV | ||
| CMS Collaboration | ||
| August 2015 | ||
| Abstract: A search for heavy resonances decaying into a pair of 125 GeV Higgs bosons is performed in proton-proton collisions collected by the CMS experiment at the LHC at $\sqrt{s} = $ 8 TeV. The dataset corresponds to an integrated luminosity of 19.7 fb$^{-1}$. Only the decay of Higgs bosons into b quark pairs is considered. For resonance masses above 1 TeV, each Higgs boson is produced with large momentum, and the hadronization products of the pair of b quarks can be reconstructed as one massive jet. The signal is characterized as a peak in the dijet invariant mass distribution. The background from multijet events is suppressed by applying requirements on jet b quark content, mass, and substructure. No evidence for a signal is observed. An upper limit on the signal production cross section is derived as a function of the resonance mass. The results are interpreted as exclusion limits on radion excitations in models with warped extra dimensions. | ||
|
Links:
CDS record (PDF) ;
Public twiki page ;
CADI line (restricted) ; Figures are also available from the CDS record. These preliminary results are superseded in this paper, EPJC 76 (2016) 371. |
||
| Figures | |

png ; pdf |
Figure 1-a:
Distribution of $m_{j}^p$ (a) and $\tau _{21}$ (b) for signal and QCD multijet simulated events, and for data. The signal and multijet distributions have been scaled to match the data event yield. |

png ; pdf |
Figure 1-b:
Distribution of $m_{j}^p$ (a) and $\tau _{21}$ (b) for signal and QCD multijet simulated events, and for data. The signal and multijet distributions have been scaled to match the data event yield. |
png ; pdf |
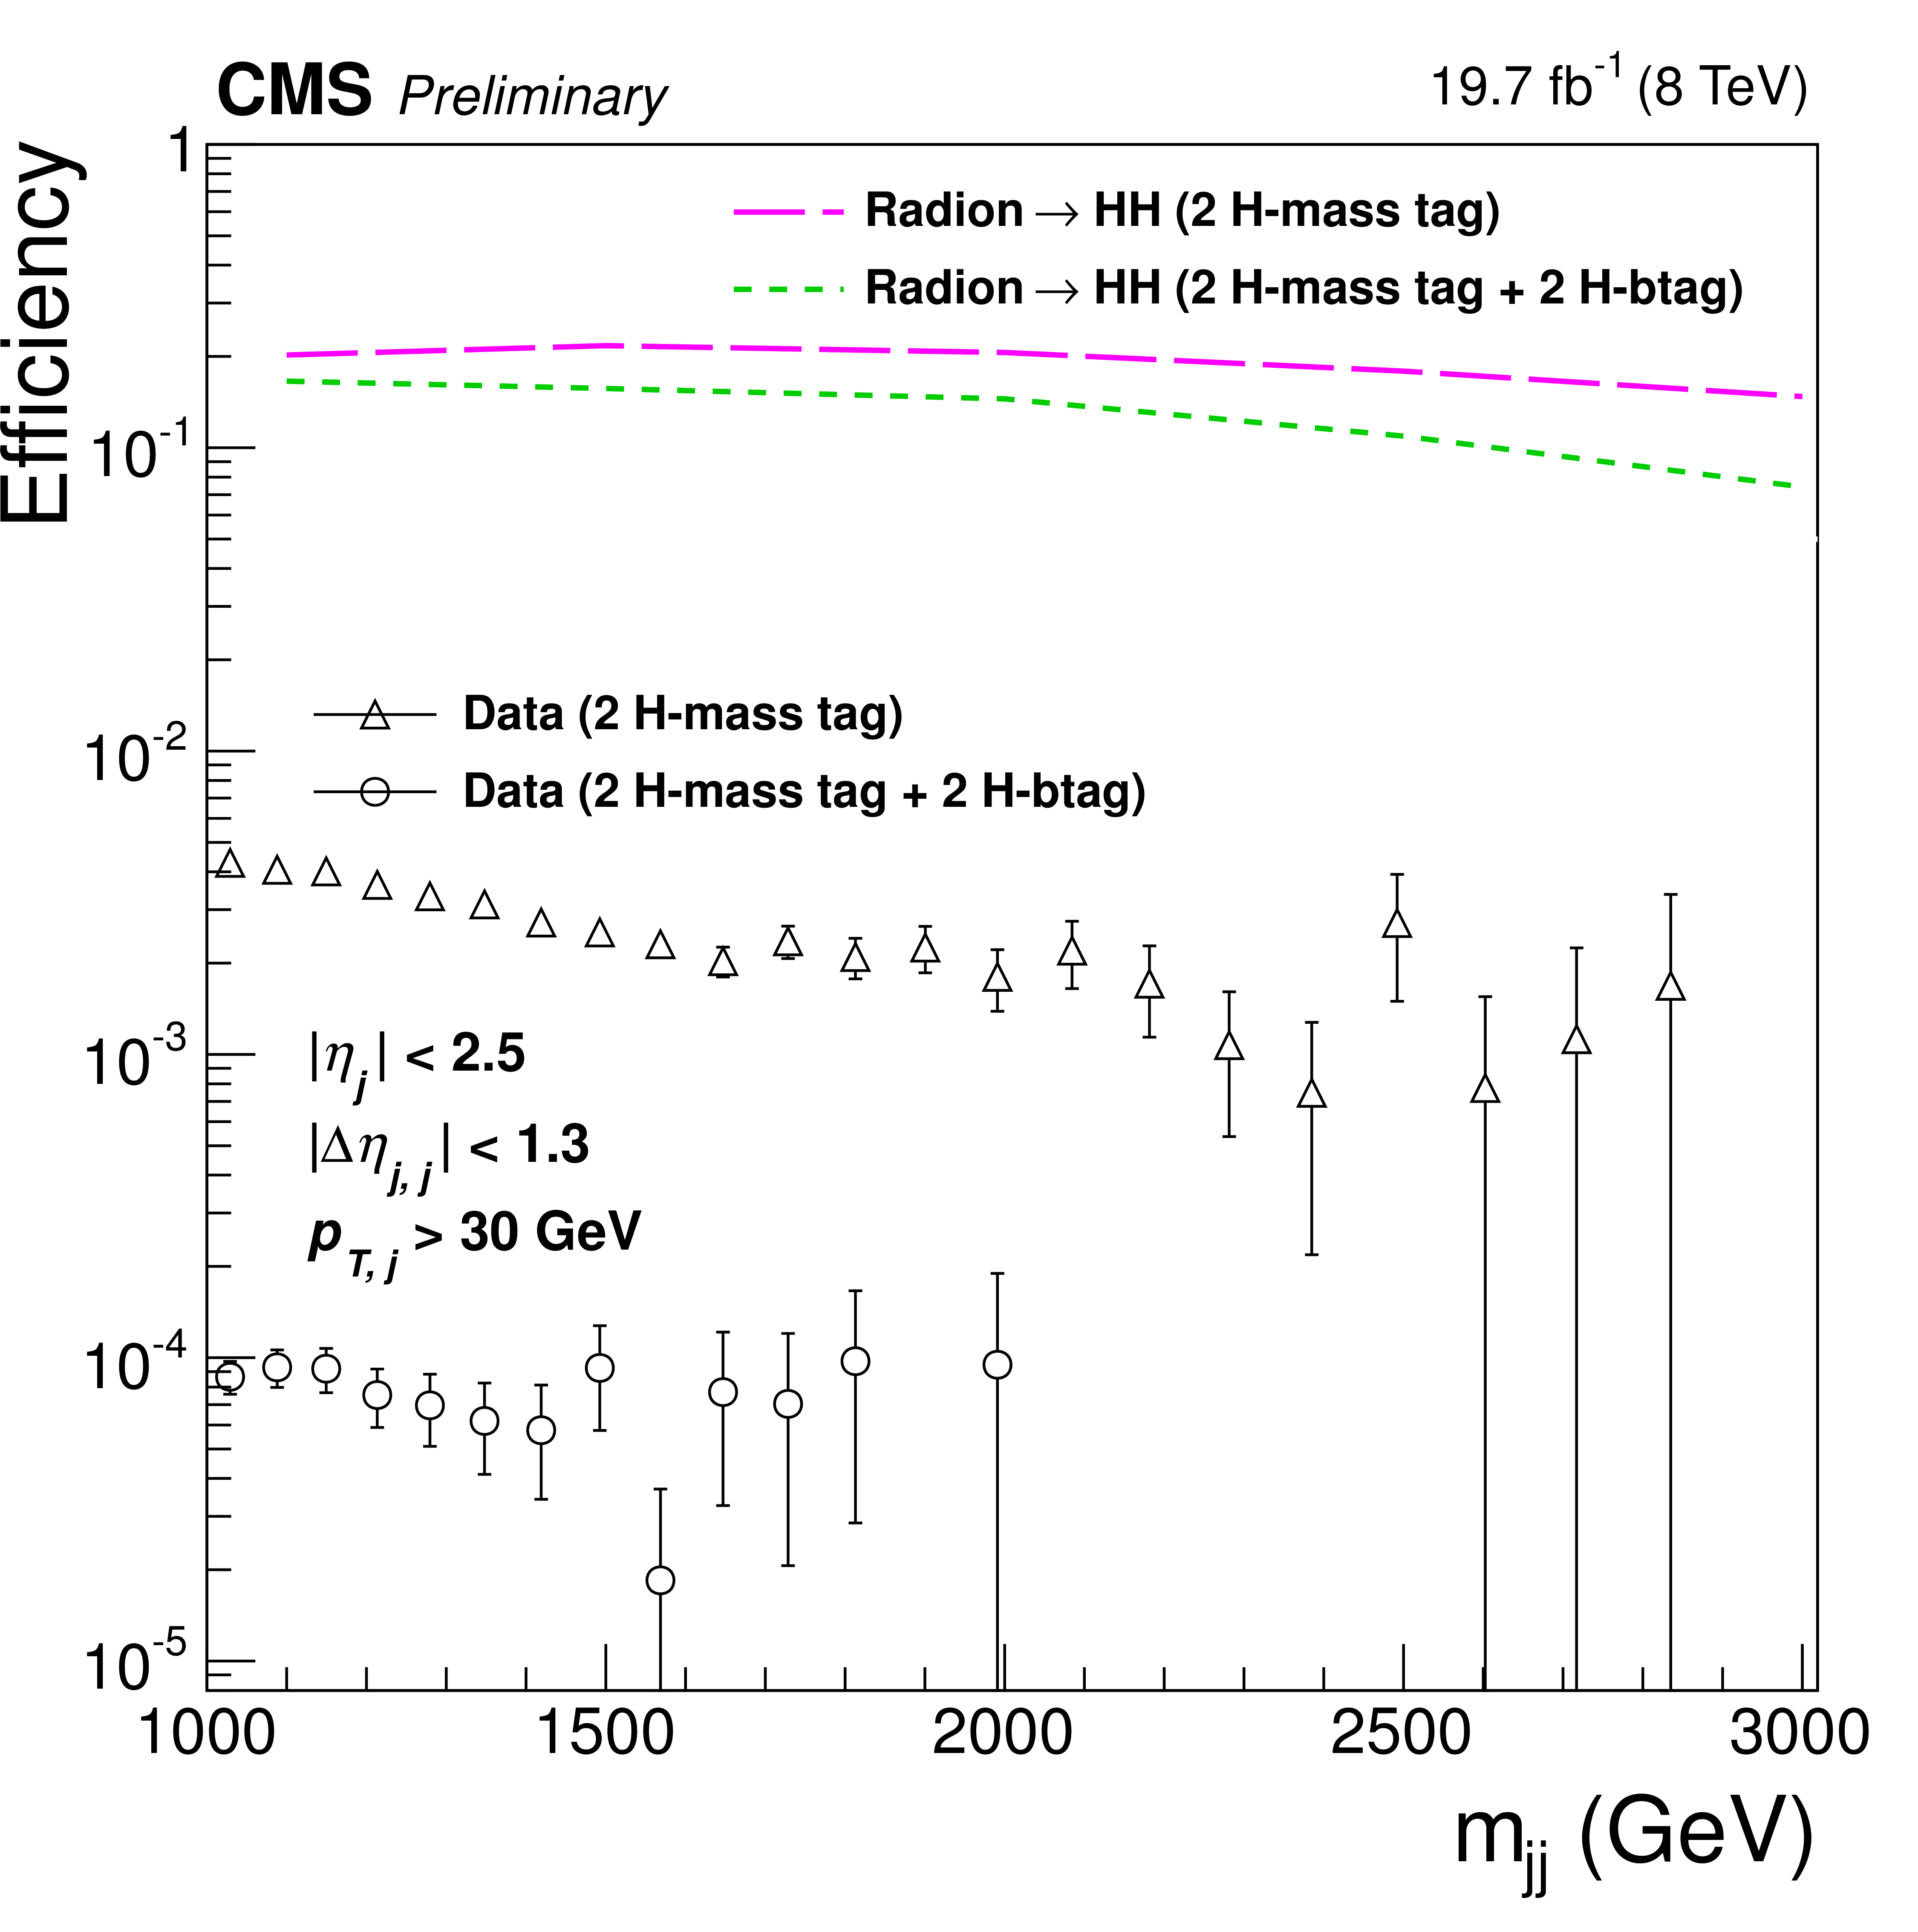
Figure 2:
The efficiency of combined H mass tagging and H b tagging for Data and signal. Events in both numerator and denominator are required to be in the fiducial region ($|\eta | <$ 2.5, $p_{T} >$ 30 GeV for both jets and $|\Delta \eta _{\rm jj}|<$ 1.3). |
png ; pdf |
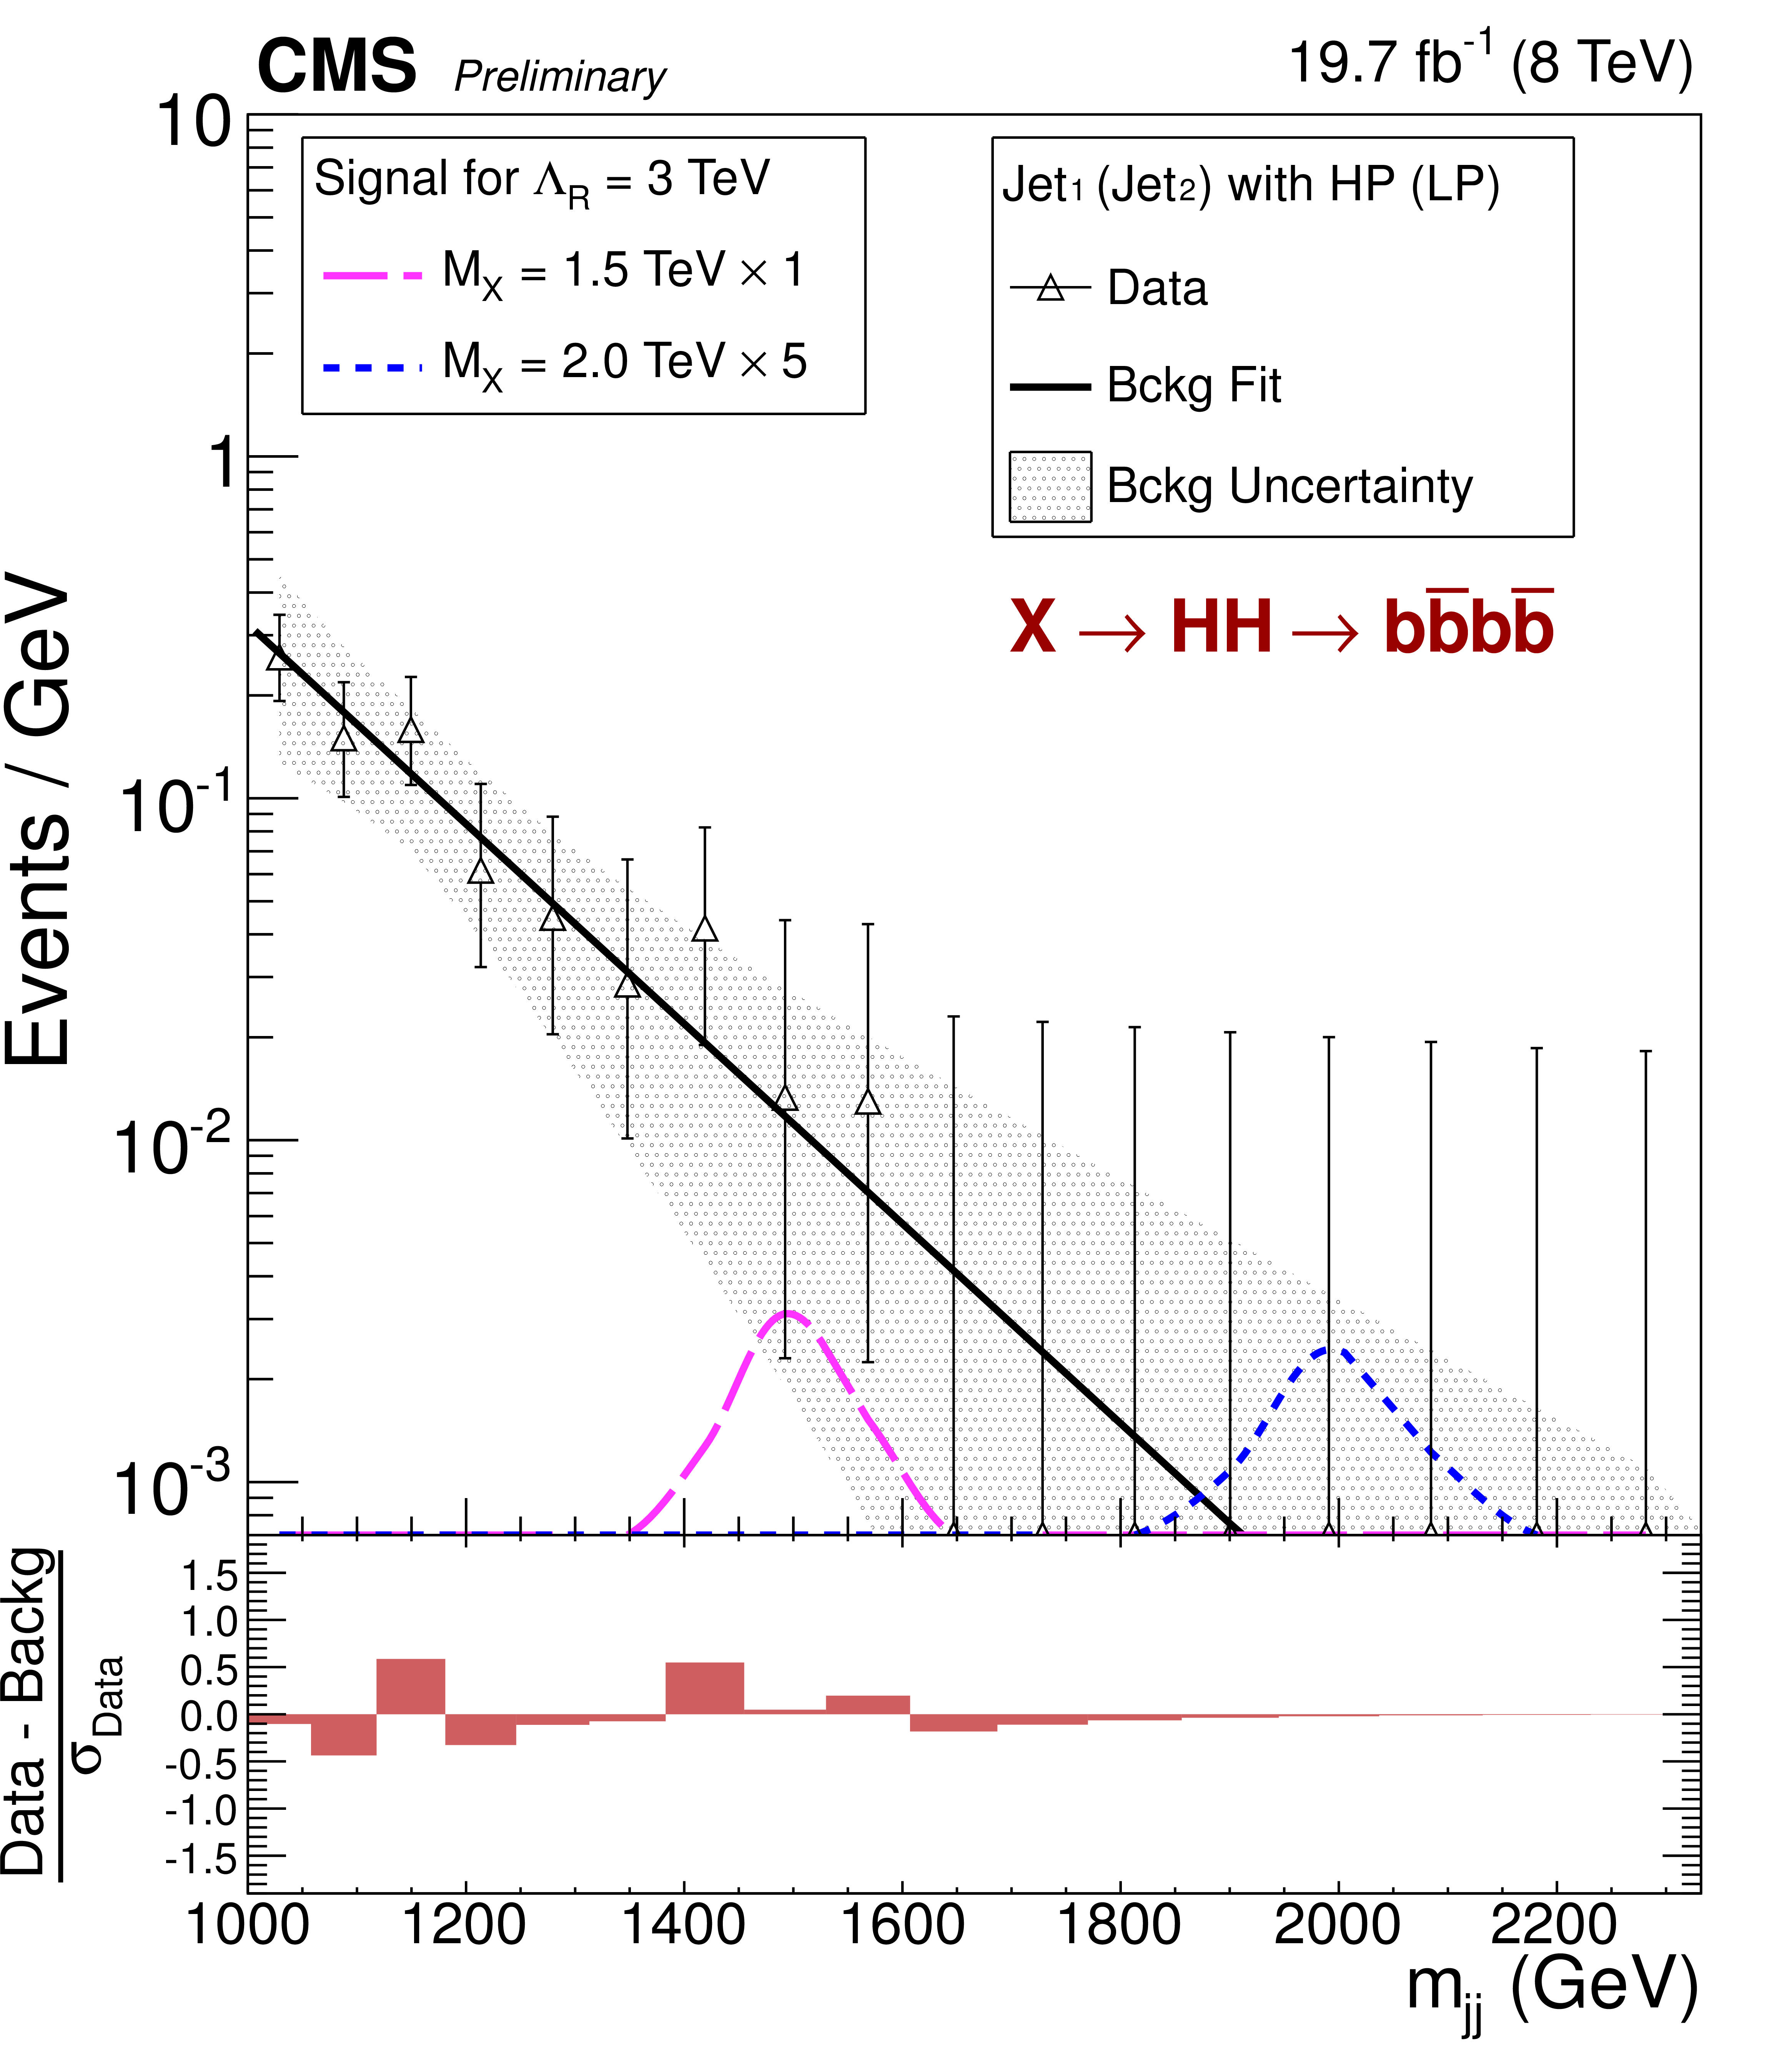
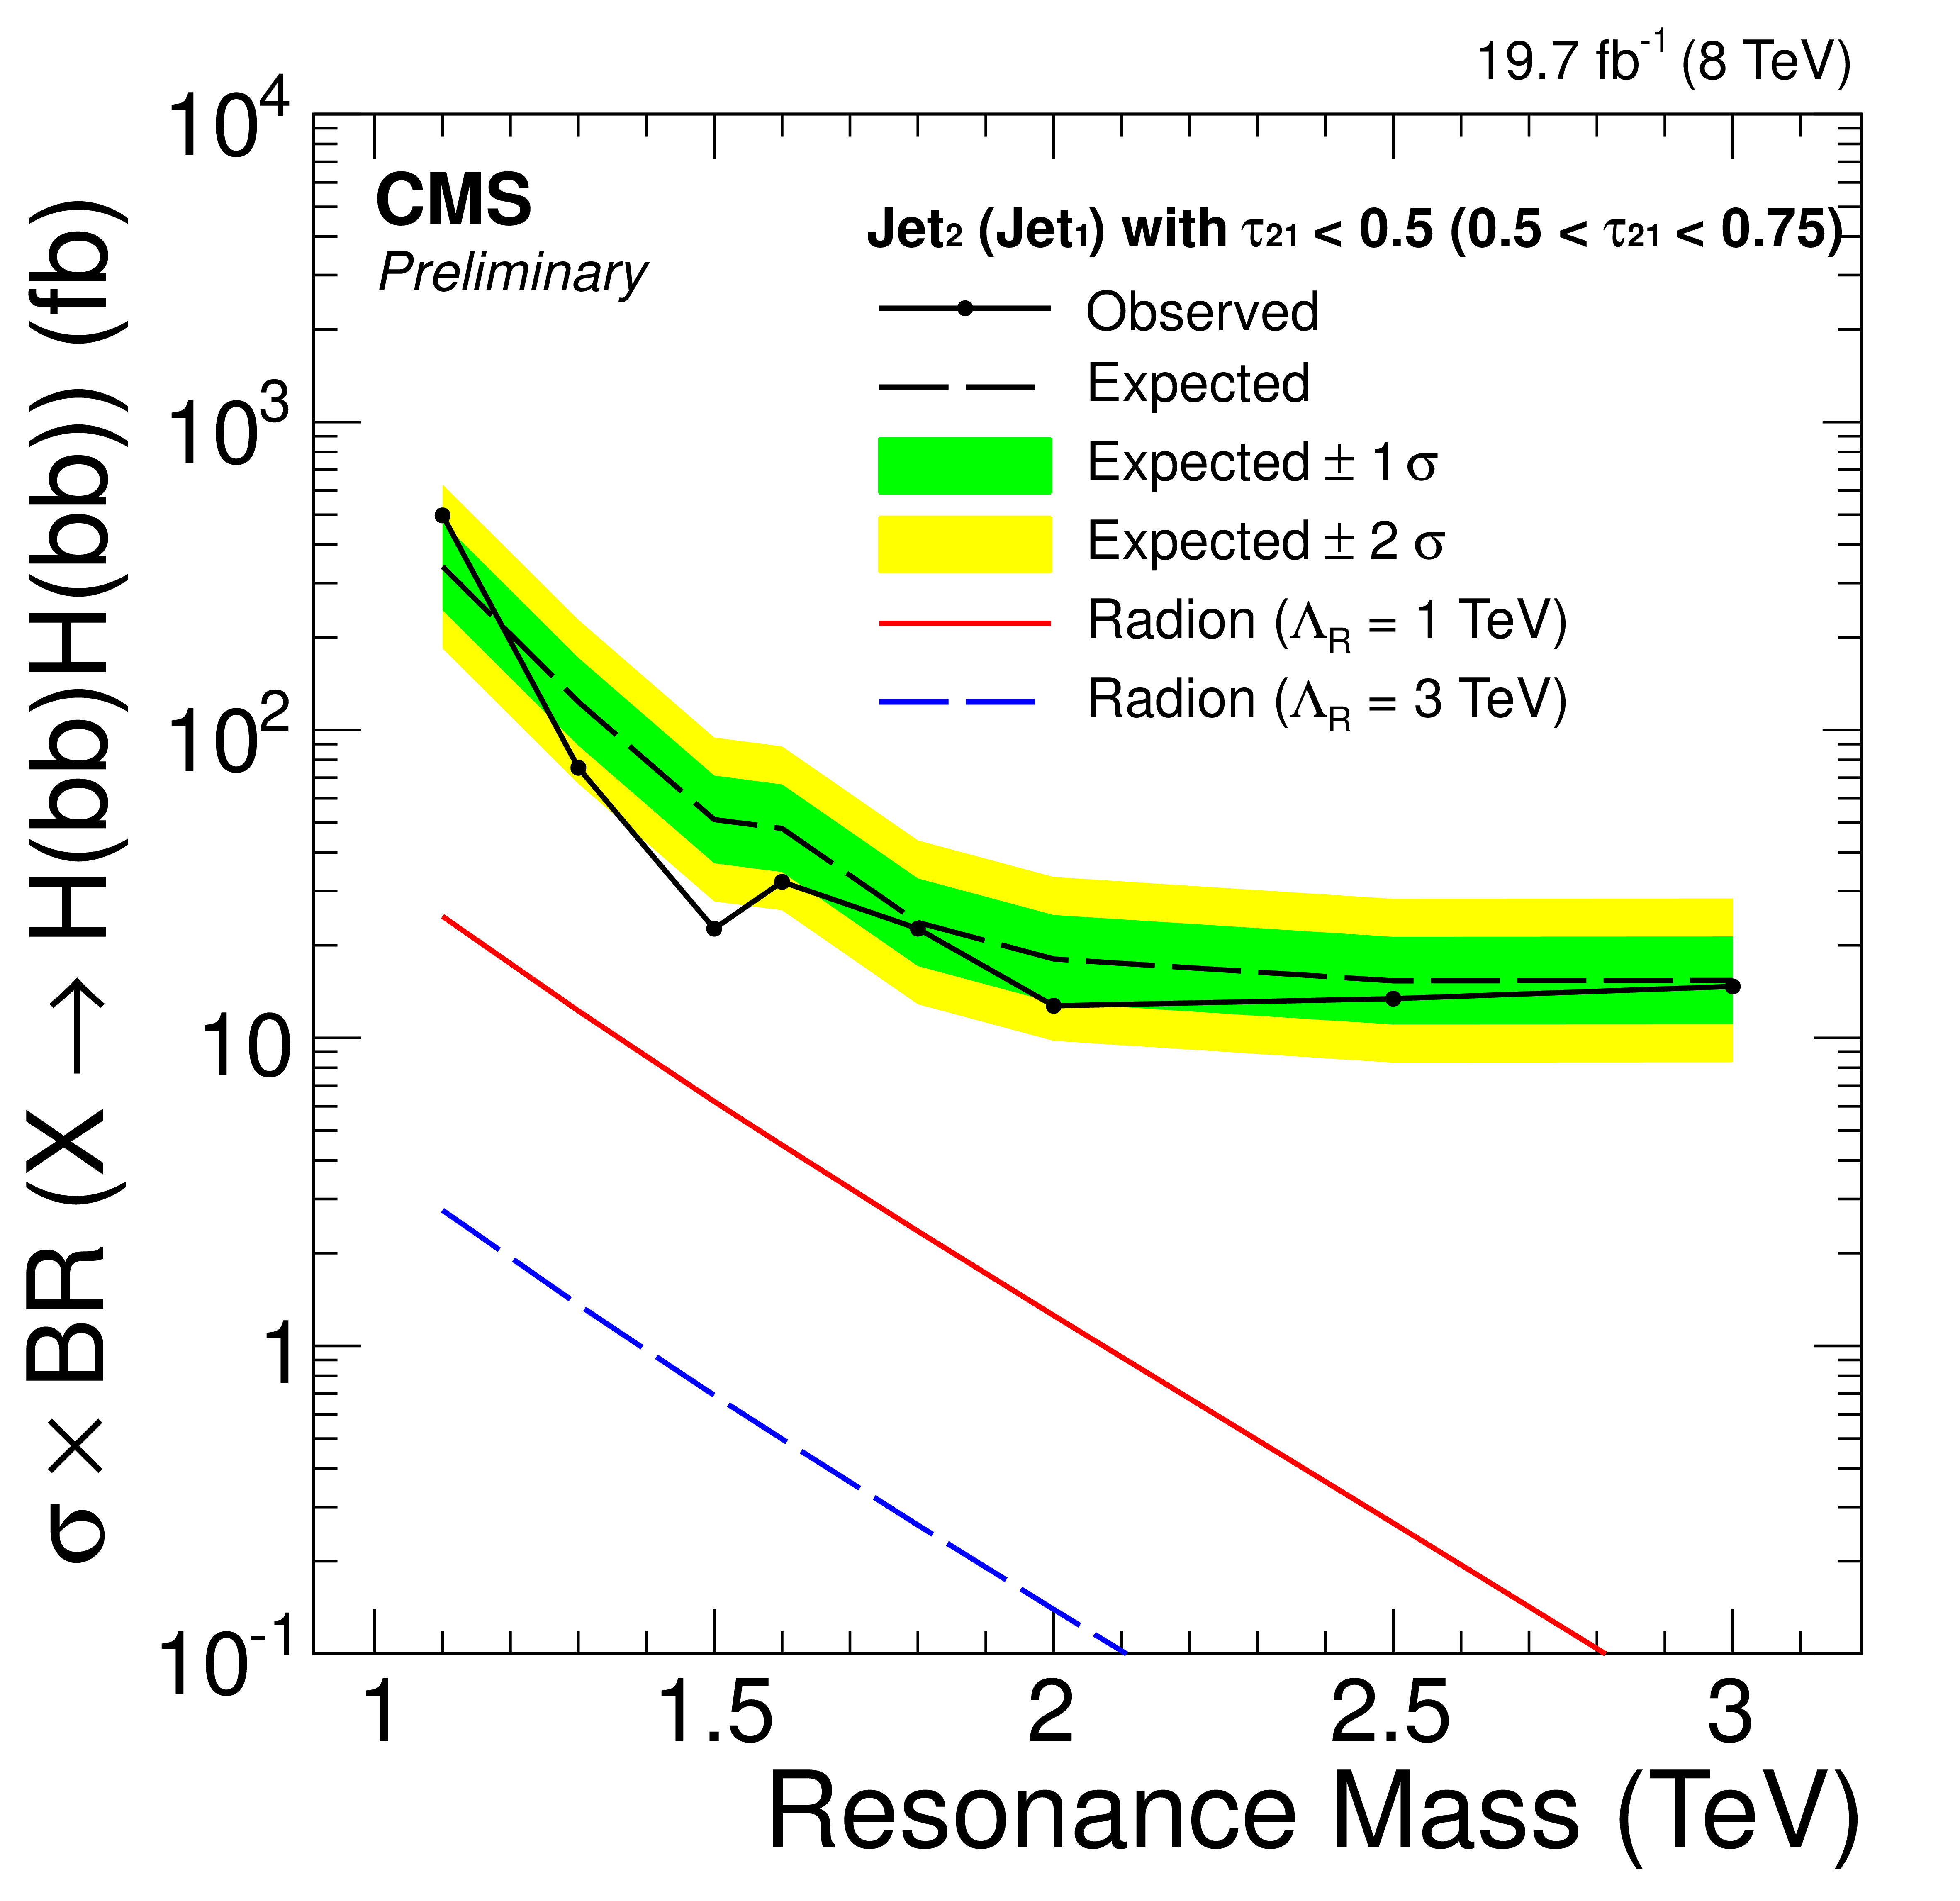
Figure 3-a:
Dijet mass distributions and exclusion limits in the individual categories. Results from the HPLP, LPHP and HPHP categories are shown in the top, middle and bottom row respectively. The left column shows the observed $m_{jj}$ distribution (points) compared to the data-driven background estimation with associated uncertainties (dotted area), with the lower pane in each plot showing the difference between the number of observed and estimated background events divided by the statistical uncertainty. The right column shows the 95% confidence level observed and expected limits, compared to theoretical predictions for a Radion model with two different scale parameters. |
png ; pdf |
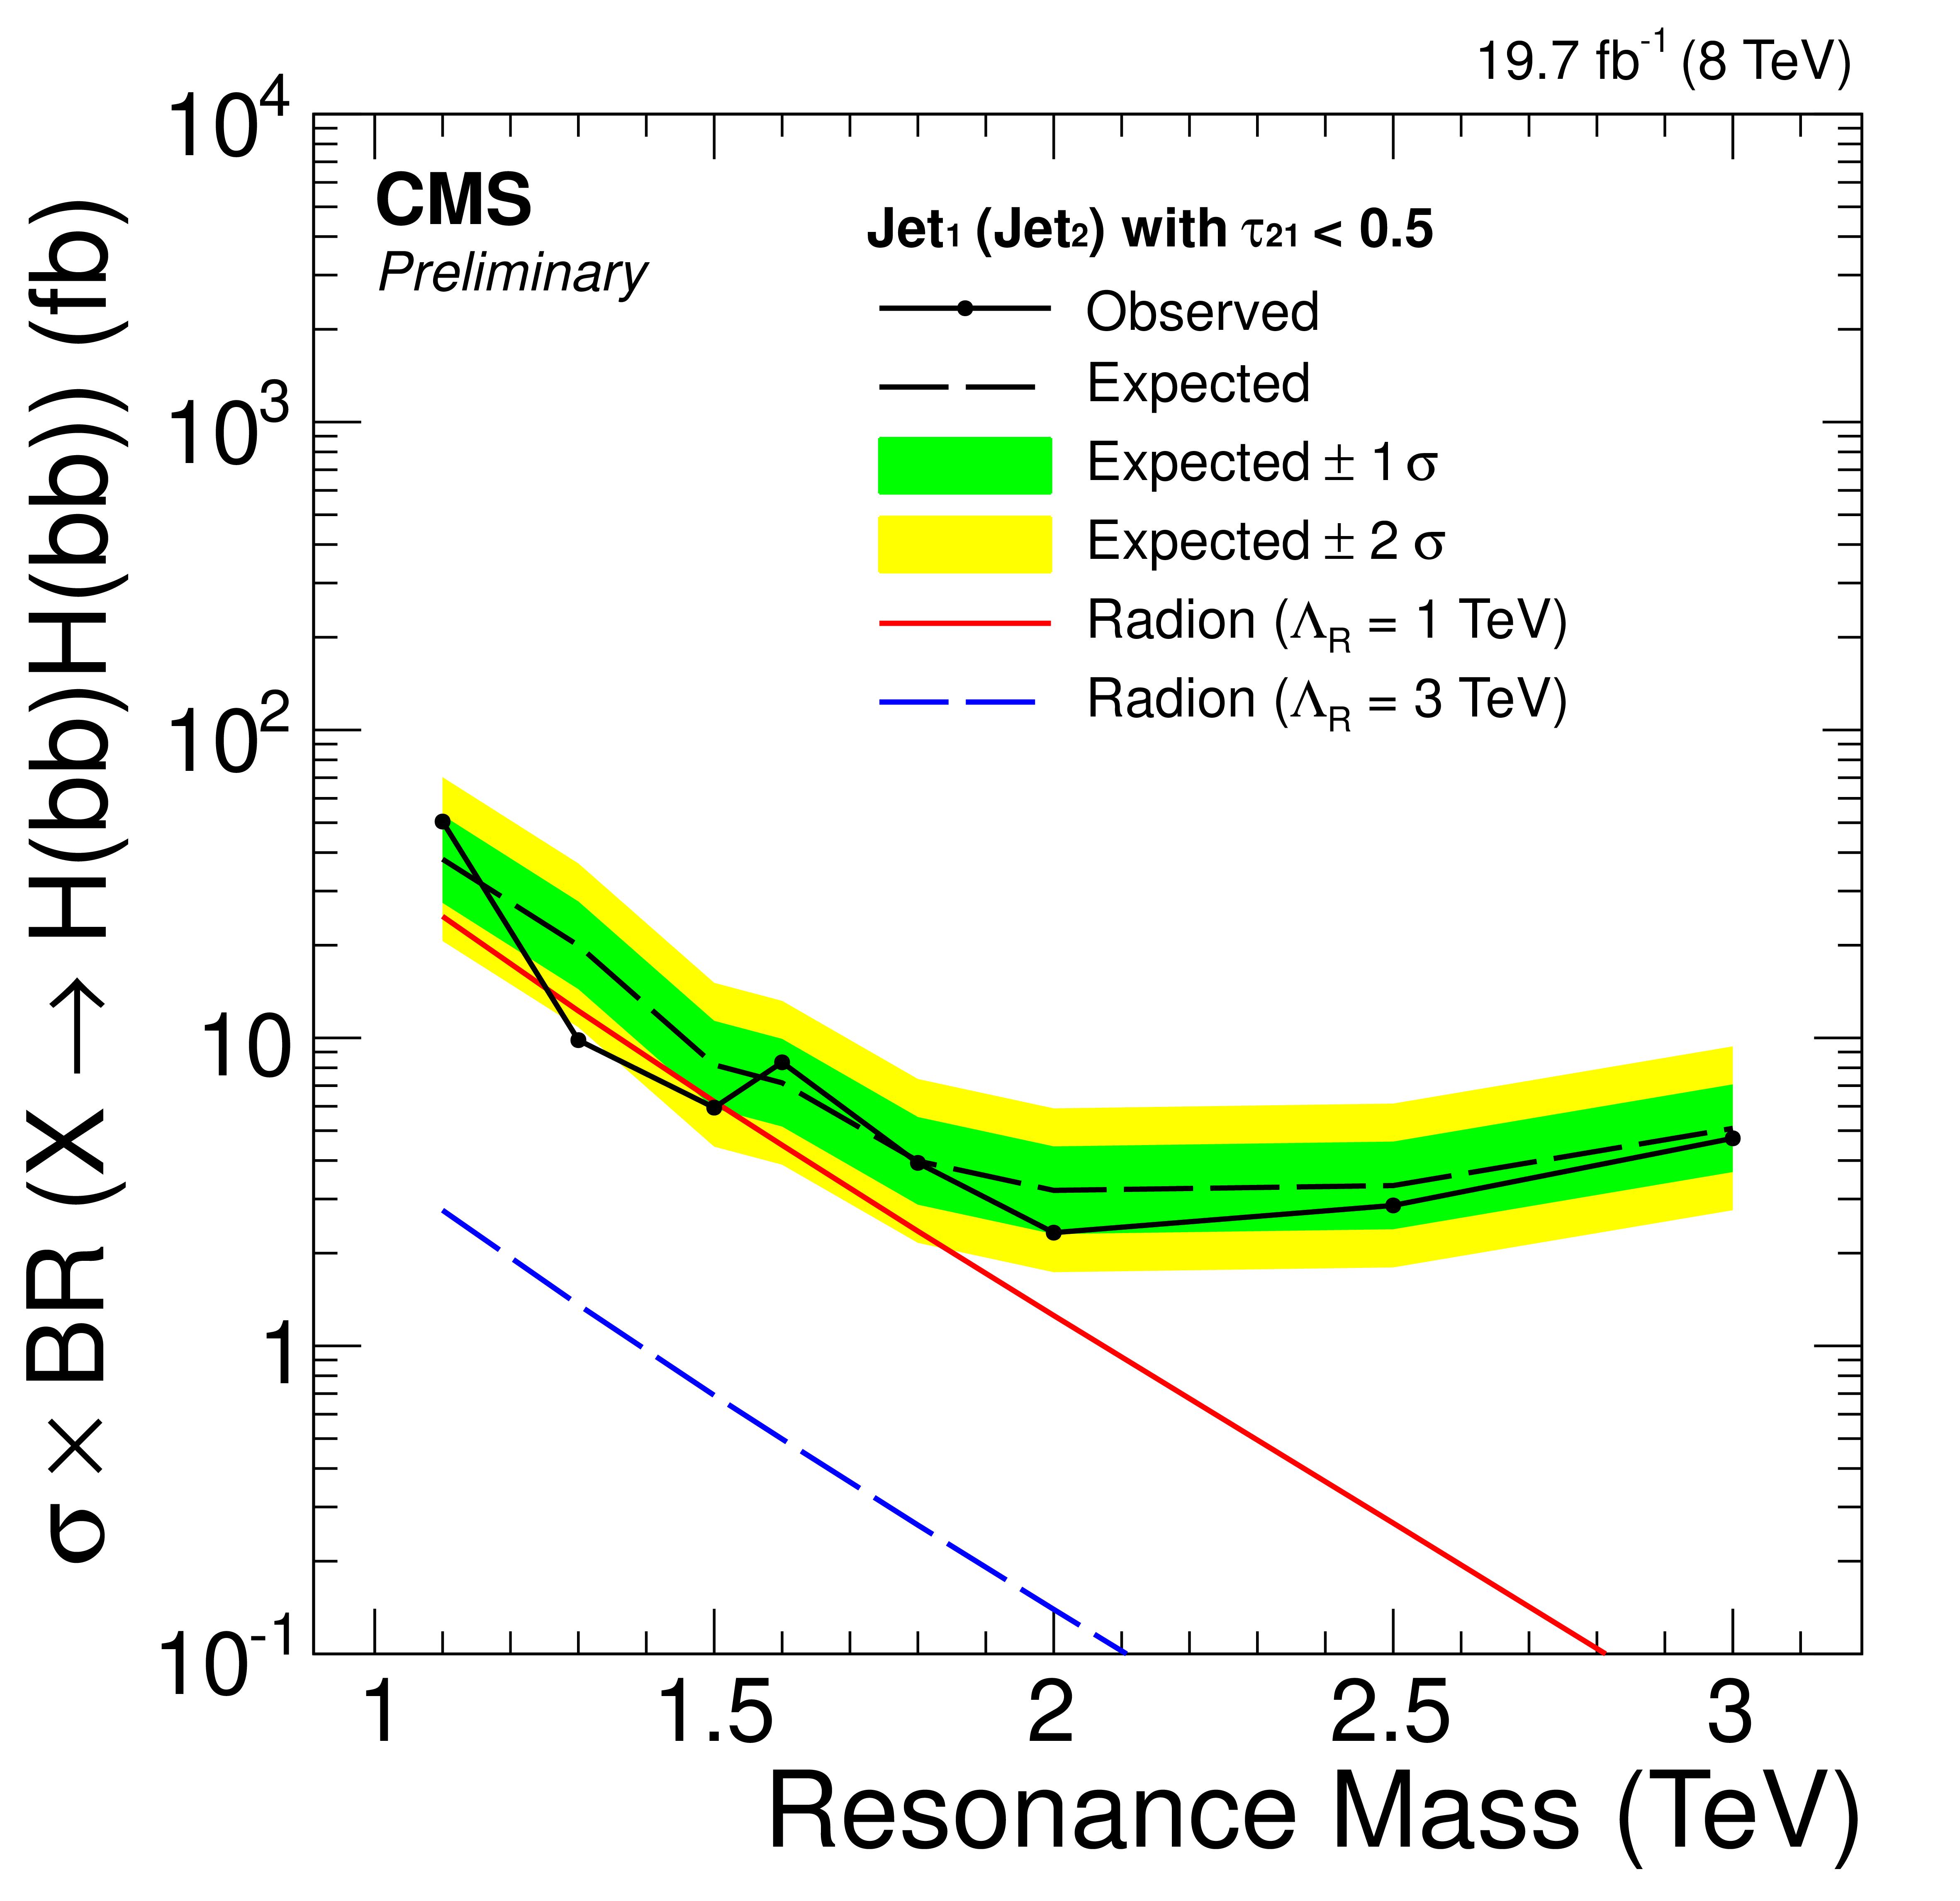
Figure 3-b:
Dijet mass distributions and exclusion limits in the individual categories. Results from the HPLP, LPHP and HPHP categories are shown in the top, middle and bottom row respectively. The left column shows the observed $m_{jj}$ distribution (points) compared to the data-driven background estimation with associated uncertainties (dotted area), with the lower pane in each plot showing the difference between the number of observed and estimated background events divided by the statistical uncertainty. The right column shows the 95% confidence level observed and expected limits, compared to theoretical predictions for a Radion model with two different scale parameters. |
png ; pdf |
Figure 3-c:
Dijet mass distributions and exclusion limits in the individual categories. Results from the HPLP, LPHP and HPHP categories are shown in the top, middle and bottom row respectively. The left column shows the observed $m_{jj}$ distribution (points) compared to the data-driven background estimation with associated uncertainties (dotted area), with the lower pane in each plot showing the difference between the number of observed and estimated background events divided by the statistical uncertainty. The right column shows the 95% confidence level observed and expected limits, compared to theoretical predictions for a Radion model with two different scale parameters. |
png ; pdf |
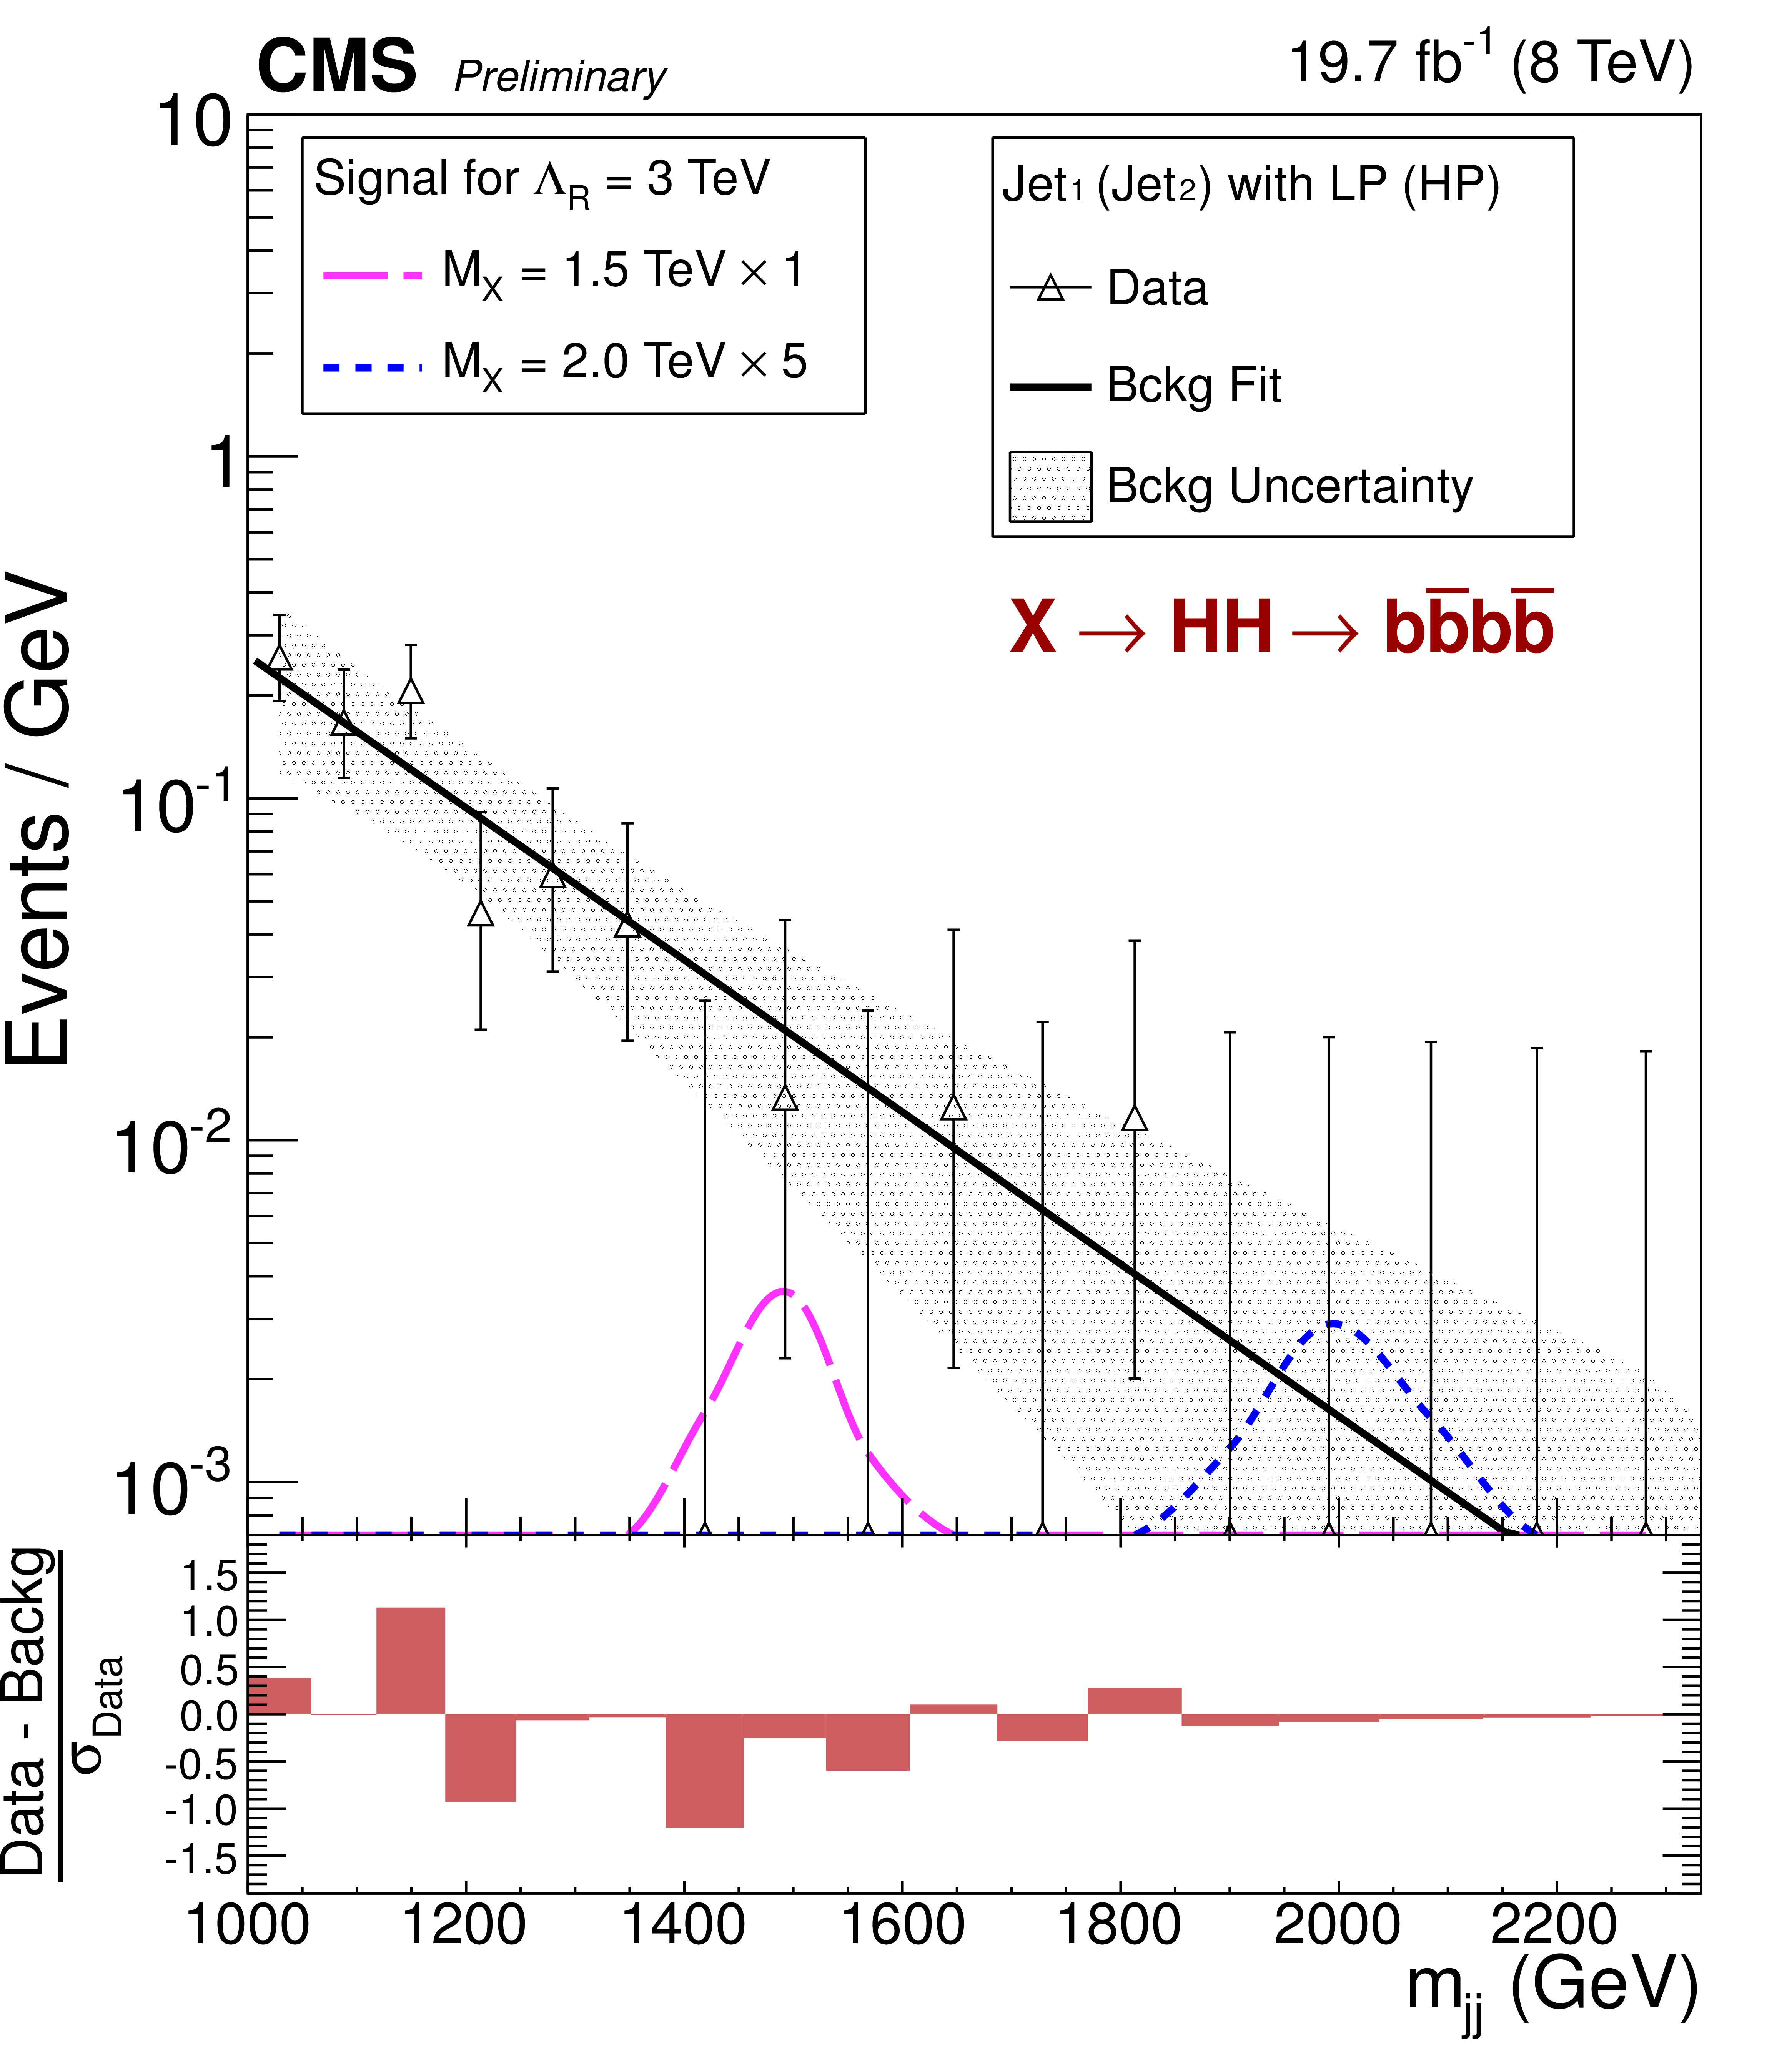
Figure 3-d:
Dijet mass distributions and exclusion limits in the individual categories. Results from the HPLP, LPHP and HPHP categories are shown in the top, middle and bottom row respectively. The left column shows the observed $m_{jj}$ distribution (points) compared to the data-driven background estimation with associated uncertainties (dotted area), with the lower pane in each plot showing the difference between the number of observed and estimated background events divided by the statistical uncertainty. The right column shows the 95% confidence level observed and expected limits, compared to theoretical predictions for a Radion model with two different scale parameters. |

png ; pdf |
Figure 3-e:
Dijet mass distributions and exclusion limits in the individual categories. Results from the HPLP, LPHP and HPHP categories are shown in the top, middle and bottom row respectively. The left column shows the observed $m_{jj}$ distribution (points) compared to the data-driven background estimation with associated uncertainties (dotted area), with the lower pane in each plot showing the difference between the number of observed and estimated background events divided by the statistical uncertainty. The right column shows the 95% confidence level observed and expected limits, compared to theoretical predictions for a Radion model with two different scale parameters. |
png ; pdf |
Figure 3-f:
Dijet mass distributions and exclusion limits in the individual categories. Results from the HPLP, LPHP and HPHP categories are shown in the top, middle and bottom row respectively. The left column shows the observed $m_{jj}$ distribution (points) compared to the data-driven background estimation with associated uncertainties (dotted area), with the lower pane in each plot showing the difference between the number of observed and estimated background events divided by the statistical uncertainty. The right column shows the 95% confidence level observed and expected limits, compared to theoretical predictions for a Radion model with two different scale parameters. |
png ; pdf |
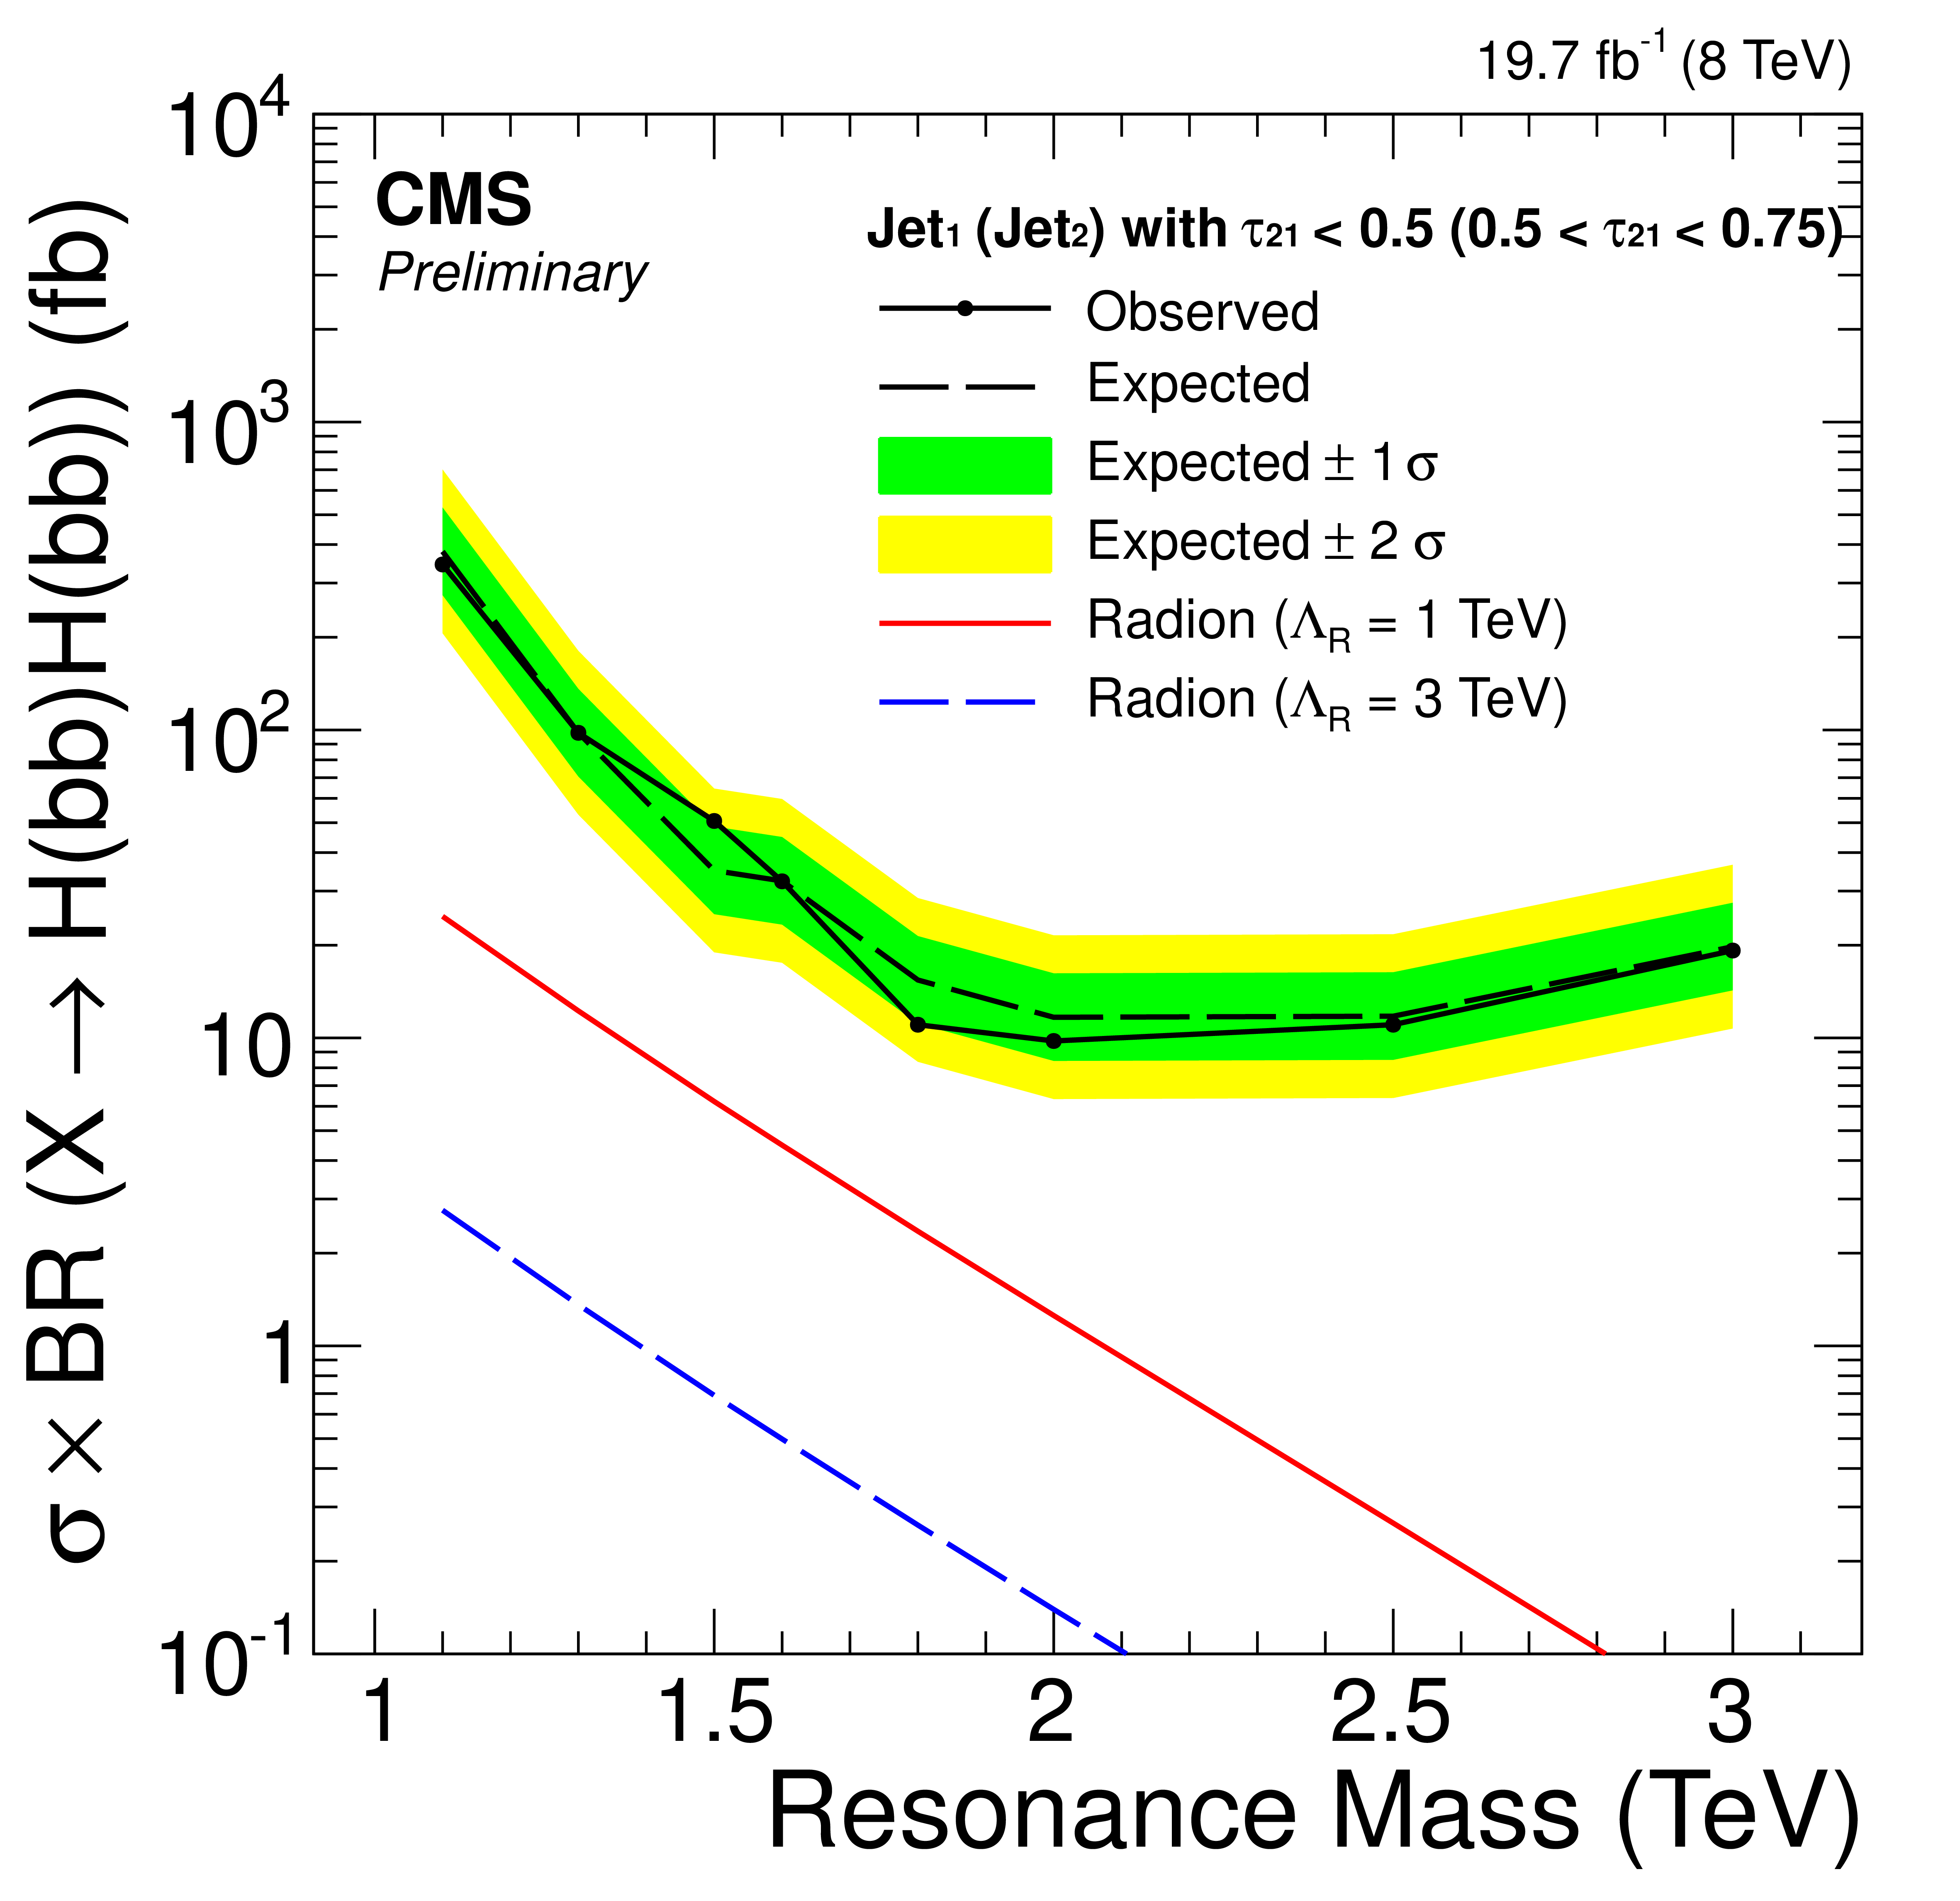
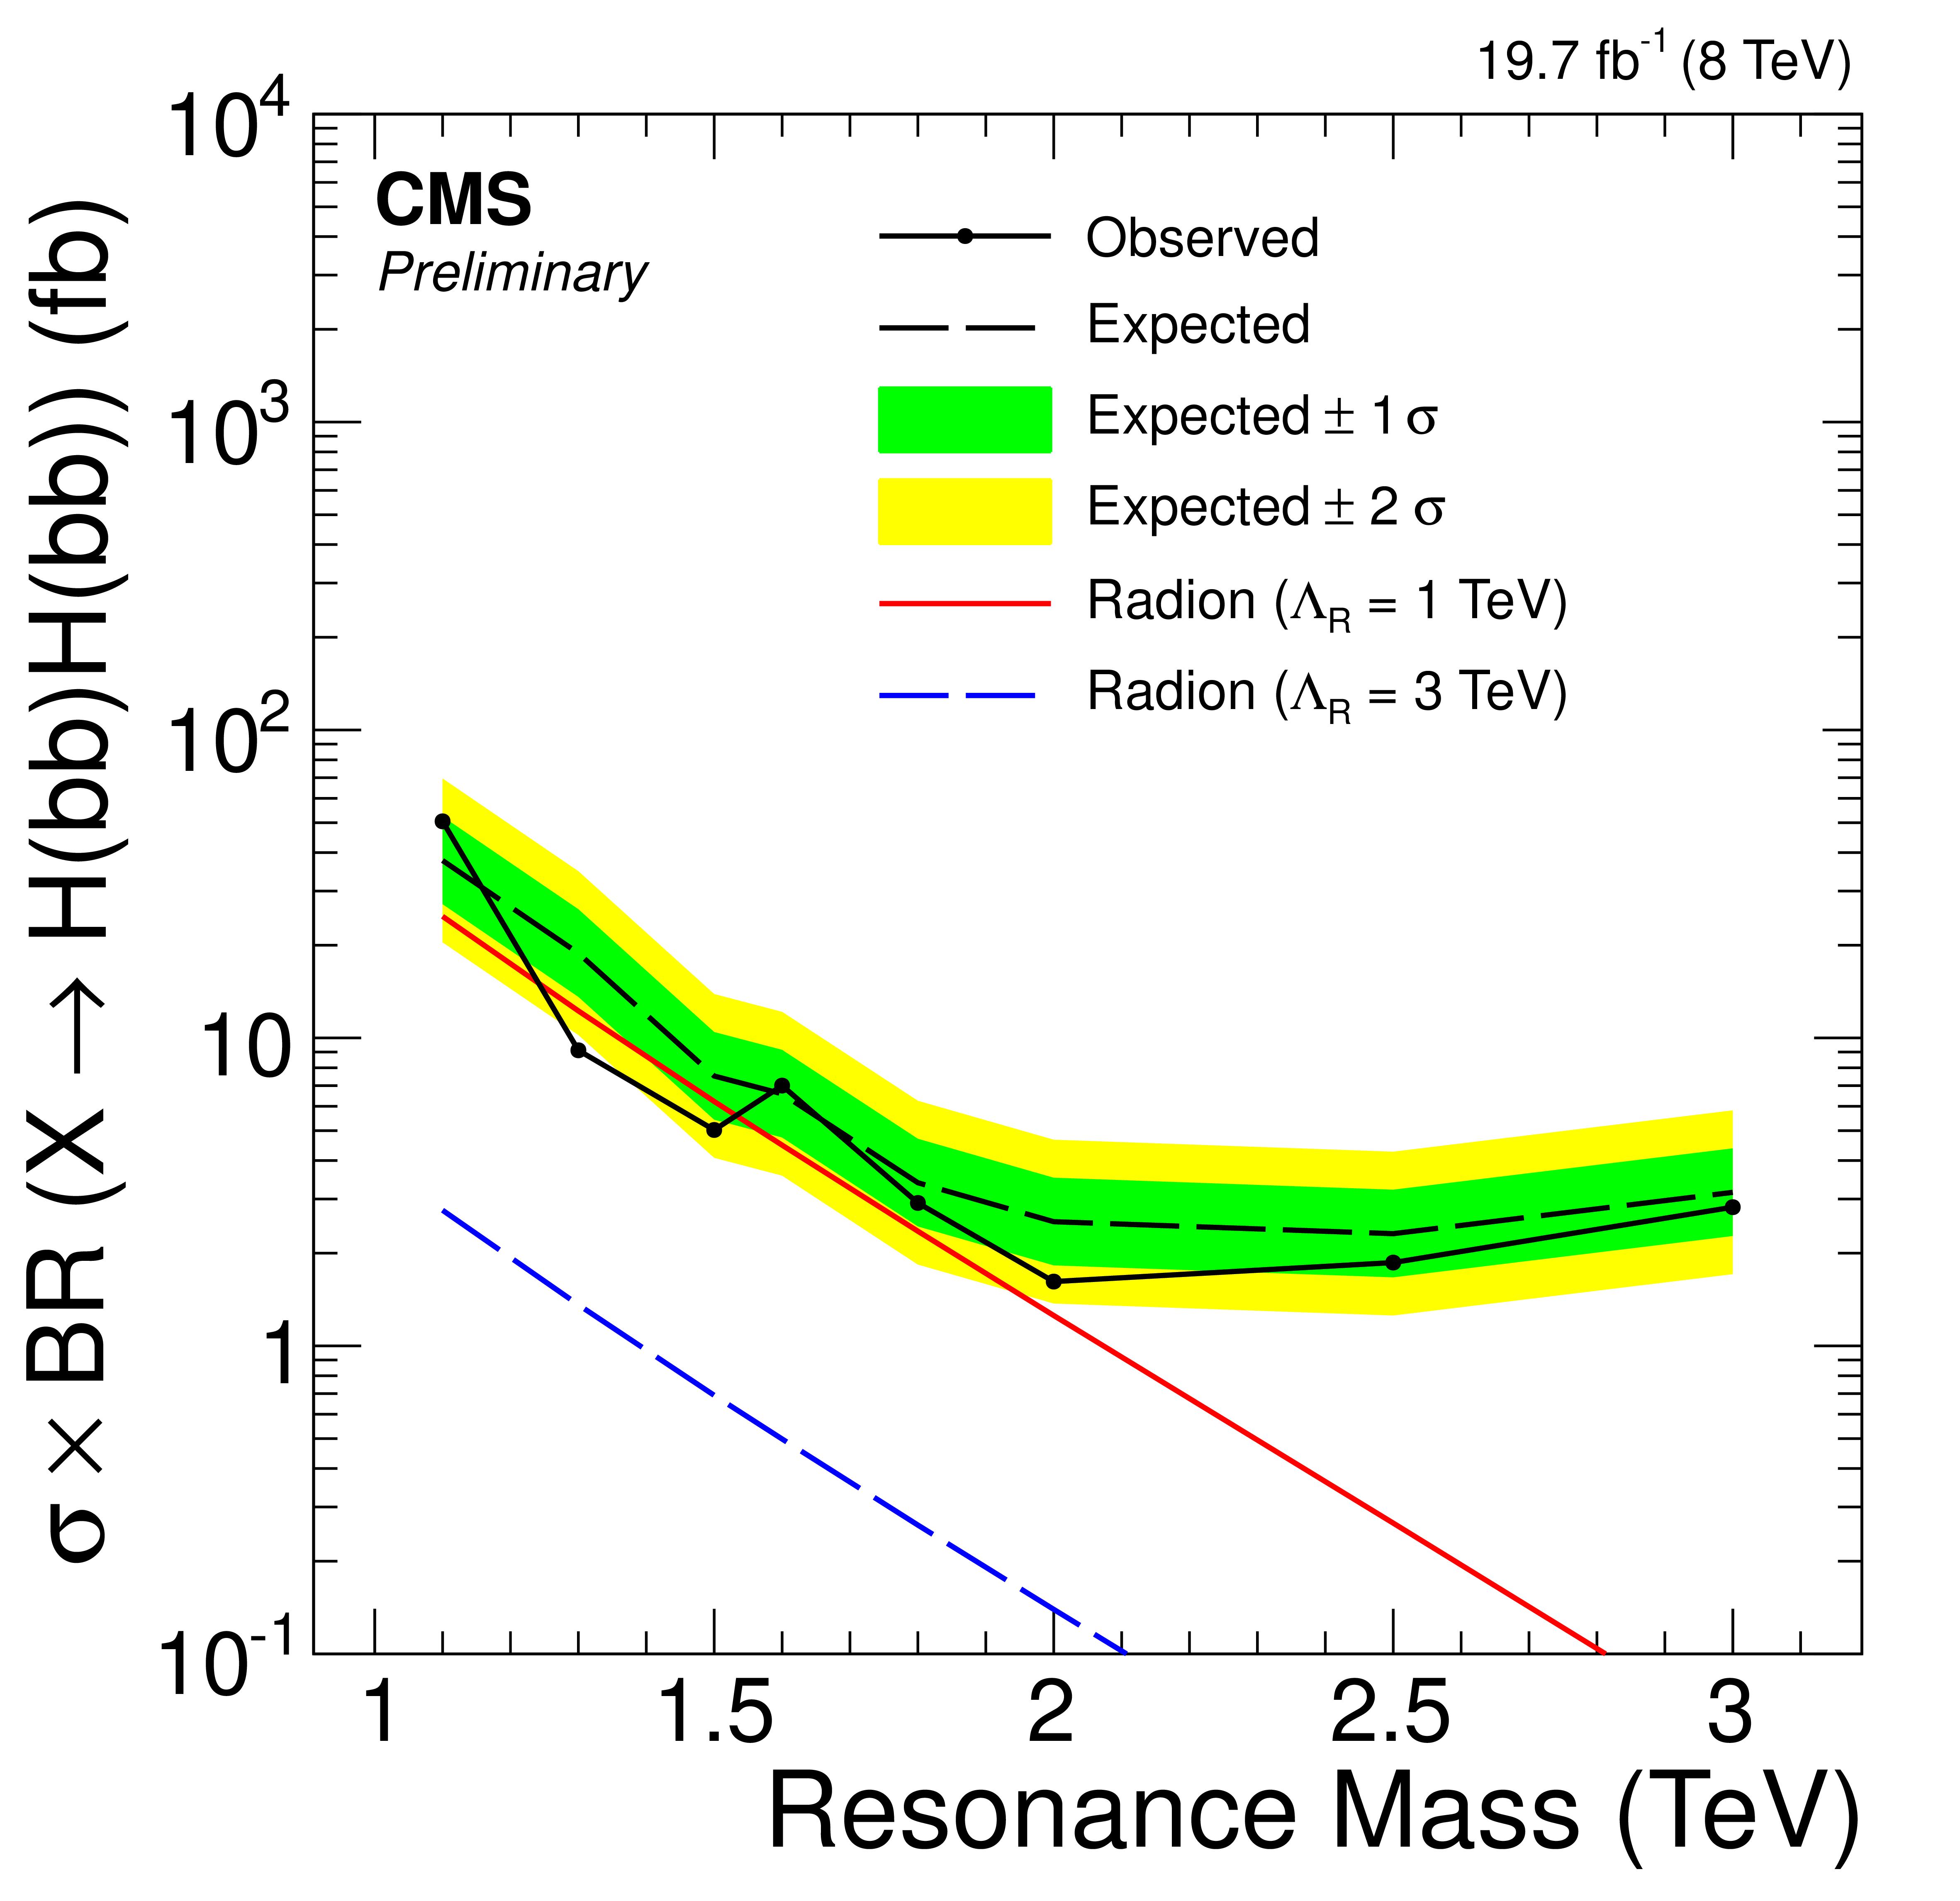
Figure 4:
The 95% confidence level observed and expected limits obtained from the combination of HPLP, LPHP and HPHP categories, compared to theoretical predictions for a Radion model with two different scale parameters. |
|
|
Compact Muon Solenoid LHC, CERN |
|

|

|

|

|

|